0261
Multi-Site Concordance of DSC-MRI Analysis for Brain Tumors: Results of a NCI Quantitative Imaging Network DSC-MRI Collaborative ProjectKathleen M Schmainda1, Melissa A Prah1, Scott D Rand2, Mark Muzi3, Swati D Rane3, Xiao Da4, Yi-Fen Yen5, Jayashree Kalpathy-Cramer5, Thomas L Chenevert6, Dariya Malyarenko6, Benjamin Hoff6, Brian Ross6, Yue Cao7, Madhava P Aryal7, Bradley Erickson8, Panagiotis Korfiatis8, Laura Bell9, Leland Hu10, and Christopher Chad Quarles9
1Radiology, Medical College of Wisconsin, Milwaukee, WI, United States, 2Radiology, Medical College of Wisconsin, WI, United States, 3Radiology, University of Washington, WA, United States, 4Radiology, Massachusetts General Hospital, MA, United States, 5Radiology, Massachusetts General Hospital, Charlestown, MA, United States, 6Radiology, University of Michigan, Ann Arbor, MI, United States, 7Radiation Oncology, University of Michigan, Ann Arbor, MI, United States, 8Mayo Clinic, MN, United States, 9Barrow Neurological Institute, Phoenix, AZ, United States, 10Radiology, Mayo Clinic, Phoenix, AZ, United States
Synopsis
Though DSC-MRI perfusion is of well-known benefit for the evaluation of brain tumors, clinical translation has been hampered by a lack of confidence in the consistency of the derived RCBV (relative cerebral blood volume) and cerebral blood flow (CBF) values across sites and platforms. This multi-site and multi-platform study, for which the same patient data set was analyzed, demonstrated substantial consistency in RCBV across software sites and platforms and the ability of each to distinguish low-grade from high-grade tumor. In addition, a single RCBV threshold was identified for which all platforms maintained good accuracy.
Purpose
To reach consensus regarding the post-processing of DSC-MRI data through a comparison of multi-site/multi-platform analyses of a shared brain tumor patient data set.Methods
A total of 49 low-grade (n=13) and high-grade (n=36) glioma DSC-MRI datasets were uploaded to the cancer imaging archive (TCIA). All glioma grades were confirmed by histopathology within 41 days following the DSC-MRI study. The datasets were co-registered with T1w images and included a predetermined AIF, necessary for the determination of CBF, ROIs of whole brain for efficient DSC processing, normal appearing white matter (NAWM), for the creation of normalized parameter maps, normal appearing cerebral cortex (NACC), as well as enhancing tumor ROIs. The DSC-MRI datasets were obtained after a contrast agent preload of 0.05-0.1 mmol/kg Gd. The preload diminishes contrast agent leakage effects that can confound the determination of relative cerebral blood volume (rCBV)1, 2. The DSC-MRI data was obtained using a GRE-EPI sequence (TE/TR=30/1200ms; flip angle=72o, slice=5mm). Data was collected for 120s with 0.1 mmol/kg Gd injected at 60s. Seven sites using seven different software (SW) platforms provided median ROI values for 18 different normalized rCBV (nRCBV), 2 standardized rCBV (sRCBV) and 12 normalized CBF (nCBF) metrics. Details for each SW platform entry are listed in Figure 1. (Note that several sites used more than one platform with several sites using the same vendor platform.) A matrix of all values was created with agreement between each pair of values assessed with the Linn’s Concordance Correlation Coefficient (LCCC). An LCCC>0.8 indicates good agreement. The ability of each metric to distinguish low-grade (LG) from high-grade (HG) brain tumor was also determined, using P<0.05 as the level of significance. Next, ROC curves were constructed and the Pythagorean theorem used to identify the threshold that gives the best sensitivity (SN) and specificity (SP) for each individual method. Finally, whether ONE threshold could be identified, for which the SN/SP is at least 0.8 for all methods, was determined for both nRCBV and nCBF.Results
Examples of post-contrast images and T1+C ROIs, uploaded to TCIA, are shown in Figure 2 along with example nRCBV and nCBF results. Figure 3 lists each nRCBV entry on both axes and the LCCC for each pair of entries. For tumor nRCBV 75% of the entries showed excellent agreement with 0.9<LCCC<1.0 and 19% with very good agreement 0.80<LCCC<0.89. For nCBF only 59% had 0.90<LCCC<1.0 and 34% with 0.80<LCCC<0.89. The agreement was worst for NACC (lower-left values below the diagonal) with only 35% of nRCBV pairs and 18% of nCBF pairs in the highest LCCC category. While all analyses demonstrated the ability to distinguish LG from HG tumor (P<0.0001), the thresholds to make this distinction varied from 1.23 to 1.75 (Figure 4), with SN of 83-97% and SP of 77-85%. However, all nRCBV entries maintain a minimum SN and SP of 0.8 if a threshold of 1.45 is used as shown in Figure 5 where the ROC curves for all entries are plotted. The best SN/SP for each method is indicated by the black diamonds. Likewise, nCBF could be used to distinguish LG from HG tumor (P<0.01). A single threshold for which all entries maintained a SN/SP of at least 0.8 could not be identified. At best, all nCBF entries maintained a SN and SP greater than 0.639 for a threshold of 1.84.Discussion
Despite a wealth of promising studies demonstrating the value of DSC-MRI perfusion metrics for the evaluation of brain tumors, clinical translation has been hampered by a lack of confidence in the consistency of nRCBV values across sites and platforms3-6. This study, which used well-controlled DSC-MRI data sets, demonstrated substantial consistency across sites and platforms. The concordance between each pair of entries was, in general, excellent for tumor and best when leakage-correction algorithms were applied. All platforms were able to distinguish LG from HG brain tumor, but demonstrated a range of threshold values, based on maximum SN/SP. However, it was determined that all platforms can achieve a SN/SP of at least 0.8 when a nRCBV threshold of 1.45 is used. The results for nCBF are similar but less concordant and with lower achievable SN/SP for a given threshold value.Conclusion
This well-controlled study demonstrates substantial consistency across software post-processing platforms for the determination of nRCBV maps and suggests a common threshold to distinguish LG from HG tumor. These results should substantially improve confidence in perfusion MRI analysis for the evaluation of brain tumors, thereby resulting in more widespread clinical adoption.Acknowledgements
U01CA176110, U01CA148131, U24CA180927, U01CA166104, U01CA154601, U01CA16004, U01CA183848, R01CA158079
References
1. Schmainda, K.M., S.D. Rand, A.M. Joseph, et al., Characterization of a first-pass gradient-echo spin-echo method to predict brain tumor grade and angiogenesis. AJNR Am J Neuroradiol, 2004. 25(9): p. 1524-32. 2. Boxerman, J.L., K.M. Schmainda, and R.M. Weisskoff, Relative cerebral blood volume maps corrected for contrast agent extravasation significantly correlate with glioma tumor grade, whereas uncorrected maps do not. AJNR Am J Neuroradiol, 2006. 27(4): p. 859-67. 3. Law, M., R.J. Young, J.S. Babb, et al., Gliomas: predicting time to progression or survival with cerebral blood volume measurements at dynamic susceptibility-weighted contrast-enhanced perfusion MR imaging. Radiology, 2008. 247(2): p. 490-8. 4. Sugahara, T., Y. Jorogi, S. Tomiguchi, et al., Posttherapeutic intraaxial brain tumor: the value of perfusion-sensitive contrast-enhanced MR imaging for differentiating tumor recurrence from nonneoplastic contrast-enhancing tissue. American Journal of Neuroradiology, 2000. 21: p. 901-909. 5. Hu, L.S., L.C. Baxter, K.A. Smith, et al., Relative cerebral blood volume values to differentiate high-grade glioma recurrence from posttreatment radiation effect: direct correlation between image-guided tissue histopathology and localized dynamic susceptibility-weighted contrast-enhanced perfusion MR imaging measurements. AJNR Am J Neuroradiol, 2009. 30(3): p. 552-8. 6. Kong, D.S., S.T. Kim, E.H. Kim, et al., Diagnostic dilemma of pseudoprogression in the treatment of newly diagnosed glioblastomas: the role of assessing relative cerebral blood flow volume and oxygen-6-methylguanine-DNA methyltransferase promoter methylation status. AJNR Am J Neuroradiol, 2011. 32(2): p. 382-7.Figures
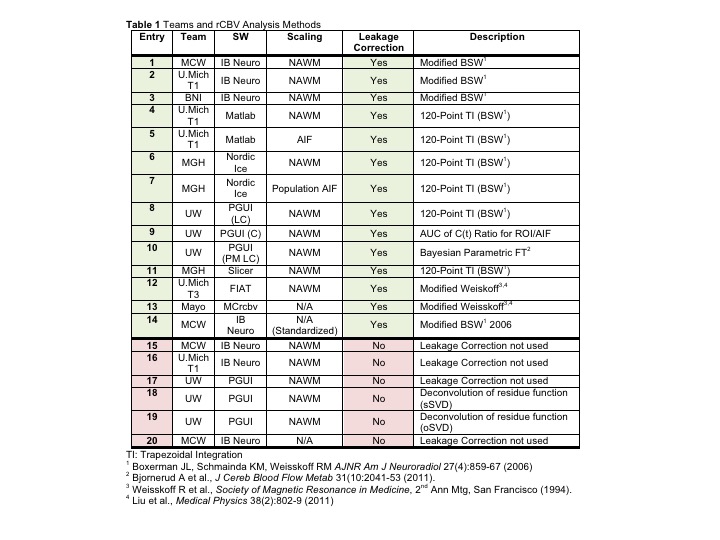
Figure 1. Table with details of each entry for the multi-site/multi-platform DSC-MRI data analyses. Listed are each team and software (SW) platform used, as well as whether or not scaling (i.e. normalization) or leakage correction were used and additional descriptions of the SW algorithms.
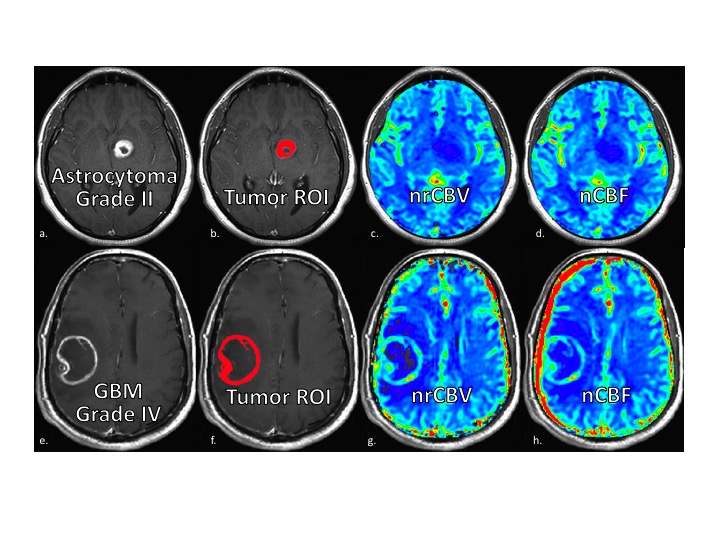
Figure 2. Example images for two patients, one with a low-grade (upper row) and another with a high-grade tumor (bottom row). Shown are the post-contrast T1-weighted images (a,e) and T1+C ROIs (b,f),
uploaded to TCIA, as well as the corresponding nRCBV (c,g) and nCBF maps (d,h) created for each patient data set.
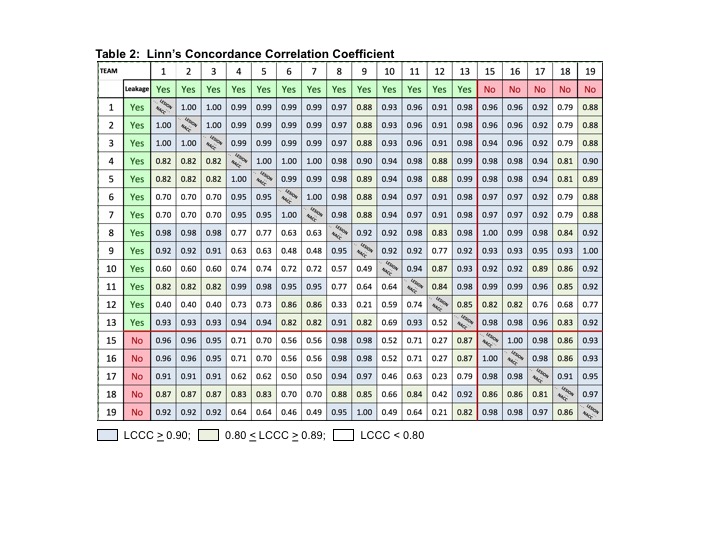
Figure 3. Concordance across SW platforms for nRCBV as indicated by Linn's Concordance Correlation Coefficient (LCCC) listed for each pair of entries. For tumor nRCBV 75% of the entries showed
excellent agreement with 0.9<LCCC<1.0 and 19% with very
good agreement 0.80<LCCC<0.89. For nCBF only 59% had 0.90<LCCC<1.0
and 34% with 0.80<LCCC<0.89. The agreement was worst for NACC (lower-left
values below the diagonal) with only 35% of nRCBV pairs and 18% of nCBF pairs in
the highest LCCC category.
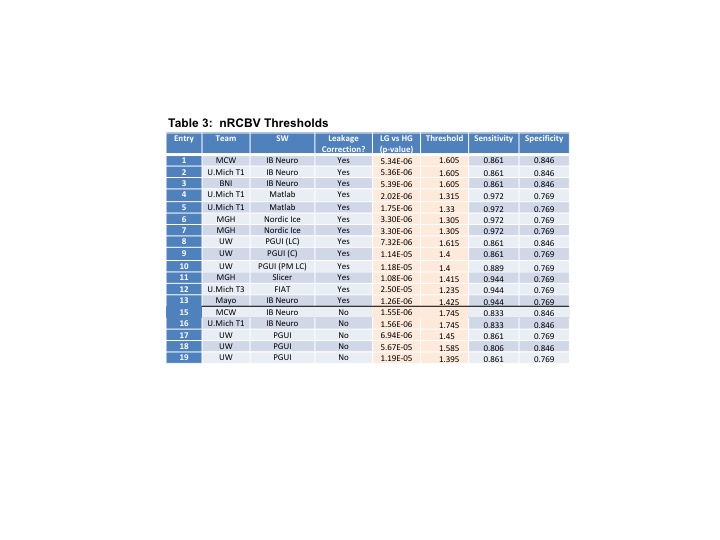
Figure 4. Ability of nRCBV to distinguish LG from HG tumor. Listed in the table are the P-values as well as threshold values that gave the maximum sensitivity (SN) and specificity (SP) to distinguish LG from HG glioma.
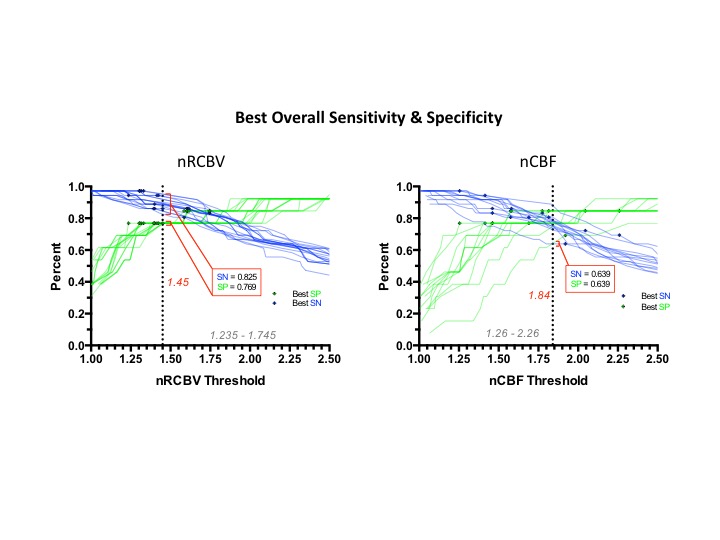
Figure 5. ROC curves for all software entries for both nRCBV (a) and nCBF (b). The best sensitivity and specificity for each individual method is indicated by the black diamonds shown on each ROC curve.
A threshold of 1.45 for which all nRCBV entries maintained a SN/SP of at least 0.8 was identified. At best, all nCBF entries
maintained a SN and SP greater than 0.639 for a threshold of 1.84.