0260
Multiparameter MRI Predictors of Extreme Survival in Glioblastoma Multiforme1Cancer Imaging & Metabolism, Moffitt Cancer Center, Tampa, FL, United States, 2IRAT Shared Service, Moffitt Cancer Center, Tampa, FL, United States, 3Diagnostic Imaging & Interventional Radiology, Moffitt Cancer Center, Tampa, FL, United States
Synopsis
We retrospectively analyzed initial MRI scans in two cohorts diagnosed with Glioblastoma Multiforme (GBM). The Long-Term Survival (LTS) cohort included 13 subjects who survived >36 months post-diagnosis, while the Short-Term Survival (STS) cohort included 12 subjects who survived ≤18 months. Tumor voxels were clustered by the normalized signal intensities on post-contrast T1w and FLAIR sequences into 6 distinct “habitats”. The LTS cohort were found to have a significantly higher fraction of Habitat 6 (high signal on T1w and FLAIR sequences) and lower fraction of Habitat 2 (low signal on T1w and high signal on FLAIR) compared with the STS cohort.
PURPOSE
This study is motivated by our conceptual model of GBMs as spatially heterogeneous complex adaptive systems in which tumor growth and response to therapy are governed by eco-evolutionary interactions between the tumor microenvironment and phenotypic properties of local cellular populations. In this model, we hypothesize that radiologically-apparent heterogeneity within GBMs can be viewed as distinct “habitats”, each of which may have different patterns of growth and invasion and may respond differently to therapy.1 Here we use image analytic techniques to define and quantify spatial variations in MRI scans of GBMs performed at the time of diagnosis and associate them with overall survival.METHODS
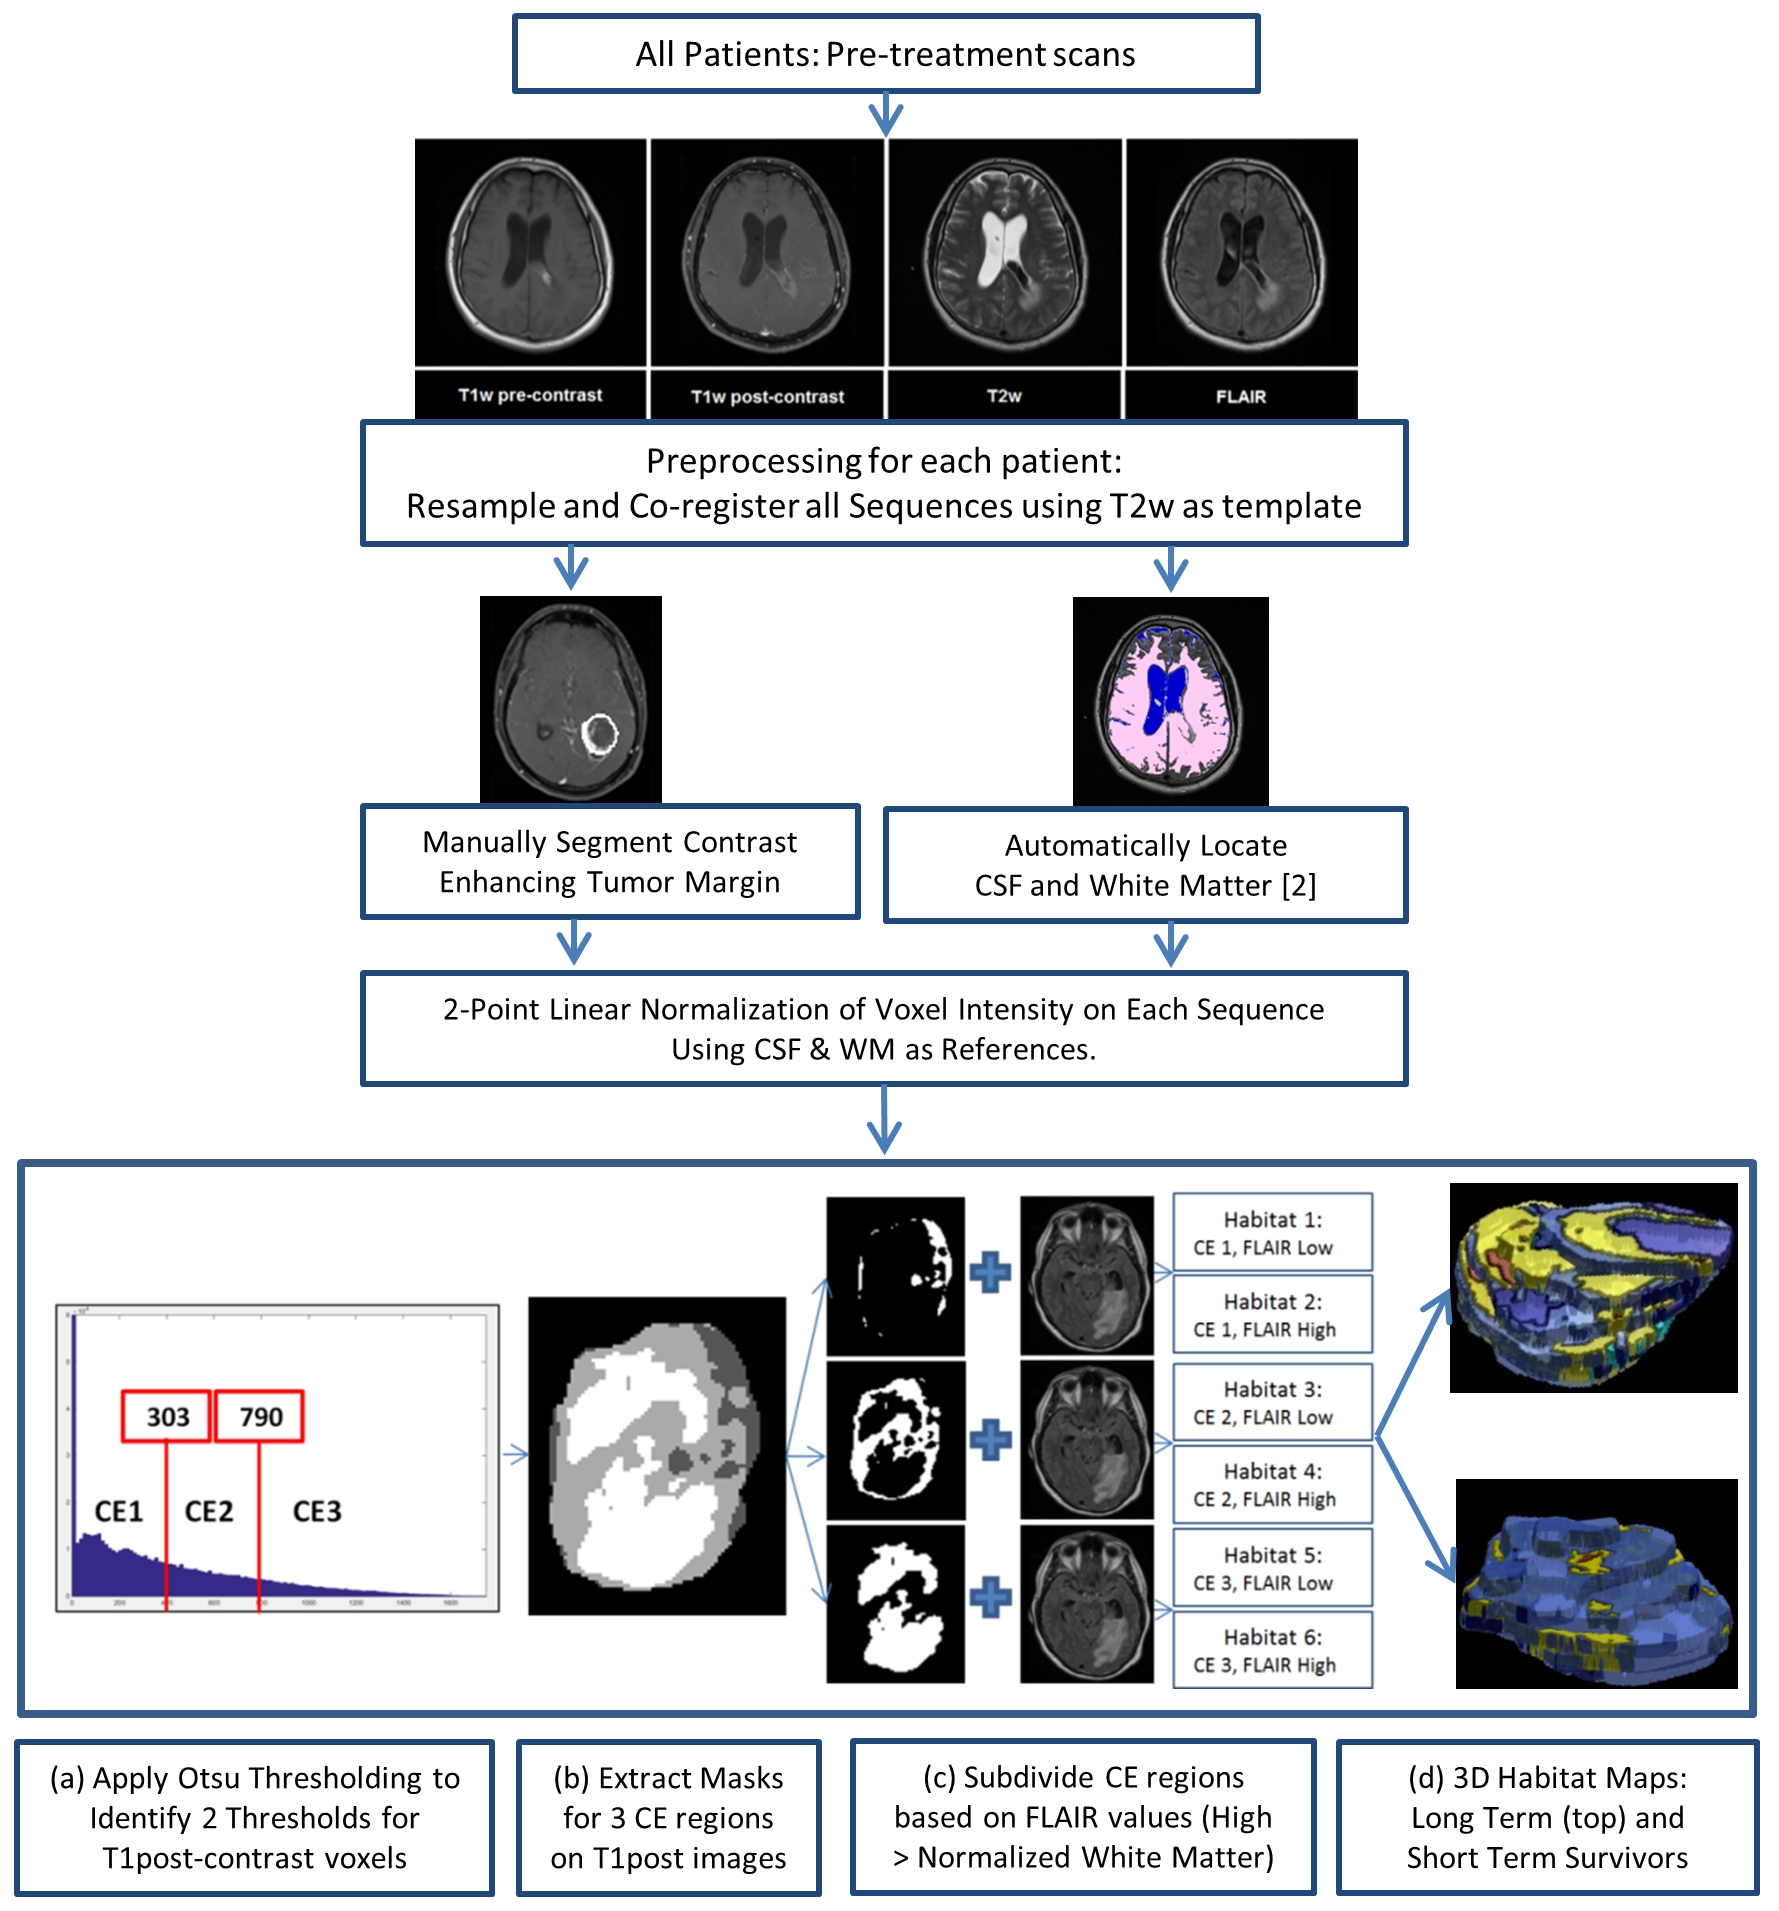
Following IRB approval, we analyzed 25 patients with pathologically confirmed primary GBM who had available pre-operative T2-weighted (T2w), FLAIR, T1-weighted (T1w, pre- and post-contrast) scans, and Apparent Diffusion Coefficient (ADC) maps. The LTS cohort included 13 subjects who survived more than 36 months post-diagnosis (median survival 60 months, range 37-106 months), while the STS cohort included 12 subjects who survived 18 months or less post-diagnosis (median survival 11 months, range 2-18 months). A flowsheet summarizing the image processing is depicted in Figure 1. Voxels within the tumor on normalized images were clustered into three levels of contrast enhancement (CE1 – low enhancement, CE2 – medium enhancement, CE3 – high enhancement). These 3 clusters were further sub-clustered into two classes based on appearance on the FLAIR sequence (> or < cohort mean WM intensity). We hypothesize that these 6 clusters represent 6 distinct “habitats” within the tumor. Total and relative volumes of each habitat were calculated in each tumor.RESULTS
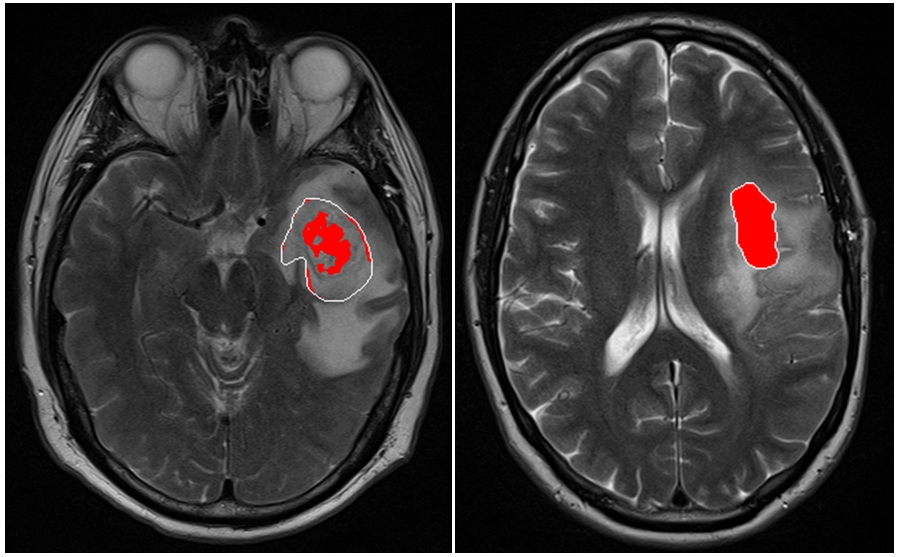
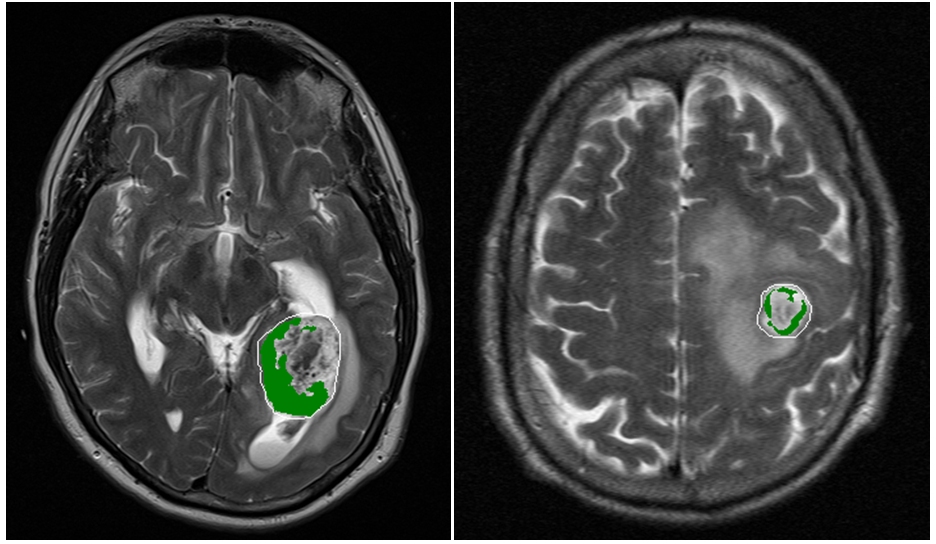
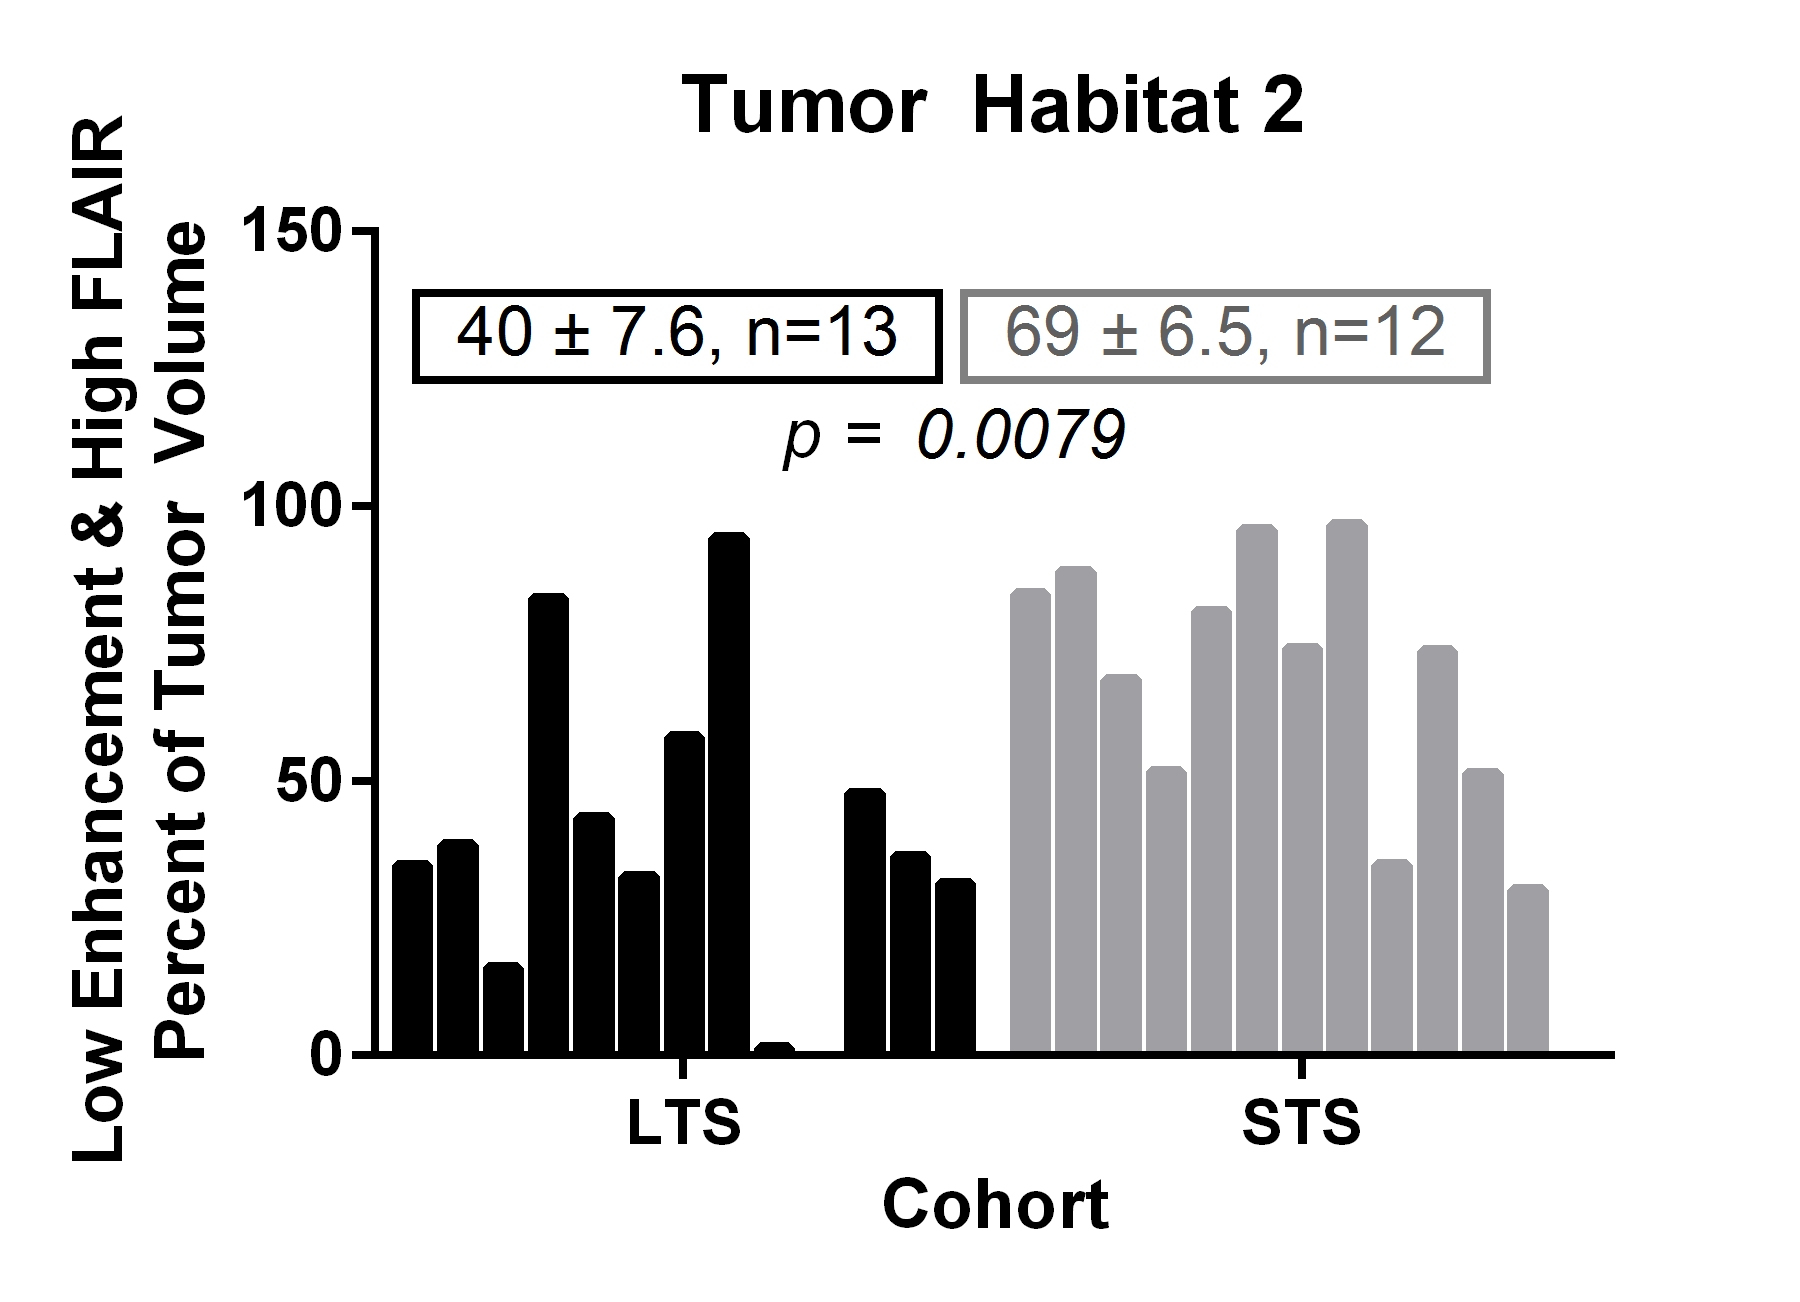
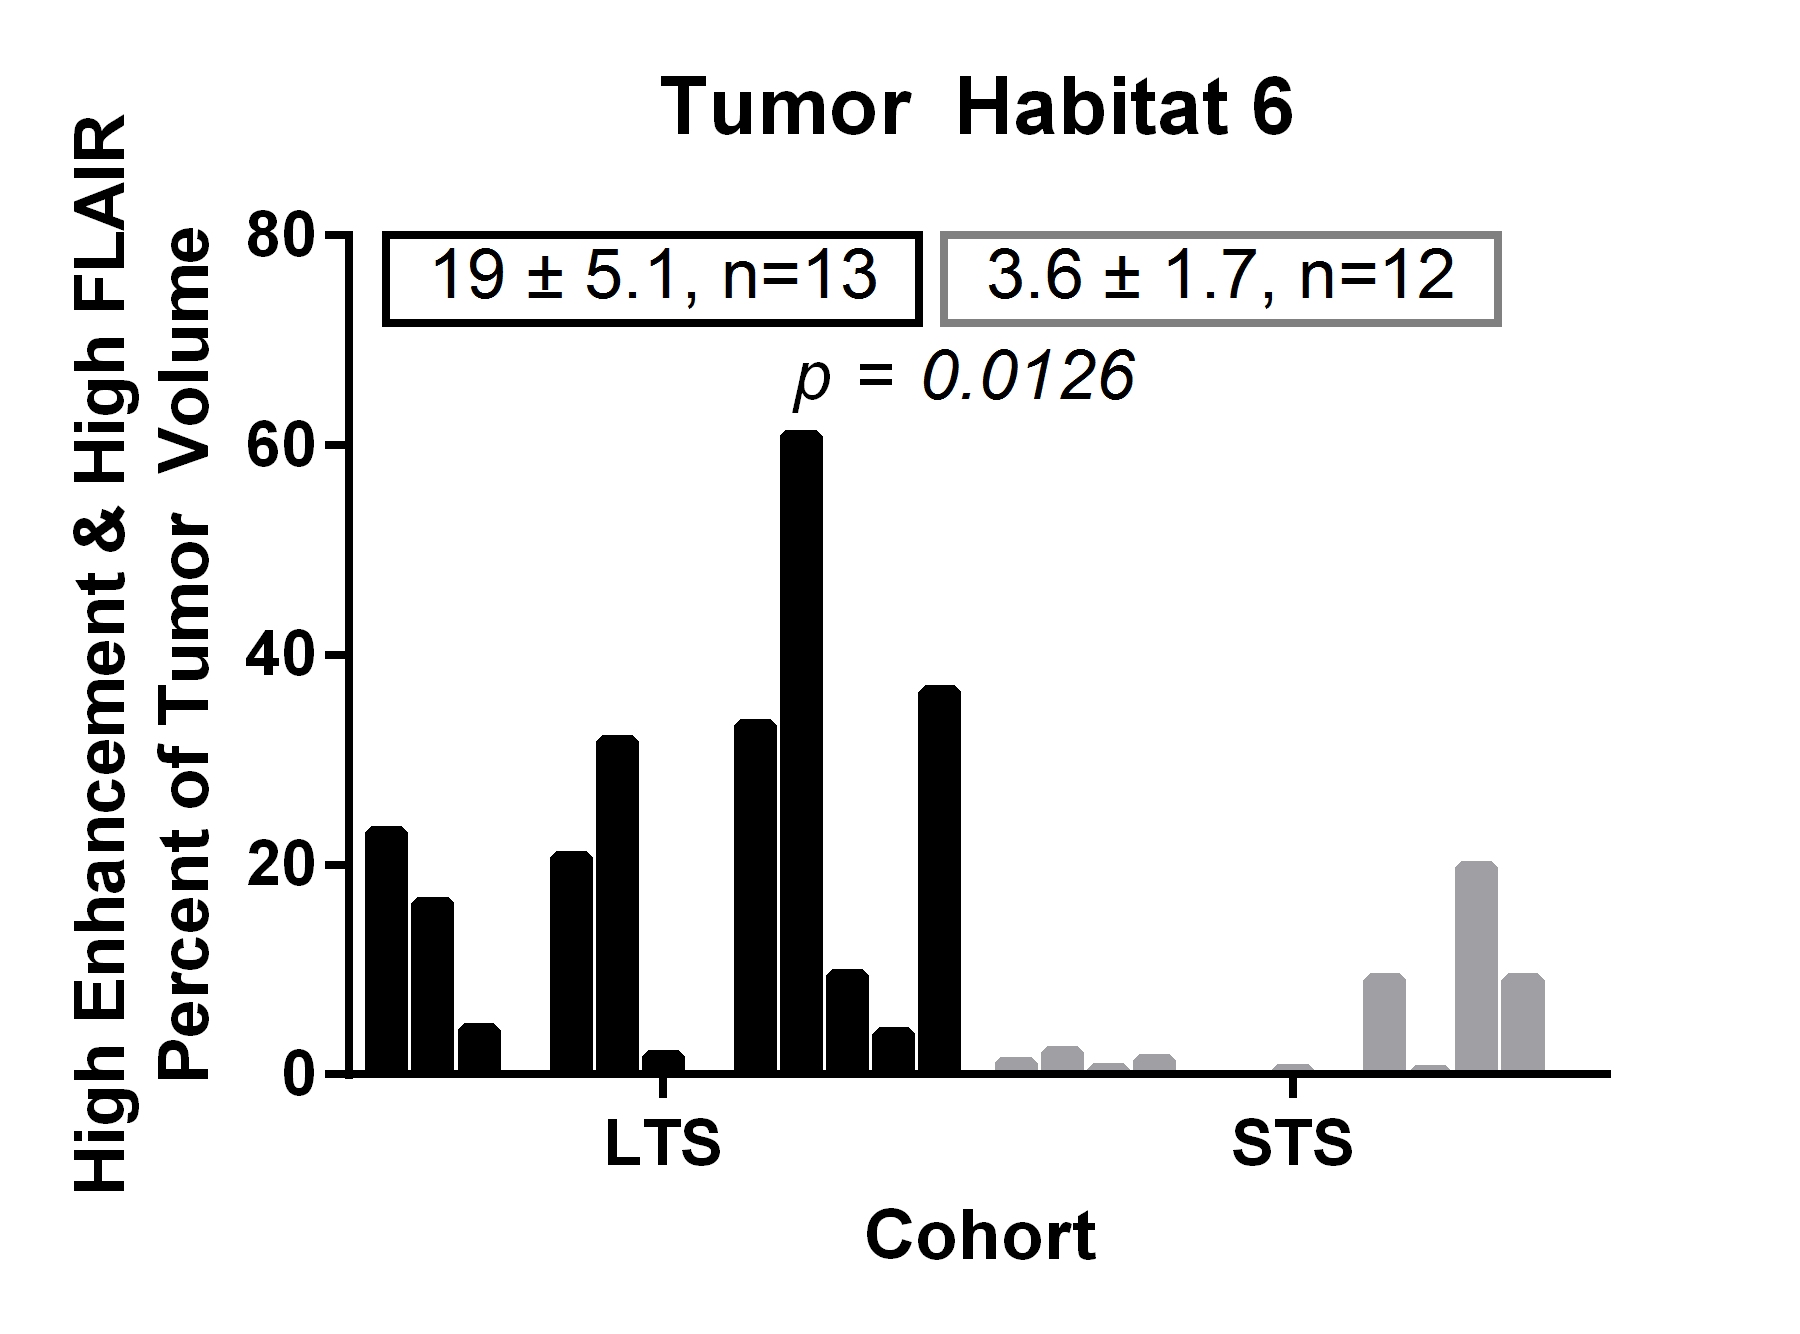
Of the 6 distinct habitats, Habitats 2 and 6 were significantly different between the LTS and STS groups. In Figure 2, a tumor from an LTS patient (left, OS of 55+ months) contains 33% of Habitat 2 (low enhancement and high FLAIR) while 88% of the tumor in STS patient (right, OS of 14 months) is comprised of Habitat 2. In Figure 3, Habitat 6 (high enhancement and high FLAIR) comprises 23% of the tumor volume in an LTS subject (left, OS of 41+ months) but only 9% of the tumor volume in a STS subject (right, OS of 3 months). As summarized in Figure 4, Habitat 2 comprises a significantly lower volume fraction (p = 0.0079) of the tumor at diagnosis in long-term survivors (mean ± S.E.M. = 40 ± 7.6; n = 13) relative to short-term survivors (mean ± S.E.M. = 69 ± 6.5; n = 12). As summarized in Figure 5, Habitat 6 comprises a significantly higher volume fraction (p = 0.0126) of the tumor volume at diagnosis in long-term survivors (mean ± S.E.M. = 19 ± 5.1; n = 13) compared with short-term survivors (mean ± S.E.M. = 3.6 ± 1.7; n = 12).DISCUSSION
Our study demonstrates tumors in LTS subjects have a significantly lower fraction of necrotic tumor (low perfusion, low cell density) than the matched cohort of STS. This is not surprising since such regions are known to contain clonogenic cells but local hypoxia and hypo-perfusion limit the efficacy of chemo- and radiation therapies. The association of Habitat 6 (high contrast enhancement and high FLAIR signal intensity) with LTS is less mechanistically clear. We find that tumor regions with high signal intensity on T1w post-contrast images can be divided into two distinct habitats with either high or low FLAIR signal. Low FLAIR signal would be expected in regions with high contrast enhancement since the latter generally implies good perfusion (although there will also be a component arising from microvascular leakiness) and should be conducive to high cellular density and consequently low FLAIR signal. Interestingly, however, our results demonstrate the high contrast enhancement and high FLAIR signal habitat is strongly associated with patient survival. Pathological studies have demonstrated that increased CD8+ T-Cell infiltrates in newly-diagnosed GBM is associated with long-term survival,3 and we hypothesize that increased FLAIR signal in well-perfused – and presumably cellular – regions may be indicative of interstitial edema related to inflammatory changes caused by an immune response. A definitive biological interpretation will require further investigation.CONCLUSION
Only about 1% of GBM patients survive greater than 3 years post-diagnosis. Investigation of a cohort of these rare long-term survivors identifies two “habitats” on initial multiparametric MRI scans that are significantly different than in a control cohort. If confirmed, this analytic method may allow different tumor therapies to be selectively applied to regions of a GBM based on variations of radiologically-defined eco-evolutionary characteristics.Acknowledgements
No acknowledgement found.References
1) Gatenby RA, Grove O, Gillies RJ. Quantitative Imaging in Cancer Evolution and Ecology. Radiology 2013;269:8-15.
2) Stringfield O, Arrington J, Yu M, Johnstone PA, Forsyth PA, Sahebjam S, Raghunand N. Multiparameter MRI Response Assessment in a Phase I Trial of Hypofractionated Stereotactic Irradiation with Pembrolizumab and Bevacizumab in Patients with Recurrent High Grade Gliomas, Abstract No. 3535, Proc. ISMRM 2016.
3) Yang I, Tihan T, Han SJ, Wrensch MR, Wiencke J, Sughrue ME, Parsa AT. CD8+ T-Cell Infiltrate in Newly Diagnosed Glioblastoma is Associated with Long-Term Survival. J Clin. Neurosci. 2010;17:1381-1385.
Figures