0259
Exploiting radiogenomics data for personalised prediction of glioblastoma1Department of Medical Research, Taipei Medical University Hospital, Taipei, Taiwan, 2Translational Imaging Research Center, College of Medicine, Taipei Medical University, Taipei, Taiwan, 3Department of Radiology, School of Medicine, College of Medicine, Taipei Medical University, Taipei, Taiwan, 4Department of Biomedical Imaging and Radiological Sciences, National Yang-Ming University, Taipei, Taiwan, 5Department of Medical Imaging, Taipei Medical University Hospital, Taipei, Taiwan, 6School of Biomedical Engineering, College of Biomedical Engineering, Taipei Medical University, Taipei, Taiwan
Synopsis
The present study demonstrates the feasibility of machine learning in radiogenomics to predict patient outcome. The Random Forest Survival model is able to predict patient survival based on apparent diffusion coefficients or gene expression data without any prior knowledge.
Purpose
Glioblastoma (GBM) is the most severe form of glioma with patients typically surviving between 12 and 15 months after diagnosis. Tumour grade and recurrence likelihood can be assessed through the MR radiomics analysis and a number of features associated with poor prognosis have been identified from Apparent Diffusion Coefficient (ADC), relative Cerebral Blood Volume, and contrast enhanced T1-weighted and fluid attenuated inversion-recovery1. Despite the ability of MR imaging in characterizing tumours, MR imaging is less connected to the causative genetic mutations that affect patient survival and are unspecific in relation to the underlying molecular features. Therefore, clinicians are increasingly turning to genomics methods for personalised survival prediction. In this work we present a data-driven approach to predict patient survival based on MR imaging and RNA expression patterns. We show that random forests can be used to identify MRI and gene expression features that are predictive of survival and can generate robust predictive models.Methods
ADC maps were used in this study because it has been shown to correlate with patient survival1,2 obtained for 39 GBM cases from The Cancer Imaging Archive and were used to calculate 53 radiomic features3, including histogram, geometry, and texture features. RNA microarray expression data were obtained for these 39 patients as well as 546 additional cases from The Cancer Genome Atlas (TCGA). RNA sequencing expression data in the form of FPKM normalised values were obtained 172 GBM cases. A Random Forest Survival (RFS) model was generated using the R package ‘randomForestSRC’ for the MRI, RNA microarray, and RNA sequencing data. First the most informative MRI features and genes were selected based on their hierarchy in the decision trees. The model was then trained on 80% of the cases and used for survival prediction on the remaining 20% of cases. Model performance was evaluated using the receiver operator characteristics and each model was used to predict patient survival of two new cases from local Taiwan hospitals. Clusters of gene expression patterns were generated using both hierarchical and gene ontology analysis was performed using DAVID (https://david.ncifcrf.gov/).Results and Discussion
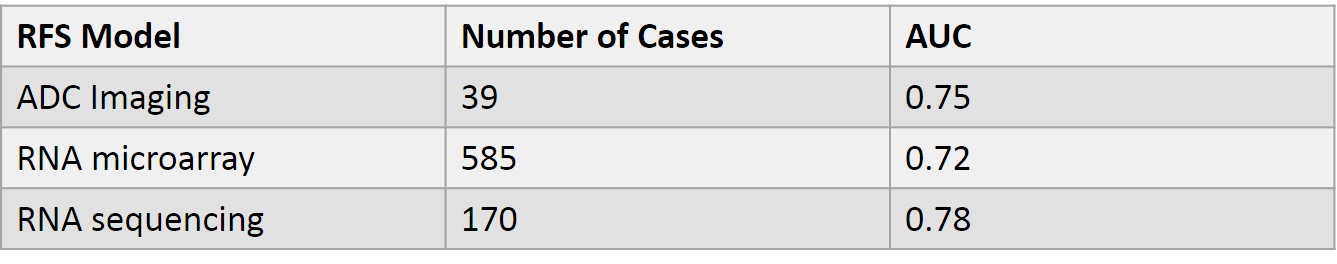
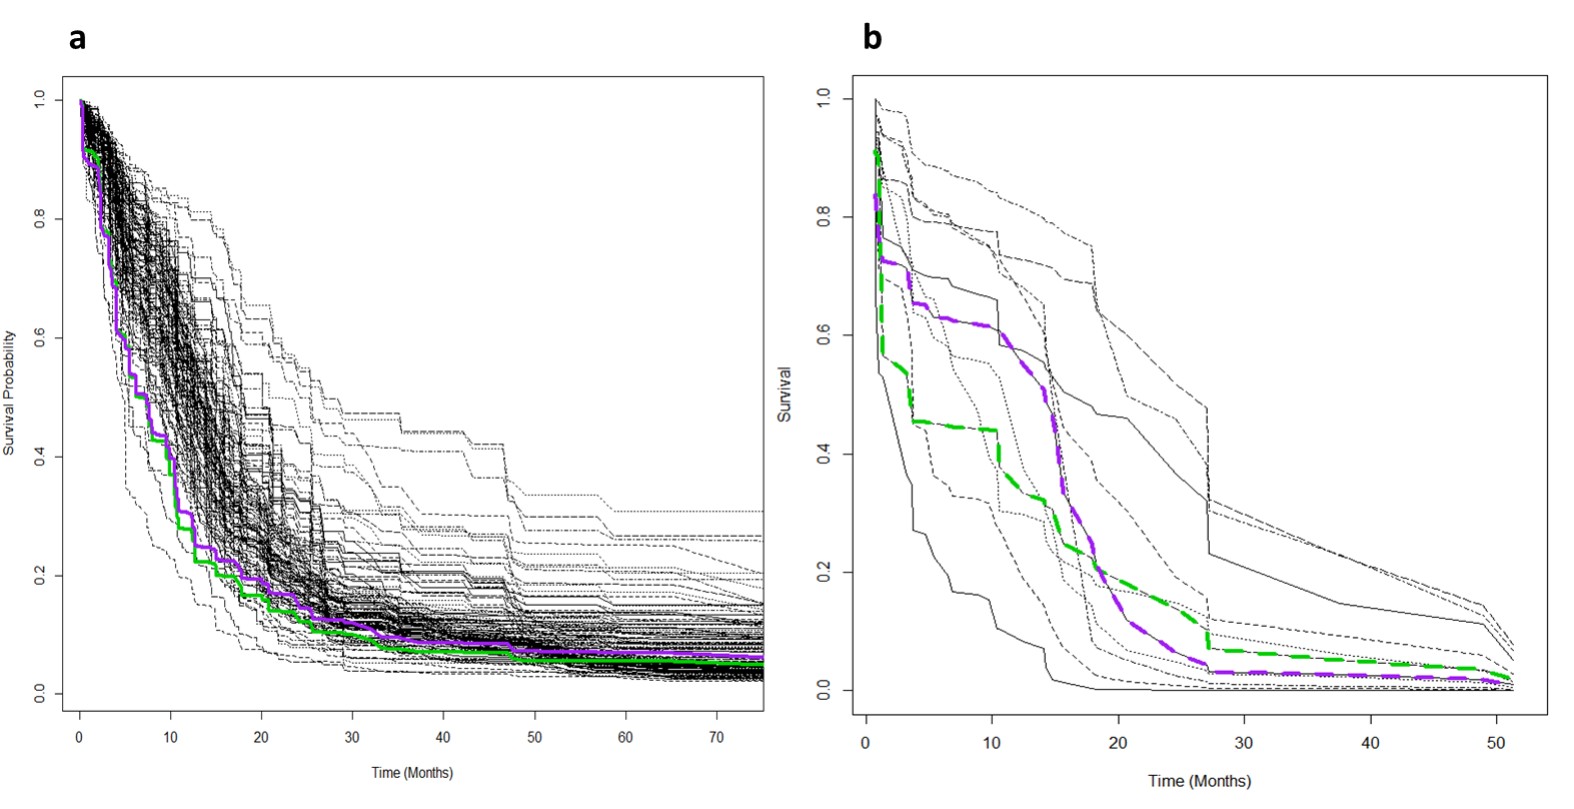
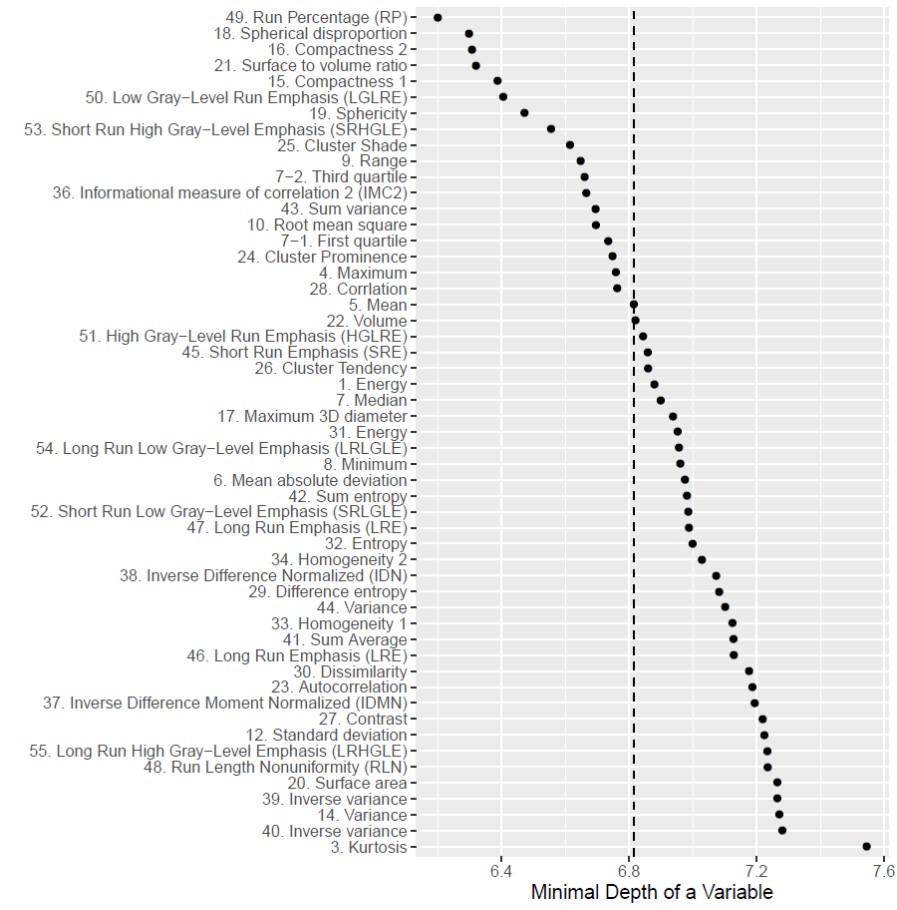
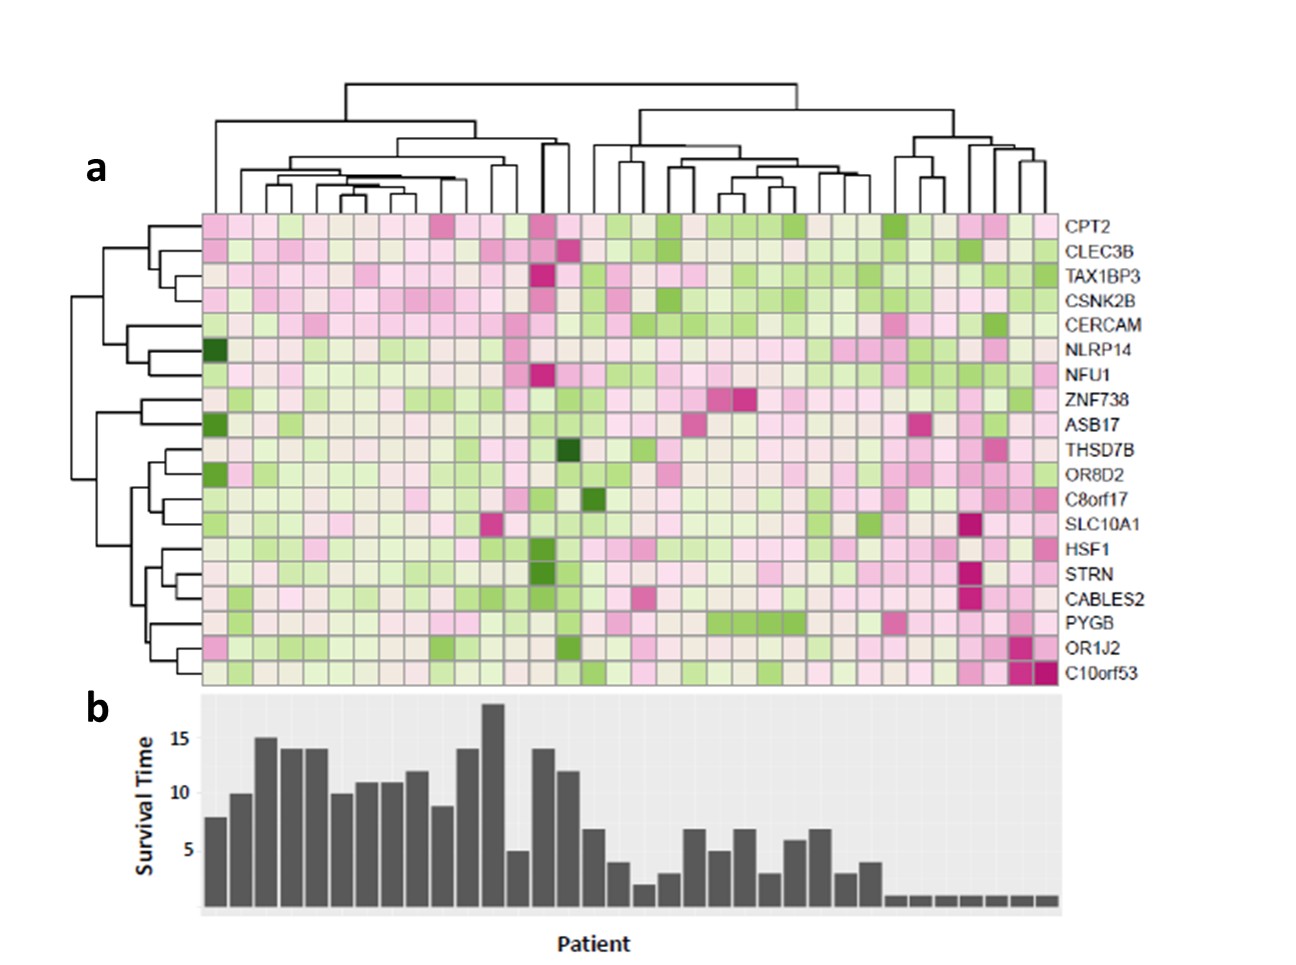
The RFS model showed robust performance at patient survival prediction for the three different data sets, requiring minimal modification for changing between RNA profiling and MRI data. Table 1 compares the performance of the RFS model on the different data sets and shows that the Area Under the Curve (AUC) was highest for the RNA sequencing data set (AUC=0.78) showing that survival prediction based on RNA-sequencing data is the most accurate method. The MRI and microarray based models showed good performance with a score of 0.75 and 0.72 respectively. The performance compares favourably against a recent study that utilised radiomic and genetic features of a restricted set of GBM survival-associated genes4 and demonstrates the advantages of mining genome-wide expression data. To test the wider utility of the model, we generated microarray and ADC data on two patients from local Taiwan hospitals. Figure 1 shows that the two patients were predicted to have a lower than average survival curve relative to the TCGA patients, based on both the ADC imaging and microarray data. The predictions based on ADC data were validated by inspecting the imaging features associated with patient survival. The top 18 ADC features identified as having high predictive power in the RSF model are shown in Fig.2. We next investigated the enrichment of genes in patients with high versus low observed survival times. Figure 3 shows 19 genes identified as being highly predictive of patient survival using the RSF model. The unsupervised hierarchical clustering based on the RNA-seq expression data generated three distinct patient subgroups with high, medium and low observed survival times and shows the utility of the RSF model to select the most predictive survival genes from genome-wide expression data. Interestingly, the set of 19 informative genes are enriched for the GO terms ‘negative regulation of cell proliferation’ and ‘Wnt signalling pathway’ which have previously been implicated in GBM survival in conjunction with EGFR signalling5.Conclusion
The work presented here demonstrates the utility of machine learning in radiogenomics to predict patient outcome. The RSF model is able to predict patient survival from a database of MR imaging or gene expression data without any prior knowledge of the important features related to patient survival. We propose that the computational approach presented here could contribute to our understanding of GBM subtypes and further the goal of effective personalized treatment. In the future we aim to improve survival prediction by integrating the imaging and gene expression data into a combined predictive model.Acknowledgements
This study was funded in part by the Ministry of Science and Technology (MOST 104-2314-B-038-051-MY3) and the Taipei Medical University Hospital (105TMUH-SP-04), Taipei, Taiwan.References
1. Kickingereder P, Burth S, Wick A, Götz M, Eidel O, Schlemmer HP, Maier-Hein KH, Wick W, Bendszus M, Radbruch A, Bonekamp D. Radiomic profiling of glioblastoma: identifying an imaging predictor of patient survival with improved performance over established clinical and radiologic risk models. Radiology. 2016;280(3):880-9.
2. Chen CY, Hsu FT, Liu HS, Tsai PH, Lu CF, Kao YC, Hsieh LC, Liao PY. Low Apparent Diffusion Coefficient Values Correlate with Enhancing Mitosis and Cell Proliferation Expression in glioblastoma using Locus-Specific Radiogenomic Map. The 24th Annual Meeting & Exhibition of ISMRM, Singapore, May 7-13, 2016.
3. Aerts HJ, Velazquez ER, Leijenaar RT, Parmar C, Grossmann P, Carvalho S, Bussink J, Monshouwer R, Haibe-Kains B, Rietveld D, Hoebers F. Decoding tumour phenotype by noninvasive imaging using a quantitative radiomics approach. Nature communications. 2014;5.
4. Kickingereder P, Bonekamp D, Nowosielski M, Kratz A, Sill M, Burth S, Wick A, Eidel O, Schlemmer HP, Radbruch A, Debus J. Radiogenomics of Glioblastoma: Machine Learning–based Classification of Molecular Characteristics by Using Multiparametric and Multiregional MR Imaging Features. Radiology. 2016:161382.
5. Paul I, Bhattacharya S, Chatterjee A, Ghosh MK. Current understanding on EGFR and Wnt/β-catenin signaling in glioma and their possible crosstalk. Genes & cancer. 2013:1947601913503341.
Figures