0258
Classification of Pediatric Brain Tumours using Apparent Diffusion Coefficient – a Multi-Centre Study1Institute of Cancer and Genomic Sciences, University of Birmingham, Birmingham, United Kingdom, 2Oncology, Birmingham Children's Hospital, Birmingham, United Kingdom, 3Institute of Digital Healthcare, University of Warwick, Coventry, United Kingdom, 4Radiology, Birmingham Children's Hospital, Birmingham, United Kingdom, 5Division of Clinical Neuroscience, University of Nottingham, Nottingham, United Kingdom, 6The Children‘s Brain Tumour Research Centre, University of Nottingham, Nottingham, United Kingdom, 7Sir Peter Mansfield Imaging Centre, University of Nottingham, Nottingham, United Kingdom, 8Department of Neuroradiology, Nottingham University Hospital Trusts, Nottingham, United Kingdom, 9Radiology, Alder Hey Children’s NHF Foundation Trust, Liverpool, United Kingdom, 10Developmental Imaging and Biophysics Section, University College London, London, United Kingdom, 11Haematology and Oncology Department, Great Ormond Street Children's Hospital, London, United Kingdom, 12The Newcastle upon Tyne Hospitals NHS Foundation Trust, Newcastle, United Kingdom, 13Sir James Spence Institute of Child Health, Royal Victoria Infirmary, Newcastle upon Tyne, United Kingdom, 14Radiation Protection Services, University Hospitals Birmingham NHS Foundation Trus, Birmingham, United Kingdom, 15Institute of Cancer and Genomic Sciences, University of Birmingham, BIRMINGHAM, United Kingdom
Synopsis
The purpose of the study was to investigate the potential of apparent diffusion coefficient (ADC) to discriminate between paediatric cerebellar tumours on a multicentre basis using histograms. A total of 117 paediatric patients with cerebellar tumours (55 Medulloblastomas, 36 Pilocytic Astrocytomas and 26 Ependymomas) were imaged using diffusion weighted imaging across 12 different hospitals using a total of 18 different scanners. Overall classification accuracies for the ADC histogram metrics were 86 % using Naïve Bayes and 84 % for Random Forest classifier.
Purpose
The purpose of the study was to investigate the potential of apparent diffusion coefficient (ADC) to discriminate between paediatric cerebellar tumours on a multicentre basis using histograms.Methods
Prior to this study all patients were consented for research to the UK Children’s Cancer and Leukemia Group Functional Imaging Group data base in a UK National Health Service Research Ethics Committee-approved study. Five primary treatment centres provided data for the study including Nottingham, Newcastle, Great Ormond Street, London, Alder Hey Liverpool and Birmingham Children’s Hospital. A total of 117 paediatric patients with cerebellar (55 Medulloblastomas, 36 Pilocytic Astrocytomas and 26 Ependymomas) were imaged using diffusion weighted imaging across 12 different hospitals using a total of 18 different scanners using non-standardised protocols with a range of parameter values. This is the current total of patients on the CCLG database with the diagnoses and DWI. Rarer tumour types found in the cerebellum were excluded. ADC maps were produced using in-house software written in the Python program language using b0 and b1000 images. Regions of interest were drawn manually by a research fellow for the whole tumours on the b0 image excluding areas of large cyst using MRIcro. Data was extracted and placed into 180 bins for histogram analysis. Statistics were evaluated using a combination of the R statistical package (The R Foundation) and SPSS (version 22, IBM). Classification of the tumours was performed using Orange software package(1) with histogram metrics inputted including the Mean, Median, Variance, Skew, Kurtosis and the 10th, 25th, 50th and 75th quantiles. Initial feature selection was undertaken via principal component analysis to account for 95% of the variance. Two different classification methods were employed: 1. Naïve Bayes (NB) and 2. Random Forest (RF). 10-fold cross validation was used to examine the predictive value of the classifiers.Results
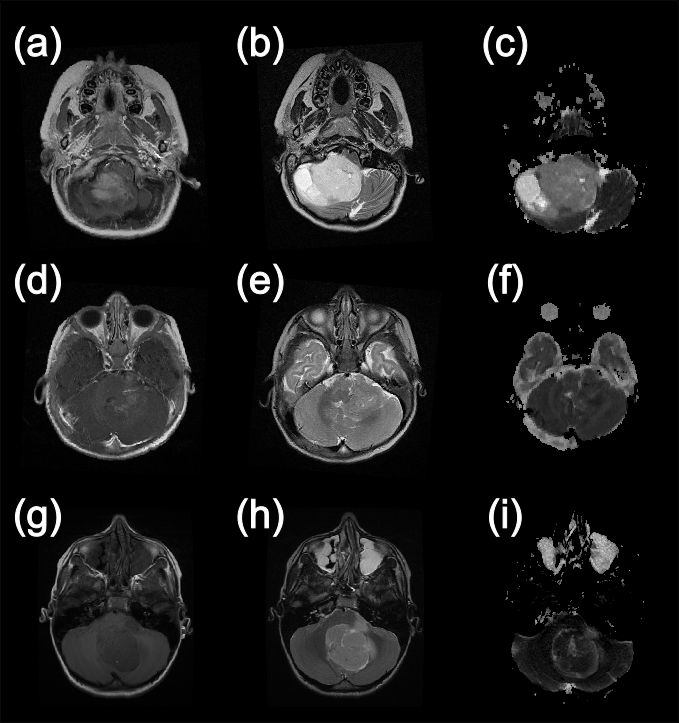
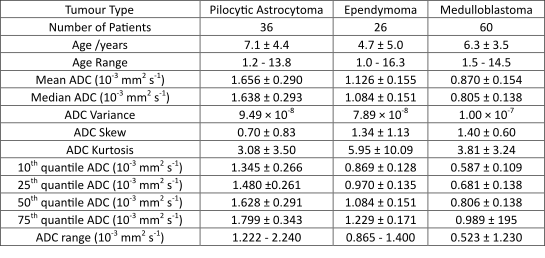
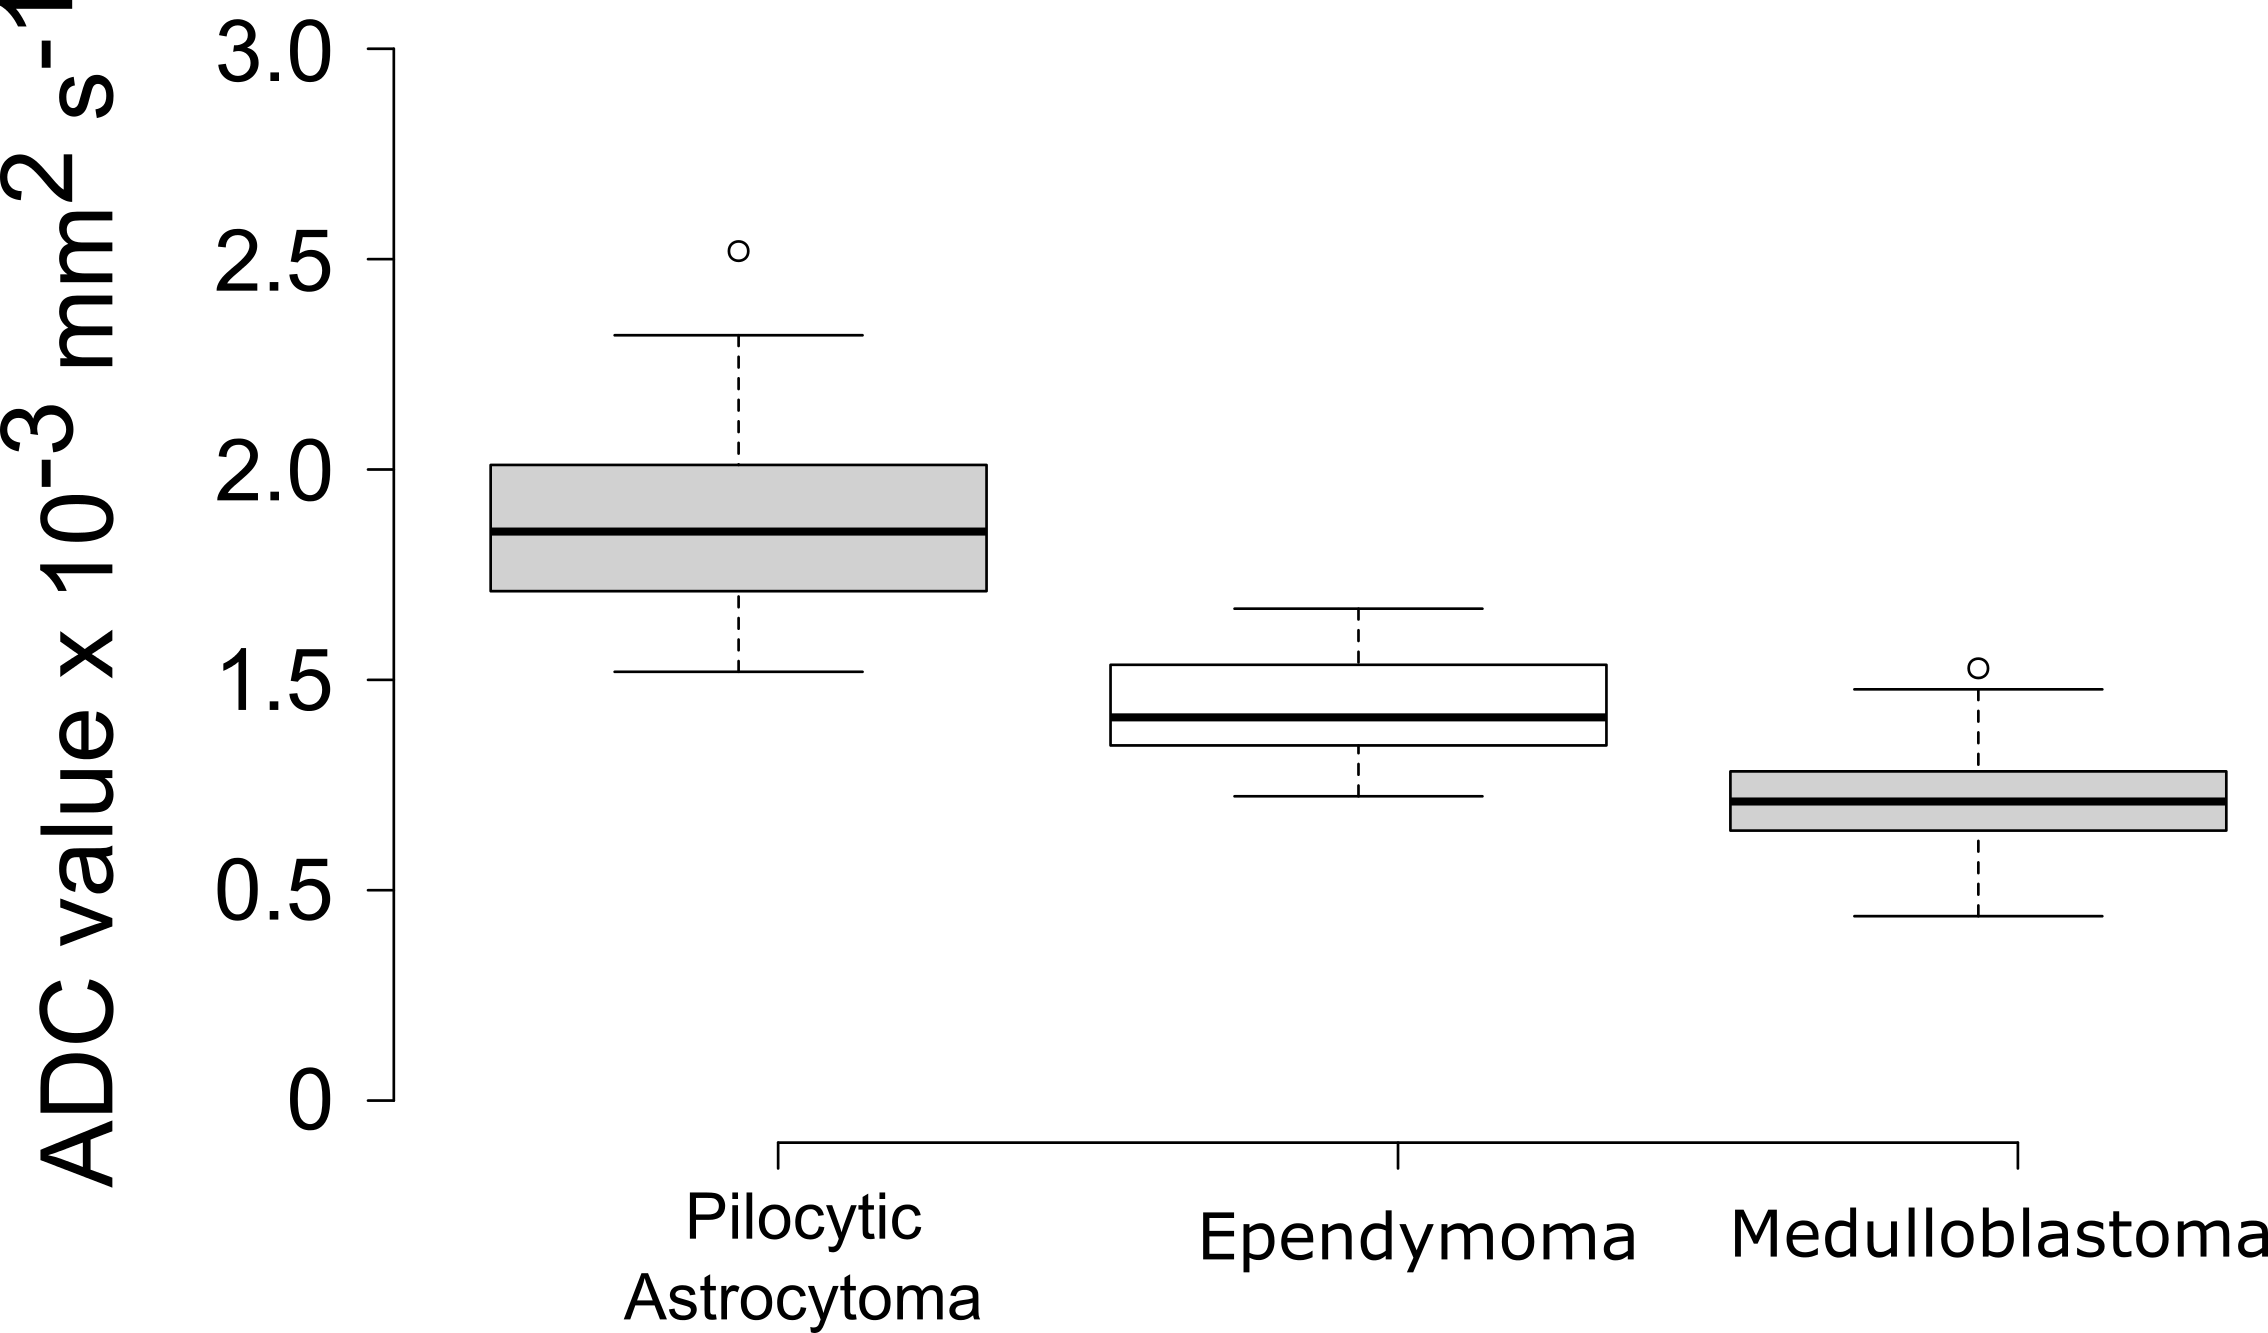
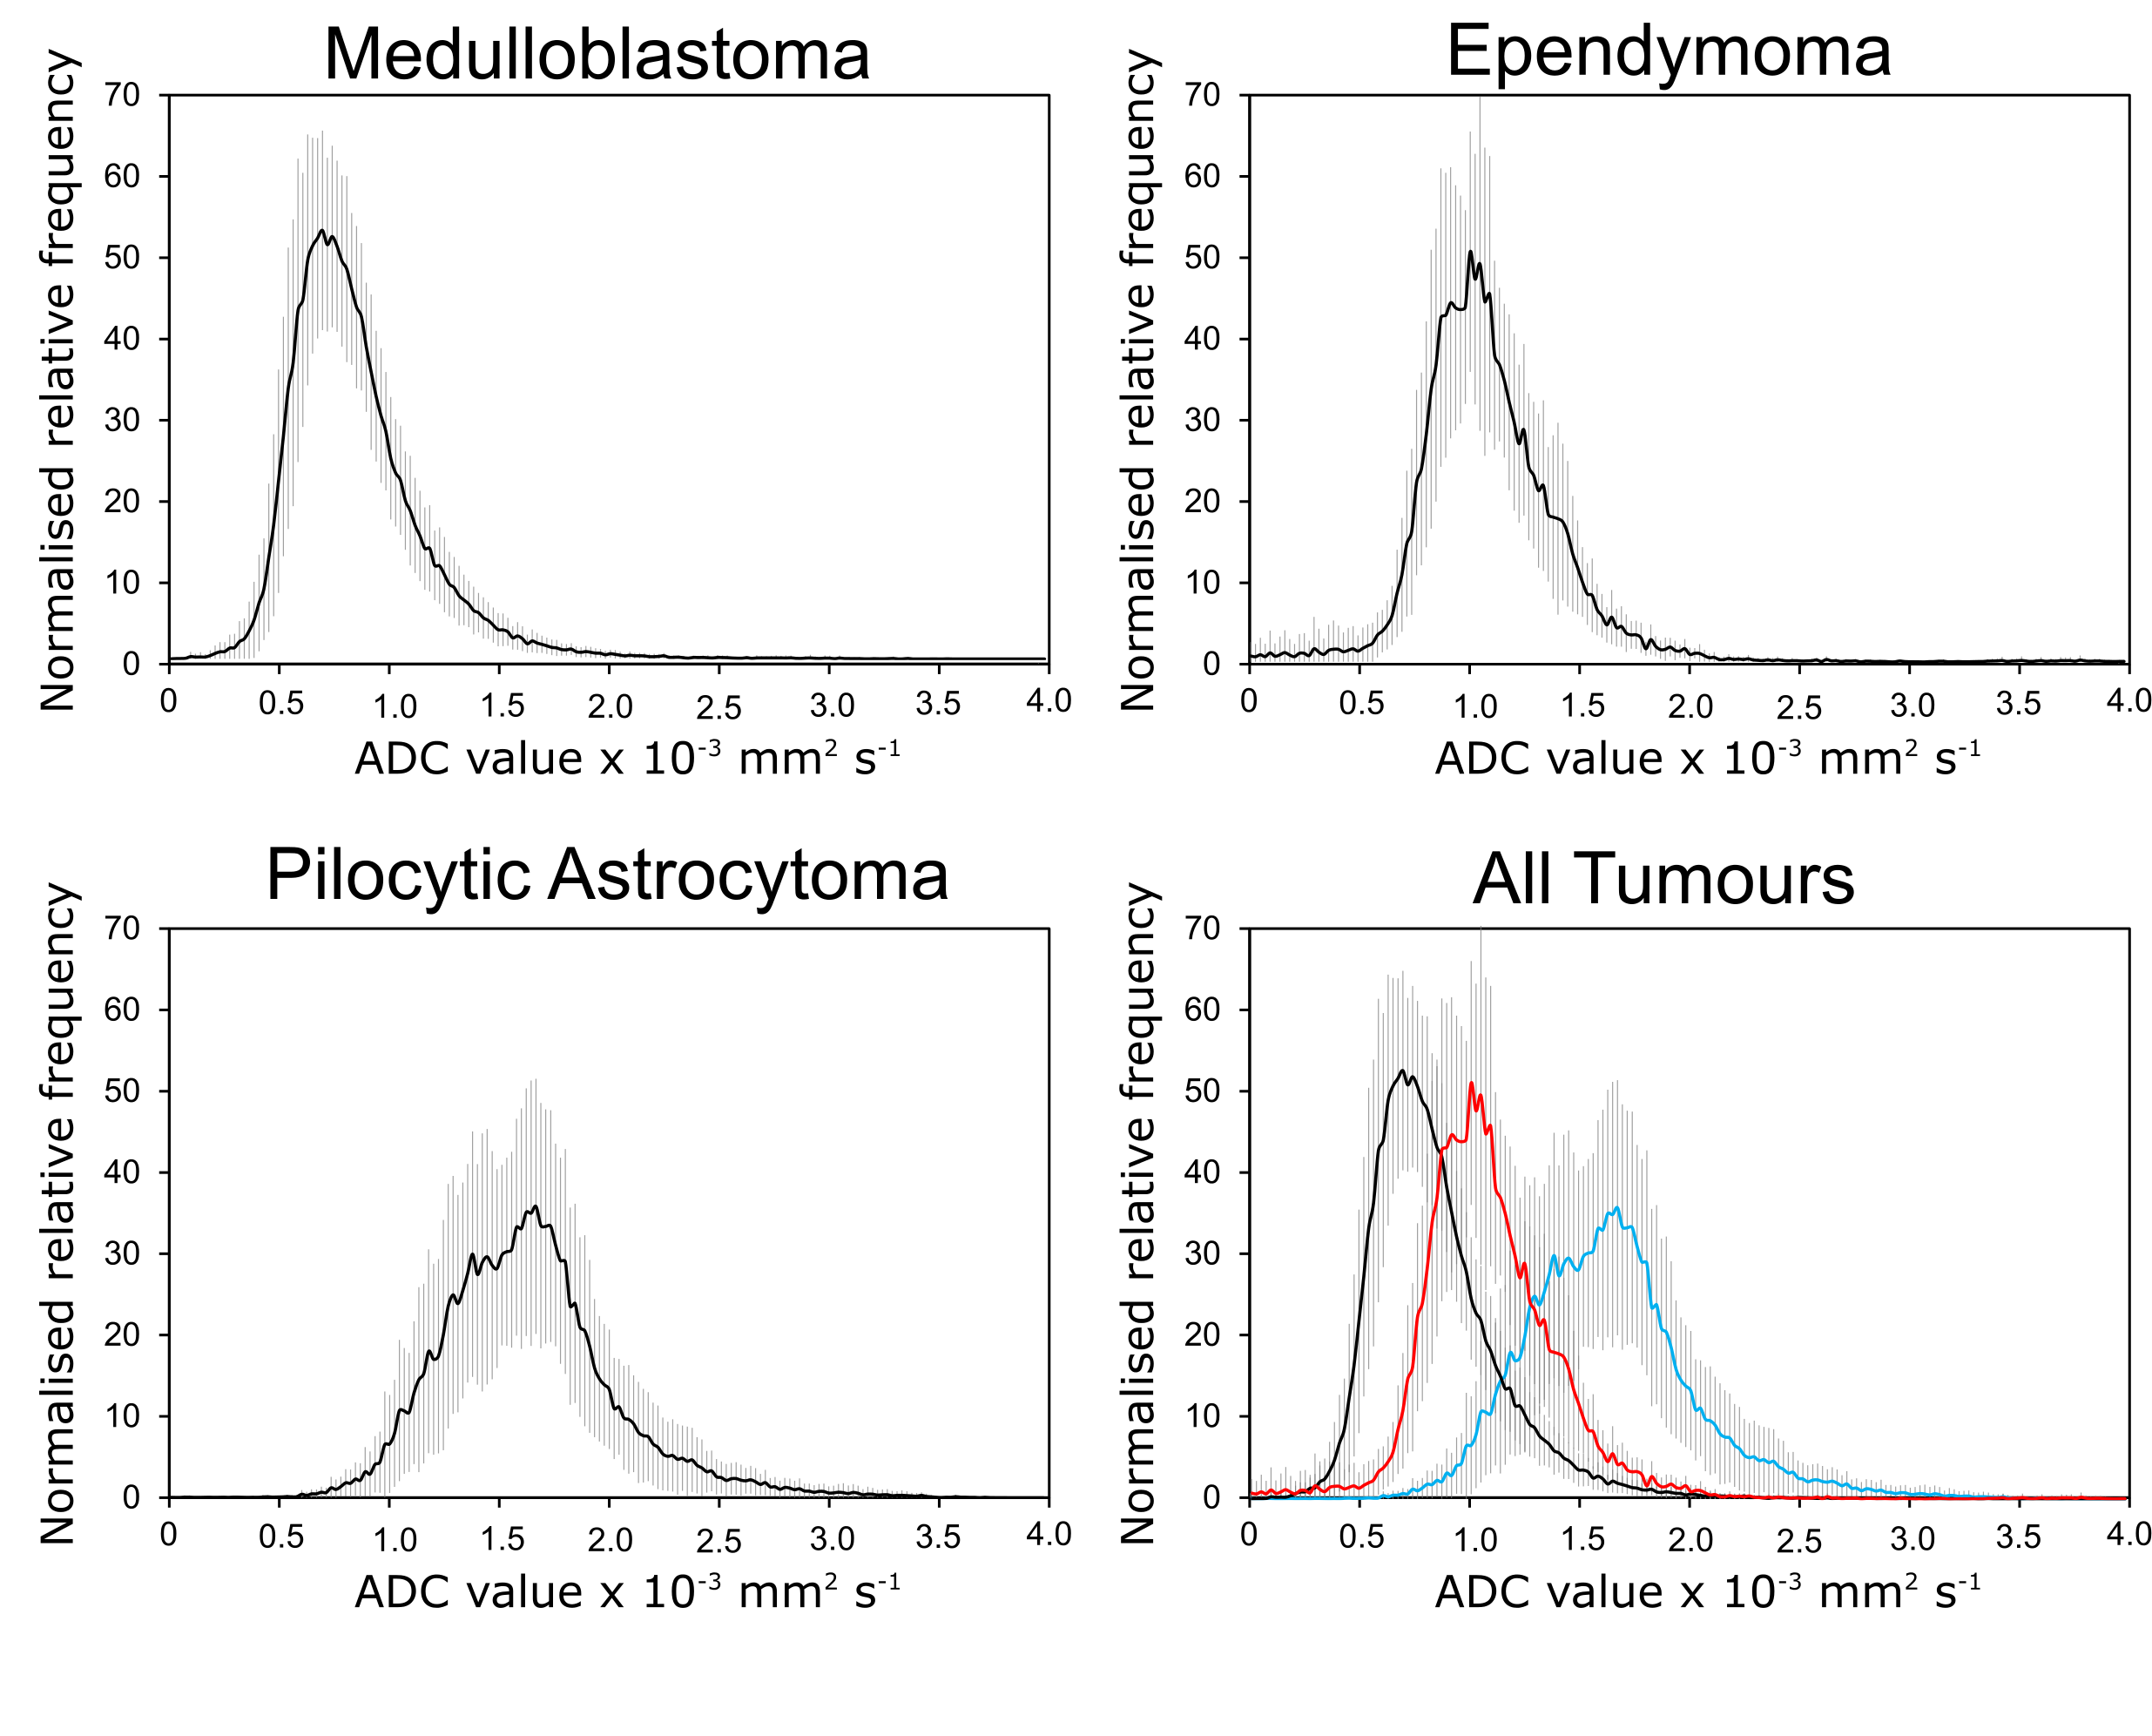
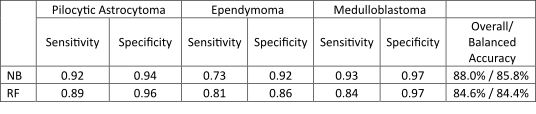
Figure 1 shows example images from the three different tumour types included in this study. The metrics extracted from the tumour ROI histograms are shown in Table 1. An Anova of the group mean, median and the quantiles showed significant differences between all three tumour groups (p < 0.001). As an example the distribution of the mean values is illustrated in the box plot in Figure 2. Average histograms for the three tumour types are shown in Figure 3. The classification results using the histogram metrics are shown in Table 2. The overall (NB: 85% and RF: 84%) and balanced (NB: 89% and RF: 86%) classification accuracies for the two methods were similar. The only notable difference was the lower sensitivity for Ependymomas using NB.Dicussion
This aim of this study was to determine if ADC values can be used to discriminate between the most common types of paediatric cerebellar tumours on a multicentre basis. We found that there was a highly statistically significant difference between the Mean, Median and the 10th, 25th, 50th and 75th quantiles when observing Pilocytic Astrocytomas, Medulloblastomas and Ependymomas (p < 0.001). These differences are in line with previous studies that have shown significant differences between Medulloblastomas and Ependymomas(2,3) which are usually the two tumour types which overlap in terms of ADC metrics. The average histograms presented in Figure 2 show that there are differences between the three main tumour types if assessed as groups and they have distinct appearances. The standard deviation represented by the error bars, suggests there is the potential for significant overlap on a case-by-case basis. Interestingly, the Medulloblastomas appear to be the most homogeneous tumours with respect to their histograms. The Pilocytic Astrocytomas show an almost bimodal distribution with respect to the shape of the average histogram. We have shown that a cohort of patients scanned on a number of different scanners, in different hospitals and using heterogeneous protocols can still discriminate between tumour types. Our results suggest that rigorous harmonisation of DWI protocols may not be necessary for the production of reliable biomarkers. This has already been demonstrated in healthy volunteers(4). The classification rates are not as high as has previously been seen in the literature for ADC histogram analysis with Rodriguez Gutierrez et al.(2) quoting overall classification rates of 91.4% and Bull et al.(5) 93.75%. However our study is much larger than the aforementioned studies with a more heterogeneous data input with regards to hospitals, scanners and acquisition protocols which may account for the slightly lower rates.Conclusions
We have shown in this study that we are able to discriminate between the most common types of paediatric cerebellar brain tumour types using histogram analysis of Apparent Diffusion Coefficient maps.Acknowledgements
This work was funded the National Institute for Health Research (NIHR) by means of a Research Professorship,the Paediatric Experimental Cancer Medicine Centre, and Free Radio in conjunction with Help Harry Help Others (HHHO).References
1. Demsar J, Curk T, Erjavec A, Gorup C, Hocevar T, Milutinovic M, Mozina M, Polajnar M, Toplak M, Staric A, Stajdohar M, Umek L, Zagar L, Zbontar J, Zitnik M, Zupan B. Orange: Data Mining Toolbox in Python. J Mach Learn Res 2013;14:2349-2353.
2. Rodriguez Gutierrez D, Awwad A, Meijer L, Manita M, Jaspan T, Dineen RA, Grundy RG, Auer DP. Metrics and textural features of MRI diffusion to improve classification of pediatric posterior fossa tumors. AJNR American journal of neuroradiology 2014;35(5):1009-1015.
3. Schneider JF, Confort-Gouny S, Viola A, Le Fur Y, Viout P, Bennathan M, Chapon F, Figarella-Branger D, Cozzone P, Girard N. Multiparametric differentiation of posterior fossa tumors in children using diffusion-weighted imaging and short echo-time H-1-MR spectroscopy. J Magn Reson Imaging 2007;26(6):1390-1398.
4. Grech-Sollars M, Hales PW, Miyazaki K, Raschke F, Rodriguez D, Wilson M, Gill SK, Banks T, Saunders DE, Clayden JD, Gwilliam MN, Barrick TR, Morgan PS, Davies NP, Rossiter J, Auer DP, Grundy R, Leach MO, Howe FA, Peet AC, Clark CA. Multi-centre reproducibility of diffusion MRI parameters for clinical sequences in the brain. NMR in biomedicine 2015;28(4):468-485.
5. Bull JG, Saunders DE, Clark CA. Discrimination of paediatric brain tumours using apparent diffusion coefficient histograms. European radiology 2012;22(2):447-457.
Figures