0257
Radiogenomics of 201 WHO grade 2 and 3 gliomas1Neurosurgery, Osaka Medical Center for Cancer and Cardiovascular Diseases, Osaka, Japan, 2Kansai Molecular Diagnosis Network for CNS Tumors, Osaka, Japan, 3National Cancer Center Hospital, Japan, 4Osaka National Hospital, Osaka, Japan
Synopsis
Genetic alterations found in WHO grade 2 and 3 gliomas include IDH1/2 and TERT promoter mutations and 1p19q co-deletion. In this research, the authors attempted to test the hypothesis that genetic alterations could contribute to the locations and texture of the tumor by analyzing 201 WHO grade 2 and 3 gliomas using radinogenomic analysis. The authors were able to confirm the hypothesis that genetic alterations do contribute to the locations and textures of the tumor. 15 radionomic features were identified and those features were able to identify 3 genetic subgroups of WHO grade 2 and 3 gliomas.
PURPOSE
Genetic alterations found in WHO grade 2 and 3 gliomas include IDH1/2 and TERT promoter mutations and 1p19q co-deletion, which alterations are known to have great impact on the prognosis of the patient. The revised WHO classification for glioma now requires genetic information for accurate pathological diagnosis of the tumor. In this research, the authors attempted to test the hypothesis that genetic alterations could contribute to the locations and heterogeneity of the tumor by analyzing 201 WHO grade 2 and 3 gliomas using voxel-based lesion mapping (VLM) and image texture analysis. The obtained analysis was then reversely challenged to predict genetic alterations of the tumor by standard MR images.METHODS
Patients and data collection: 201 WHO grade 2 and 3 gliomas were retrospectively collected and the genomic DNA of the tumor was sequenced for IDH1/2 and TERT promoter mutations. Treatment naive MR images were also collected. T2 weighted, T1 weighted, FLAIR and Gd-enhanced T1 weighted images were collected for analysis.
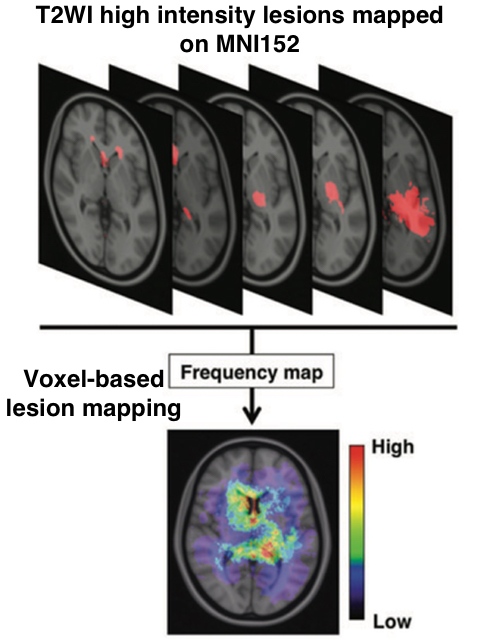
Voxel-based lesion mapping (VLM): T2 weighted images were collected to construct voxel-based lesion maps. T2WI hyperintense lesions were semi-automatically segmented, which process provides the voxels-of-interest (VOI) of the T2WII hyperintense lesions. In the meantime, NIfTI converted T2WI were registered to a 1.0-mm isotropic, high-resolution, T1-weighted brain atlas provided by the Montreal Neurological Institute (MNI152) using a mutual information algorithm with a 12-degree of freedom transformation with FSL-FLIRT (FMRIB: http://fsl.fmrib.ox.ac.uk/fsl/fslwiki/FSL). VOIs created beforehand were resliced using the affine transformation matrix calculated for registering T2WI to MNI152. All lesions segmented in the group of interest were summed and averaged by the number of patients. A heat-map for the frequency of lesion occurrence was reconstructed and superimposed on the reference MNI152 using in-house developed software using Matlab (Figure 1).
Texture analysis: Maximum, minimum, mean, median, standard deviation, and entropy of T1WI, T2WI, FLAIR, Gd-enhanced T1WI were calculated. Z-score analysis was also performed for Gd-enhanced T1WI and above mentioned values were calculated. The Z-score analysis for Gd-enhanced T1WI is an analysis that enables semi quantifiable measurement of the magnitude of contrast enhancement of the whole brain similar to a subtraction analysis. Furthermore, the brain was segmented in 10 locations according to the MNI152 segmentation atlas provided by FSL. Tumor location was analyzed according to this segmentation.
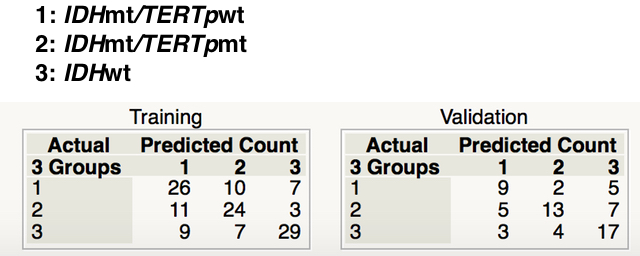
Statistical analysis: A multi-regression model was applied and texture / location values were challenged to construct a model that predicts genetic alterations within the tumor. 126 patients were allocated as training set and 65 for validation set. 10 patients were not included as there were some missing data. Patient cohort was divided into the following 3 groups; IDH mt/TERTp wt, IDH mt/TERTp mt and IDH wt. It has been suggested that IDH mt/TERTp wt gliomas are close to astrocytic, while IDH mt/TERTp mt gliomas are close to oligodendroglial tumors. A multi-regression model was constructed using the training set to predict the 3 genetic subgroups and the validation set was used for model validation.
RESULTS
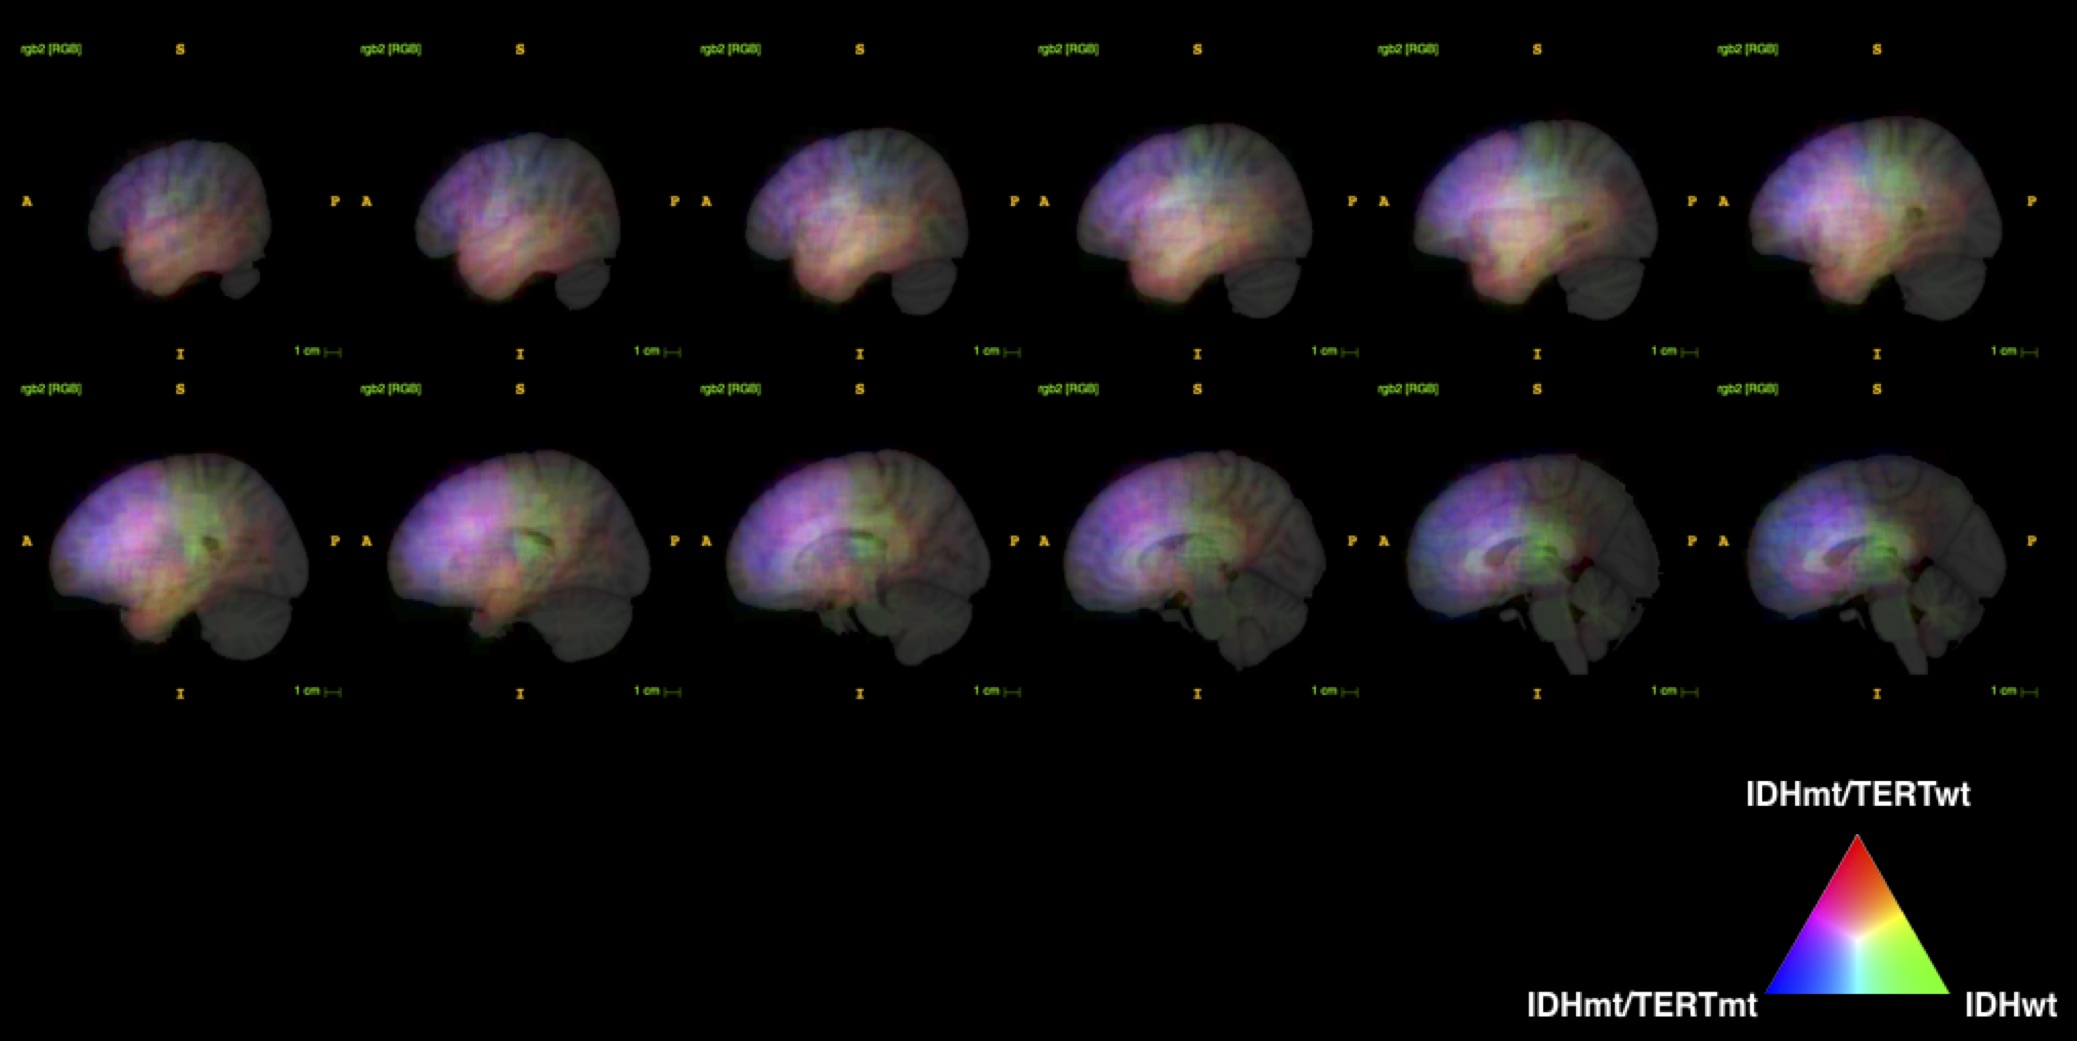
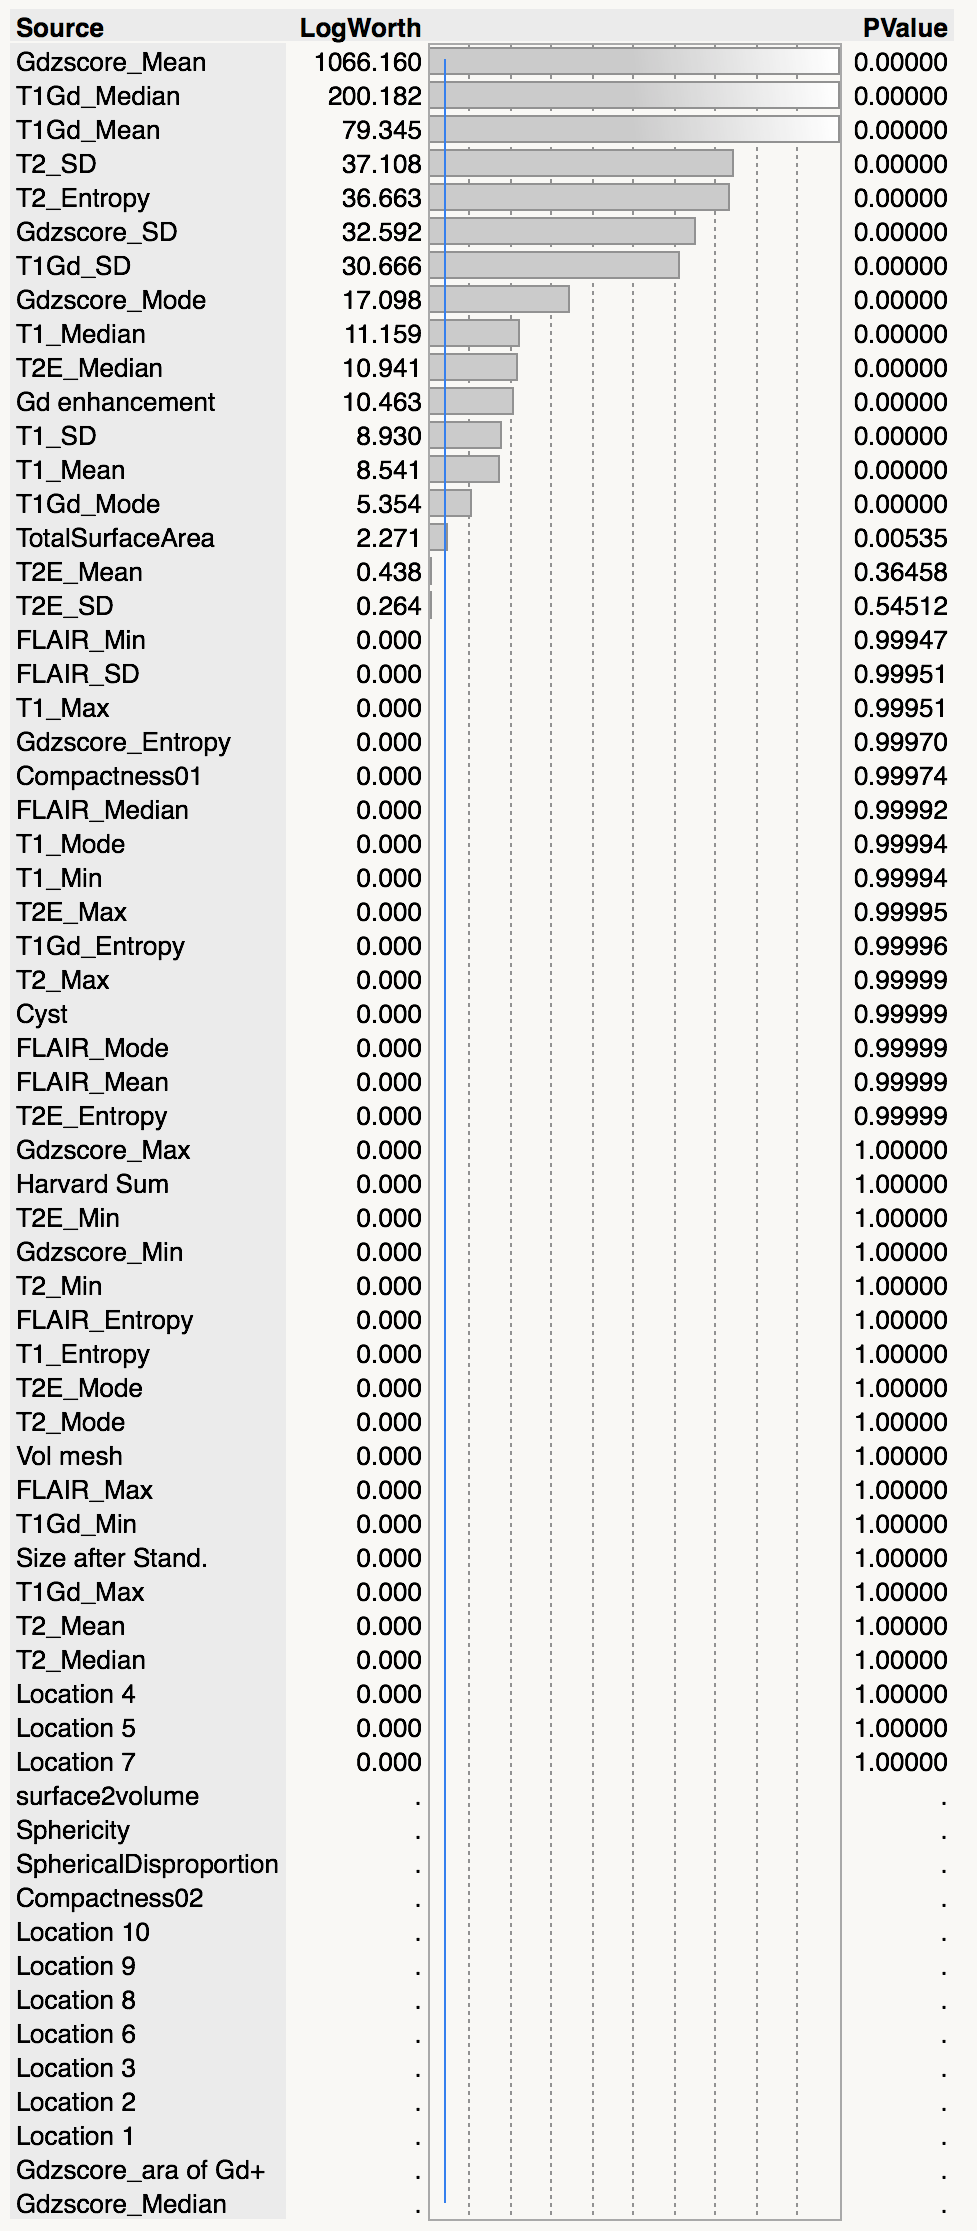
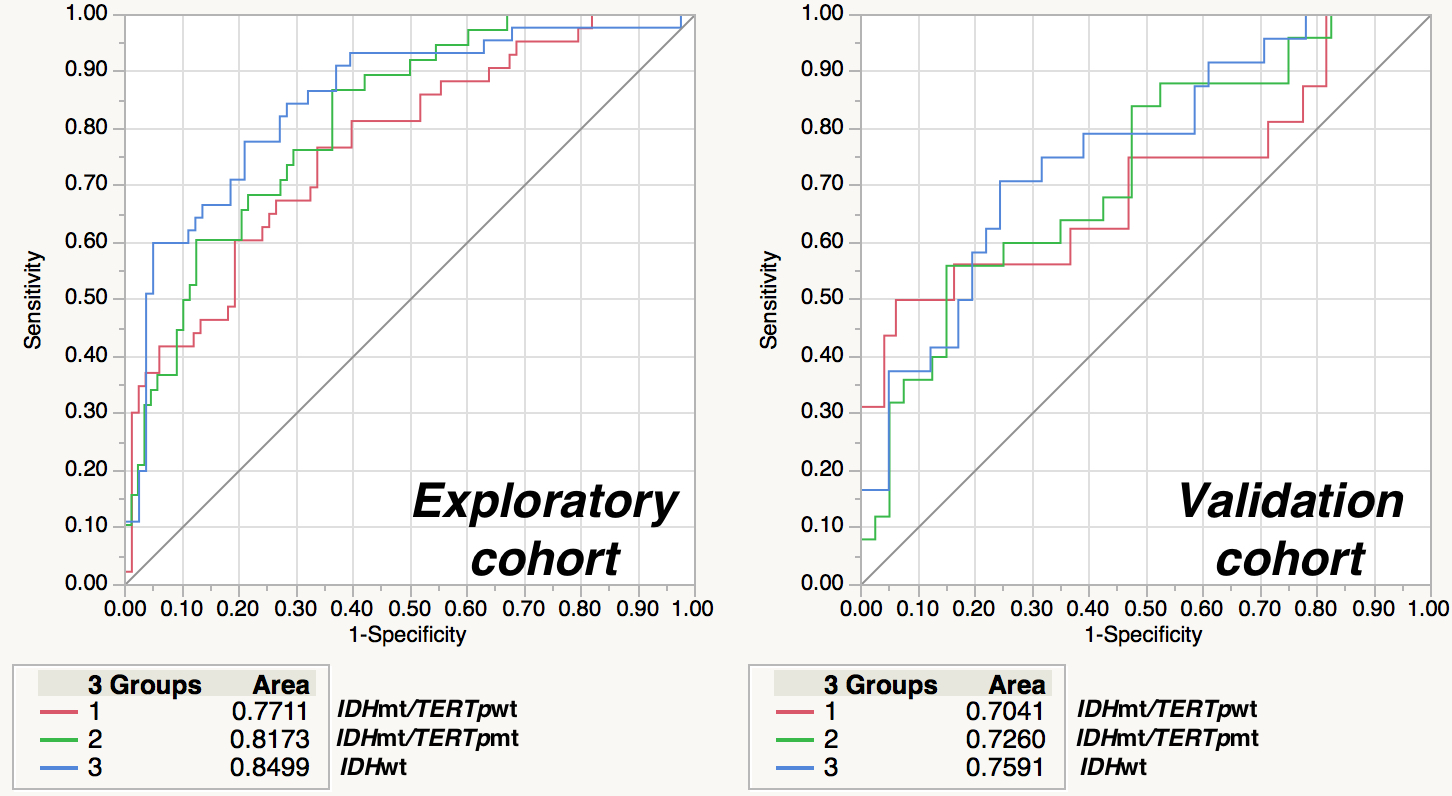
VLM revealed that IDH mt/TERTp wt gliomas dominated temporal lobe involvement while IDH mt/TERTp mt occupied the frontal lobe. IDH wt tumors, on the other hand, located at much posterior lobes and centered at the deep white matter (Figure 2). 15 texture elements were identified for model construction to predict 3 genetic subgroups of WHO grade 2 and 3 gliomas (Figure 3). When these 15 texture elements were used to construct a prediction model of the 3 genetic subgroups, AUCs calculated from the training set ranged from 0.7 to 0.75 (Figure 4). Accuracy for prediction was 63% for the training set and 60% for the validation set, while the expletive value would be 33% (Figure 5).DISCUSSION
In this research, the authors were able to confirm the hypothesis that genetic alterations do contribute to the locations and heterogeneity of the tumor by analyzing 201 WHO grade 2 and 3 gliomas using voxel-based lesion mapping (VLM) and image texture analysis. Texture analysis revealed that several image textures do correspond to genetic alterations inherent in glioma. 15 radionomic features were identified and those features were able to identify 3 genetic subgroups of WHO grade 2 and 3 gliomas. These results suggest that radinogenomic approach is a valid method to establish MR based genetic diagnosis of WHO grade 2 and 3 gliomas.Acknowledgements
This research was supported by JSPS, Kakenhi.References
1. Kinoshita M et al: Introduction of high throughput magnetic resonance T2-weighted image texture analysis for WHO grade 2 and 3 gliomas. PLoS One. in press
2. Arita H et al: Upregulating mutations in the TERT promoter commonly occur in adult malignant gliomas and are strongly associated with total 1p19q loss. Acta Neuropathol. 2013 126(2):267-76.
Figures