0255
PARTIAL VOLUME ESTIMATION IN MULTIPLE SCLEROSIS LESION SEGMENTATION1Advanced Clinical Imaging Technology, Siemens Healthcare AG, Lausanne, Switzerland, 2Department of Radiology, Centre Hospitalier Universitaire Vaudois (CHUV) and University of Lausanne (UNIL), Lausanne, Switzerland, 3Signal Processing Laboratory (LTS 5), Ecole Polytechnique Fédérale de Lausanne (EPFL), Lausanne, Switzerland, 4Department of Radiology, Valais Hospital, Sion, Switzerland, 5Siemens Medical Solutions USA, Boston, MA, United States, 6Martinos Center for Biomedical Imaging, Massachusetts General Hospital and Harvard Medical School, Boston, MA, United States, 7Department of Clinical Neurosciences, Centre Hospitalier Universitaire Vaudois (CHUV) and University of Lausanne (UNIL), Lausanne, Switzerland, 8Medical Image Analysis Laboratory (MIAL), Centre d'Imagerie BioMédicale (CIBM), Lausanne, Switzerland
Synopsis
Partial volume (PV) is the effect of having a mixture of tissues present within a voxel. This effect occurs in tissue borders and affects small structures such as small multiple sclerosis (MS) lesions. Ignoring PV effects in volumetry may lead to significant estimation errors. Here, we propose a novel automated MS lesion segmentation technique that takes PV effects into account. The proposed method shows higher accuracy in terms of lesion volume estimation compared to a manually segmented ground truth as well as significant improvement in detection of small lesions, also in comparison to two software packages for MS lesion segmentation.
Introduction
Accurate lesion count and volume estimation is important for diagnosis and follow-up of multiple sclerosis (MS) patients. It has been shown that ignoring partial volume (PV) effects can lead to volume measurement errors in the range of 20-60%1. In this work, we develop and validate an automated prototype lesion segmentation algorithm that explicitly models the PV. Our goal is to improve the detection of small lesions which are typically strongly affected by PV. In addition, we aim to better estimate lesion volumes through improved delineation of lesion borders which are naturally prone to PV effects.Material and Methods
Thirty-nine patients (14 males, 25 females, median age 34 years, age range: 20-60 years) with early relapsing-remitting MS (disease duration < 5 years from diagnosis) and Expanded Disability Status Scale (EDSS) between 1 and 2 (median=1.5) underwent a 3T MRI scan (MAGNETOM Trio a Tim system, Siemens Healthcare) using a commercial 32-channel head coil. The MRI protocol included: high-resolution magnetisation-prepared rapid gradient echo (MPRAGE, TR/TI = 2300/900 ms, voxel size = 1.0 x 1.0 x 1.2 mm3) and 3D fluid-attenuated inversion recovery (3D FLAIR, TR/TE/TI=5000/394/1800 ms, voxel size = 1.0 x 1.0 x 1.2 mm3). All imaging volumes were skull-stripped using an in-house method2 and corrected for intensity inhomogeneities using the N4 algorithm3. The proposed lesion detection method is based on a Bayesian PV estimation algorithm, using the "mixel" model4,5, extended to lesion detection by including spatial constraints based on atlas-based probability maps of grey and white matter. Such constraints are important to distinguish grey matter and lesional tissue, which have similar intensity signatures in both MPRAGE and 3D FLAIR. Concentration maps for white and grey matter, cerebrospinal fluid and MS lesions were thus obtained. They were subsequently used to compute lesion volumes and to evaluate the lesion detection performance of the algorithm. As ground truth (GT), we used manual segmentations in which a neurologist and a radiologist identified lesions by consensus. We also compared the results from the proposed technique with two state-of-the-art methods: the Lesion Segmentation Tool (LST)6 and LesionTOADS (LTOADS)7. Correlations of total lesion volume (TLV) between the GT and the three methods were evaluated, and Pearson's correlation coefficients (ρ) were computed. Detection rates (DR, #detected/#GT lesions) were obtained for different lesion size ranges: 3-10 μL (small); 11-20 μL (small-medium); 21-50 μL (medium); 51-100 μL (large); > 101 μL (very large). To perform the DR evaluation, an optimal threshold of 0.4 derived from a receiver operating characteristic analysis was applied to the lesion concentration maps, transforming them into binary masks. The false positive rate (1 - #false positive lesions) was used as a metric to compare the DR of the different methods.Results
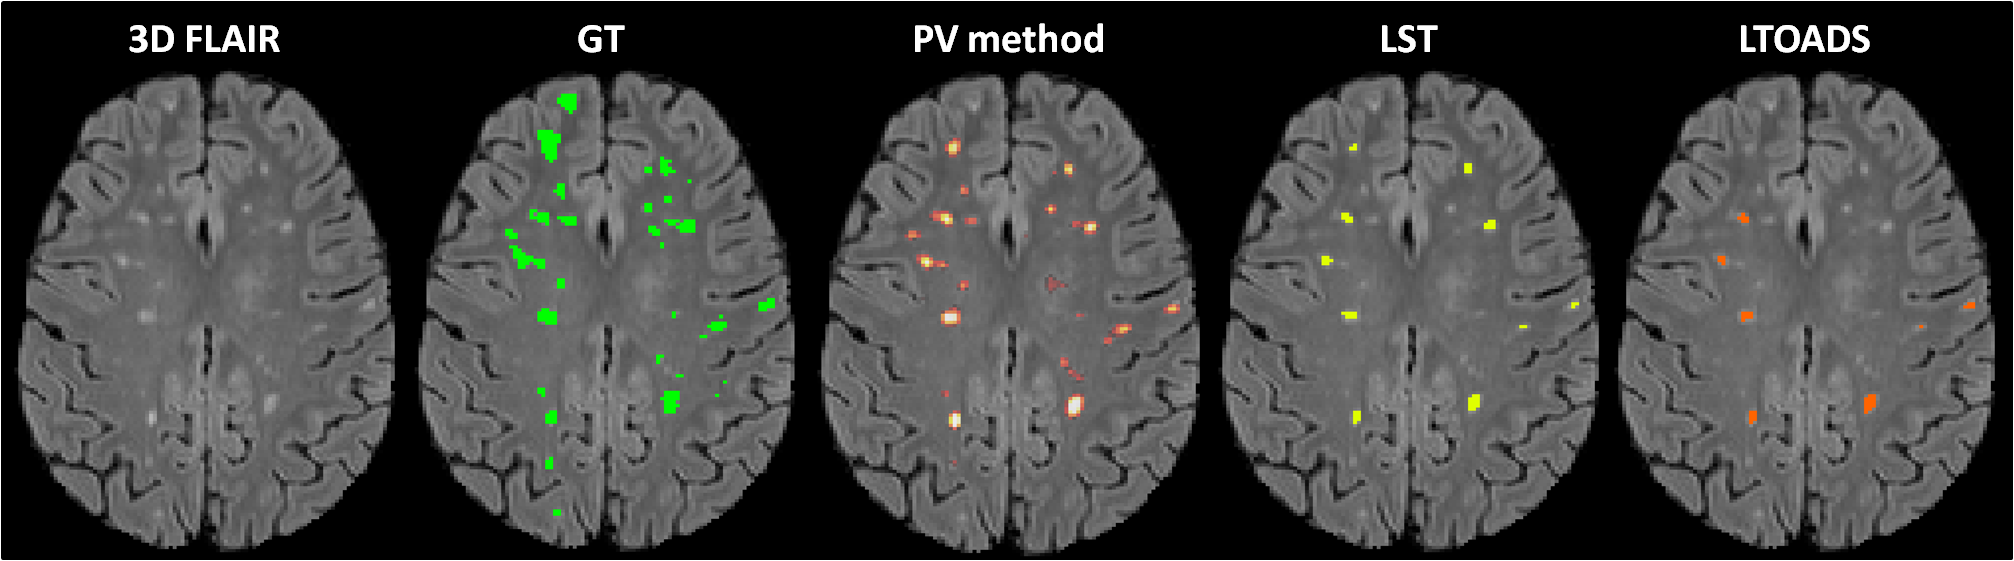
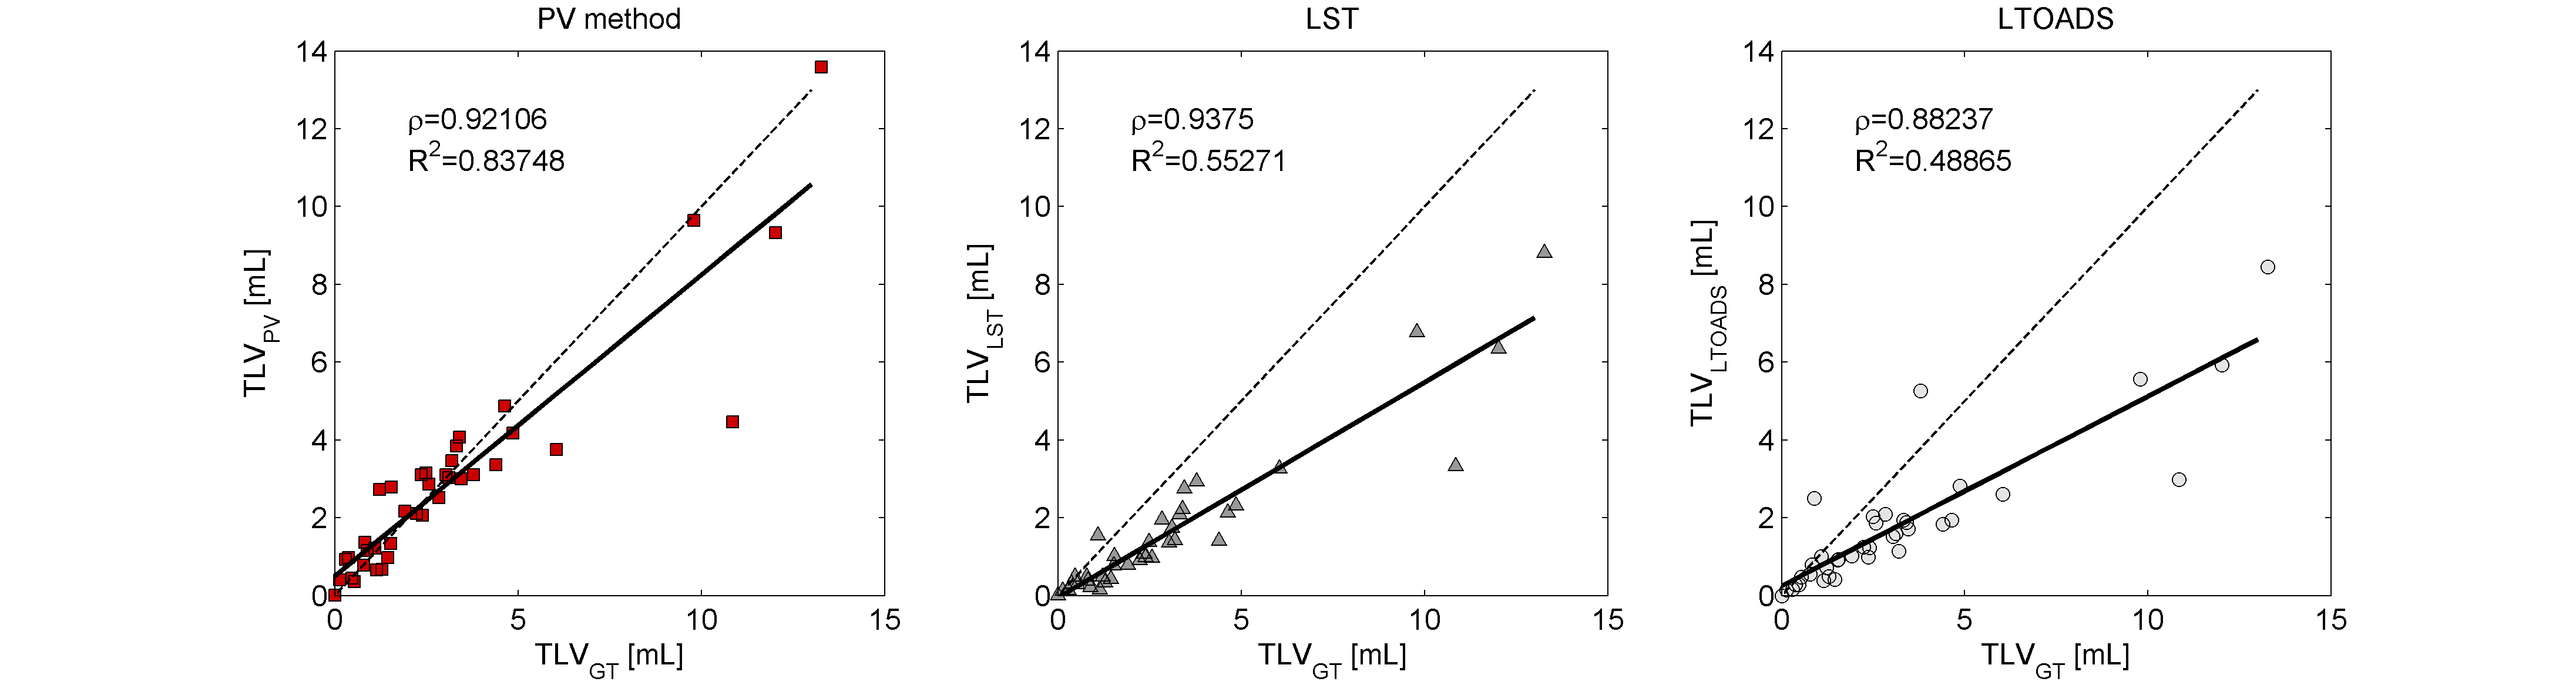
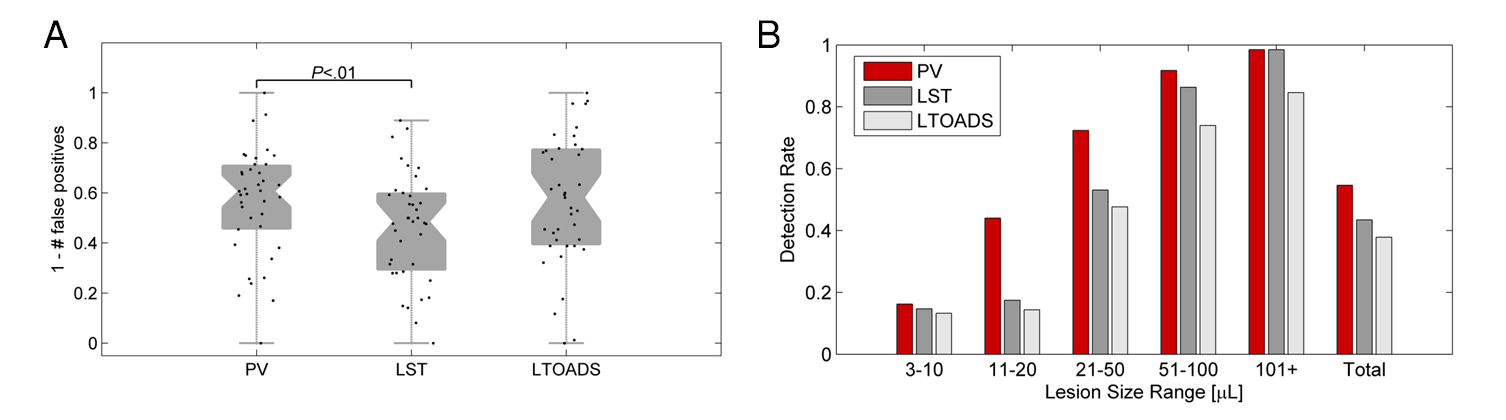
Figure 1 shows exemplary lesion maps as obtained from the different techniques. As shown in Figure 2, our method and LST (ρ=0.92, and ρ=0.94 respectively) were found to be more correlated with manually determined TLV than the LTOADS method (ρ=0.88). Both LST and LTOADS underestimated the TLVs for patients with high lesion loads as reflected by the coefficient of determination with respect to the identity line: R2=0.55 and R2=0.49 for LST and LTOADS against R2=0.88 for the proposed method. After applying the optimal threshold, our approach presented a similar false positive rate as the most specific method, LTOADS (p-value=0.7, Figure 3A). The proposed method presented the best overall DR (DR=55%) when compared to LST (DR=44%) and LTOADS (DR=38%, Figure 3B). The improvements in DR are more evident for smaller lesions with a volume lower than 20 μL.Discussion and Conclusion
Most MS lesion segmentation methods reported in the literature were trained, developed and validated on later-stage patients who exhibit important lesion load and large lesion size6-10. These methods typically show lower performance when applied to patient data exhibiting low lesion load and small lesions. However, accurate detection especially in the early stages of MS can be crucial for initial diagnosis and subsequent treatment monitoring. Here, we showed that modeling the PV effect improves volumetric measurements as well as the detection of small lesions. It can be concluded that PV effects should be taken into account in lesion segmentation algorithms, especially in early disease phase.Acknowledgements
No acknowledgement found.References
1. Ballester, M.A.G., A. Zisserman, and M. Brady, Segmentation and measurement of brain structures in MRI including confidence bounds. Medical Image Analysis, 2000. 4(3): p. 189-200.
2. Schmitter, D., et al., An evaluation of volume-based morphometry for prediction of mild cognitive impairment and Alzheimer's disease. NeuroImage: Clinical, 2014. 7: p. 7-17.
3. Tustison, N.J., et al., N4ITK: improved N3 bias correction. IEEE Trans Med Imaging, 2010. 29(6): p. 1310-20.
4. Choi, H.S., D.R. Haynor, and Y. Kim, Partial volume tissue classification of multichannel magnetic resonance images-a mixel model. IEEE Transactions on Medical Imaging, 1991. 10(3): p. 395-407.
5. Roche, A. and F. Forbes, Partial volume estimation in brain MRI revisited, in Medical Image Computing and Computer-Assisted Intervention–MICCAI 2014. 2014, Springer. p. 771-778.
6. Schmidt, P., et al., An automated tool for detection of FLAIR-hyperintense white-matter lesions in Multiple Sclerosis. Neuroimage, 2012. 59(4): p. 3774-83.
7. Shiee, N., et al., A topology-preserving approach to the segmentation of brain images with multiple sclerosis lesions. Neuroimage, 2010. 49(2): p. 1524-35.
8. Steenwijk, M.D., et al., Accurate white matter lesion segmentation by k nearest neighbor classification with tissue type priors (kNN-TTPs). Neuroimage Clin, 2013. 3: p. 462-9.
9. Anbeek, P., et al., Probabilistic segmentation of white matter lesions in MR imaging. Neuroimage, 2004. 21(3): p. 1037-44.
10. Fartaria, M.J., et al., Automated detection of white matter and cortical lesions in early stages of multiple sclerosis. Journal of Magnetic Resonance Imaging, 2016. 43(6): p. 1445-1454.
Figures