0253
Reproduciblity of advanced MR metrics in a multi-site, multi-vendor study of mild traumatic brain injury1Radiology, Medical College of Wisconsin, Milwaukee, WI, United States, 2Neurosurgery, Medical College of Wisconsin, Milwaukee, WI, United States, 3Radiology and Imaging Services, Indiana University, Indianapolis, IN
Synopsis
The Advanced Research Core of the Concussion Assessment Research and Education consortium includes a multi-site, multi-vendor, multi-contrast imaging acquisition protocol with T2 FLAIR, quantitative T2*, task free fMRI, ASL, and DTI. This abstract describes the variance of measurements made in the first year and a half of the study from these imaging methods across a cohort of non-contact sport control athletes. With the variance of these measurements in the colligate athlete population known, the sensitivities of the individual and combined contrasts to diagnose injury and recovery can be assessed.
Purpose
As part of the concussion assessment, research, and education (CARE) study’s advanced research core (ARC), a multi-contrast magnetic resonance imaging protocol has been deployed at four NCAA Division I colleges including University of California Los Angeles (UCLA), University of North Carolina (UNC), University of Wisconsin (UW), and Virginia Tech (VT). This protocol, including Siemens Prisma, Skyra, and Trio as well as GE Healthcare Discovery MR750 3T MRI systems, involves imaging concussed athletes, along with matched contact sport and non-contact sport control athletes at 24-48 hours post injury, the day when the athlete is cleared for return to play, seven days after the athlete is cleared for return to play, and six months after injury. Imaging acquisitions include: T2 FLAIR, T2* mapping, arterial spin labeling, dual b-value diffusion, and task free functional imaging. This abstract describes the variance of measurements made in the first year and a half of the study from these imaging methods across the cohort of non-contact sport control athletes. With the variance of these measurements in the collegiate athlete population known, the sensitivities of the individual and combined contrasts to diagnose injury and recovery can be assessed.Methods
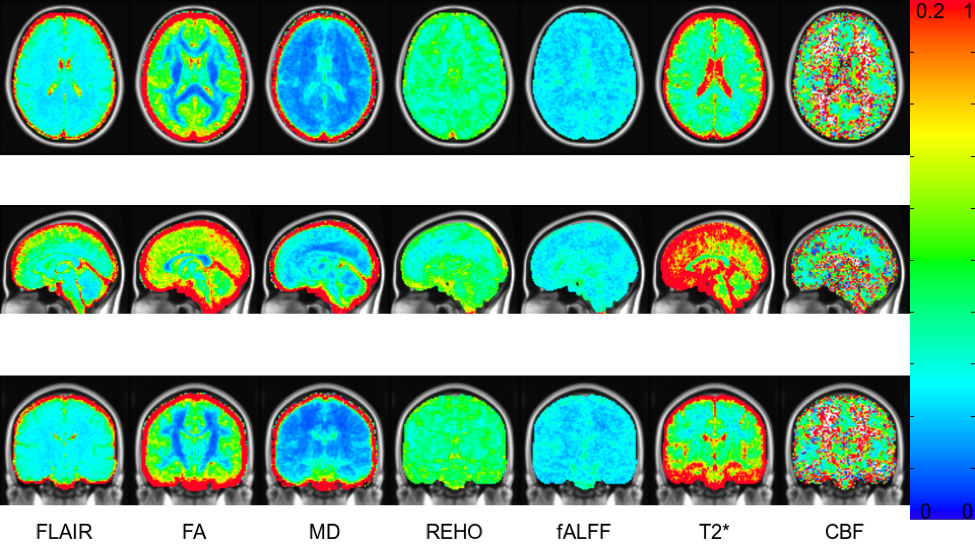
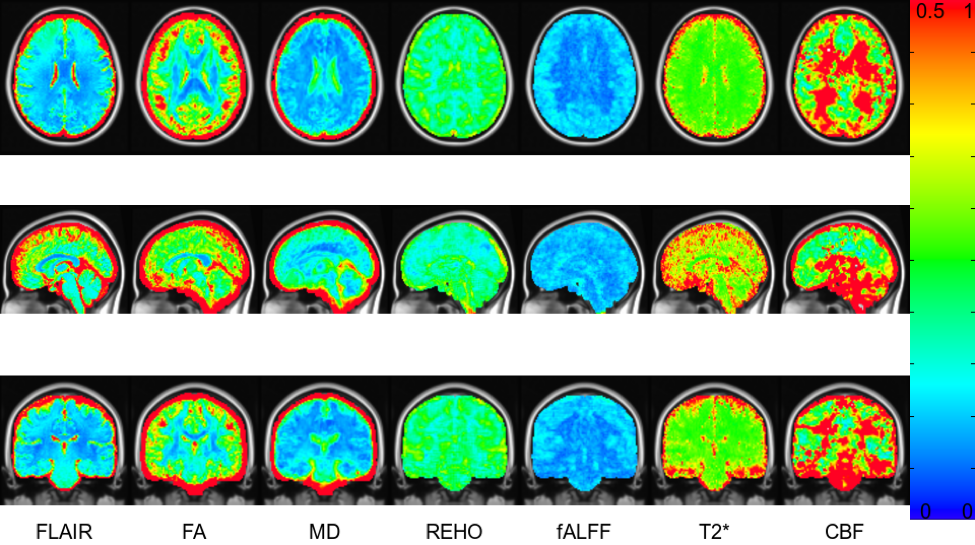
Voxel-wise maps of coefficient of variation (CV = standard deviation / mean) were generated for each imaging contrast. Non-quantitative measurements, including T2 FLAIR and relative CBF, were normalized by full brain gray matter signal before CV maps were generated. Quantitative metrics included fractional anisotropy (FA)1, mean diffusivity (MD)1, regional homogeneity of low frequency fluctuations (REHO)2, and fractional amplitude of low frequency fluctuations (fALFF)3. Analysis included 28 colligate athletes participating in non-contact sports (UCLA 6, UNC 13, UW 4, VT 5) following transformation to MNI space4,5. CVs were computed across all time points for each non-contact sport control athlete and across all non-contact sport control athletes for the first acquired time point. Following quality assurance review in which data were excluded if they showed significant motion or other artifact, 21 FLAIR, 15 ASL, 23 diffusion, and 22 fMRI data sets were considered.
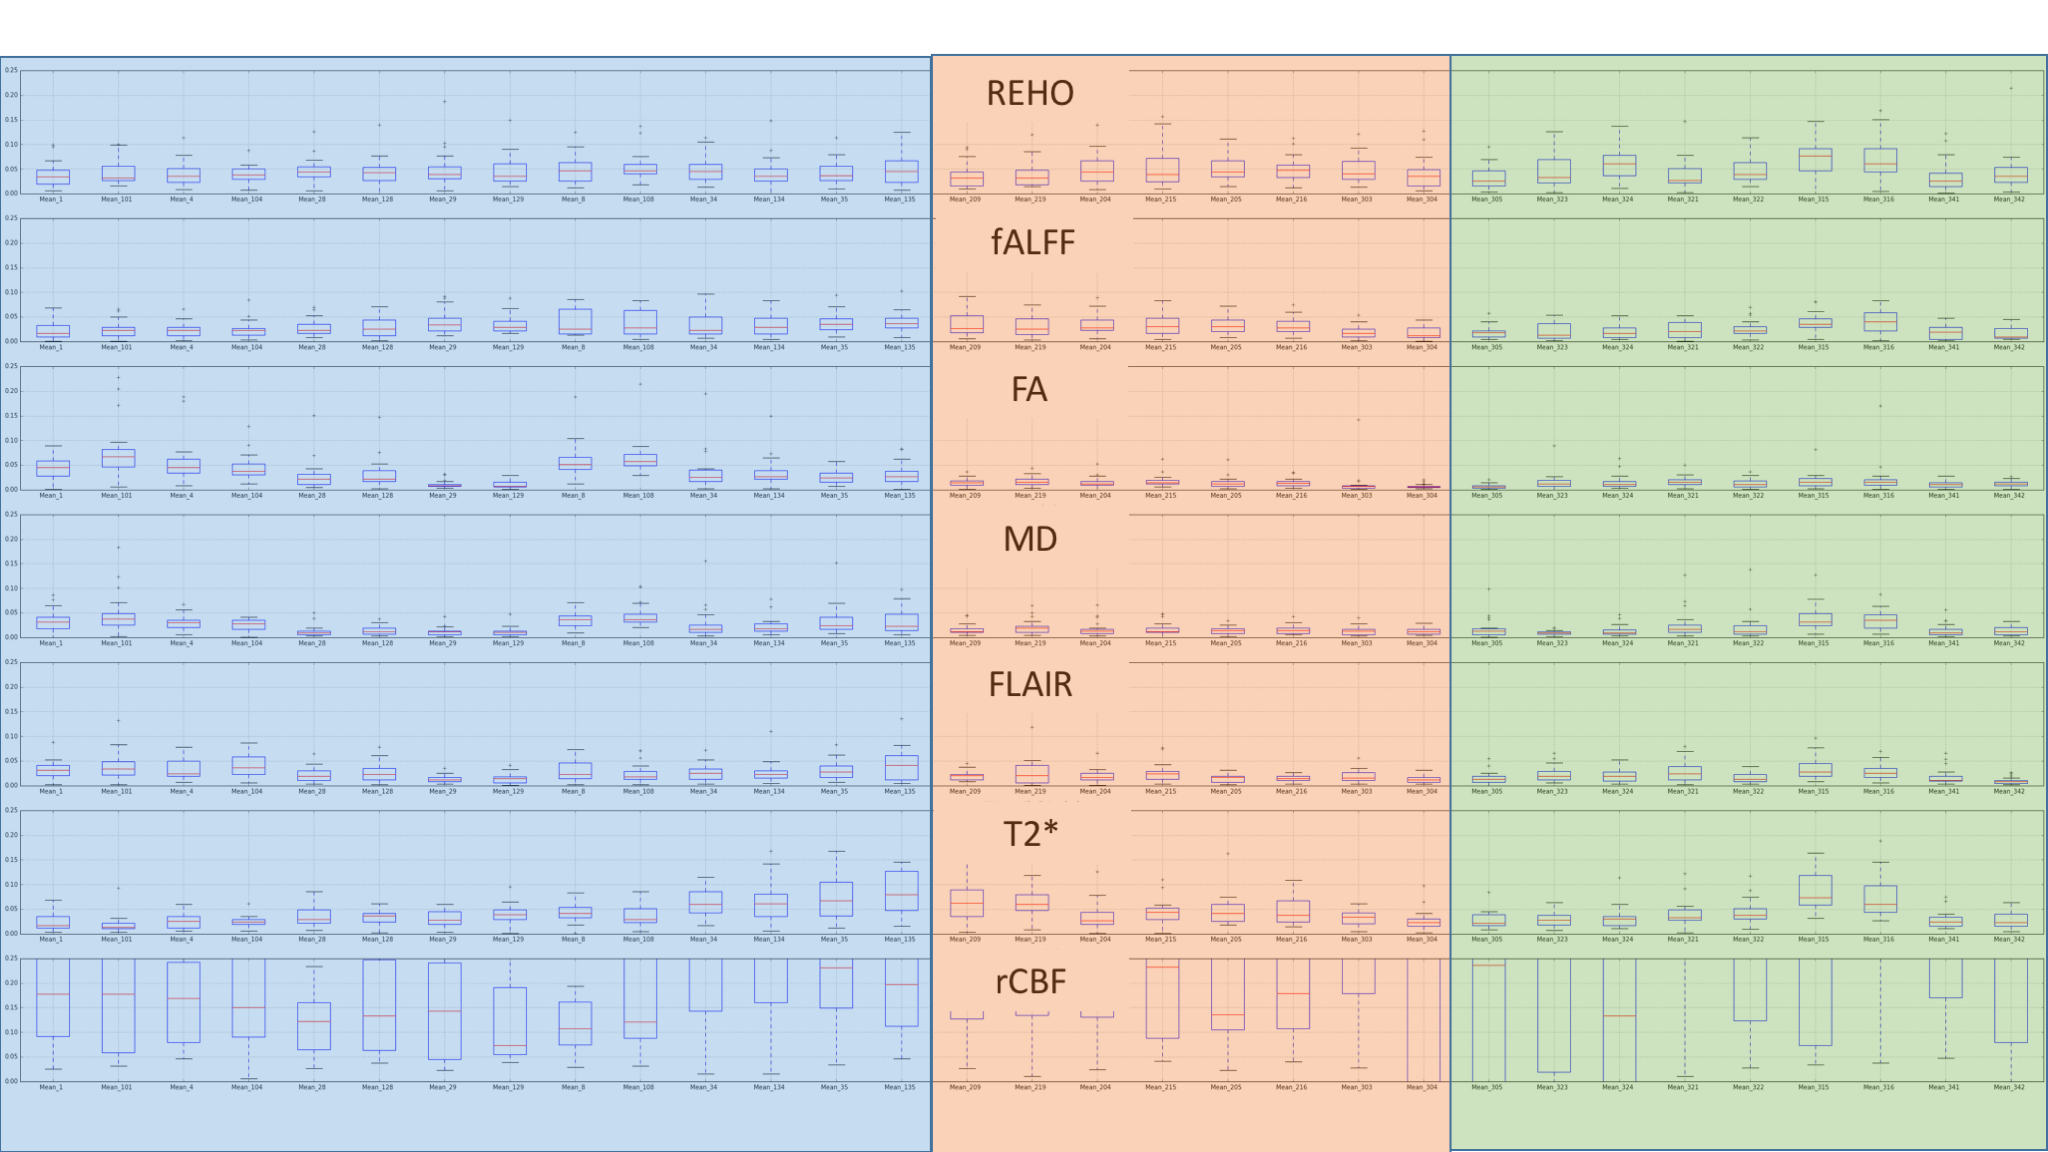
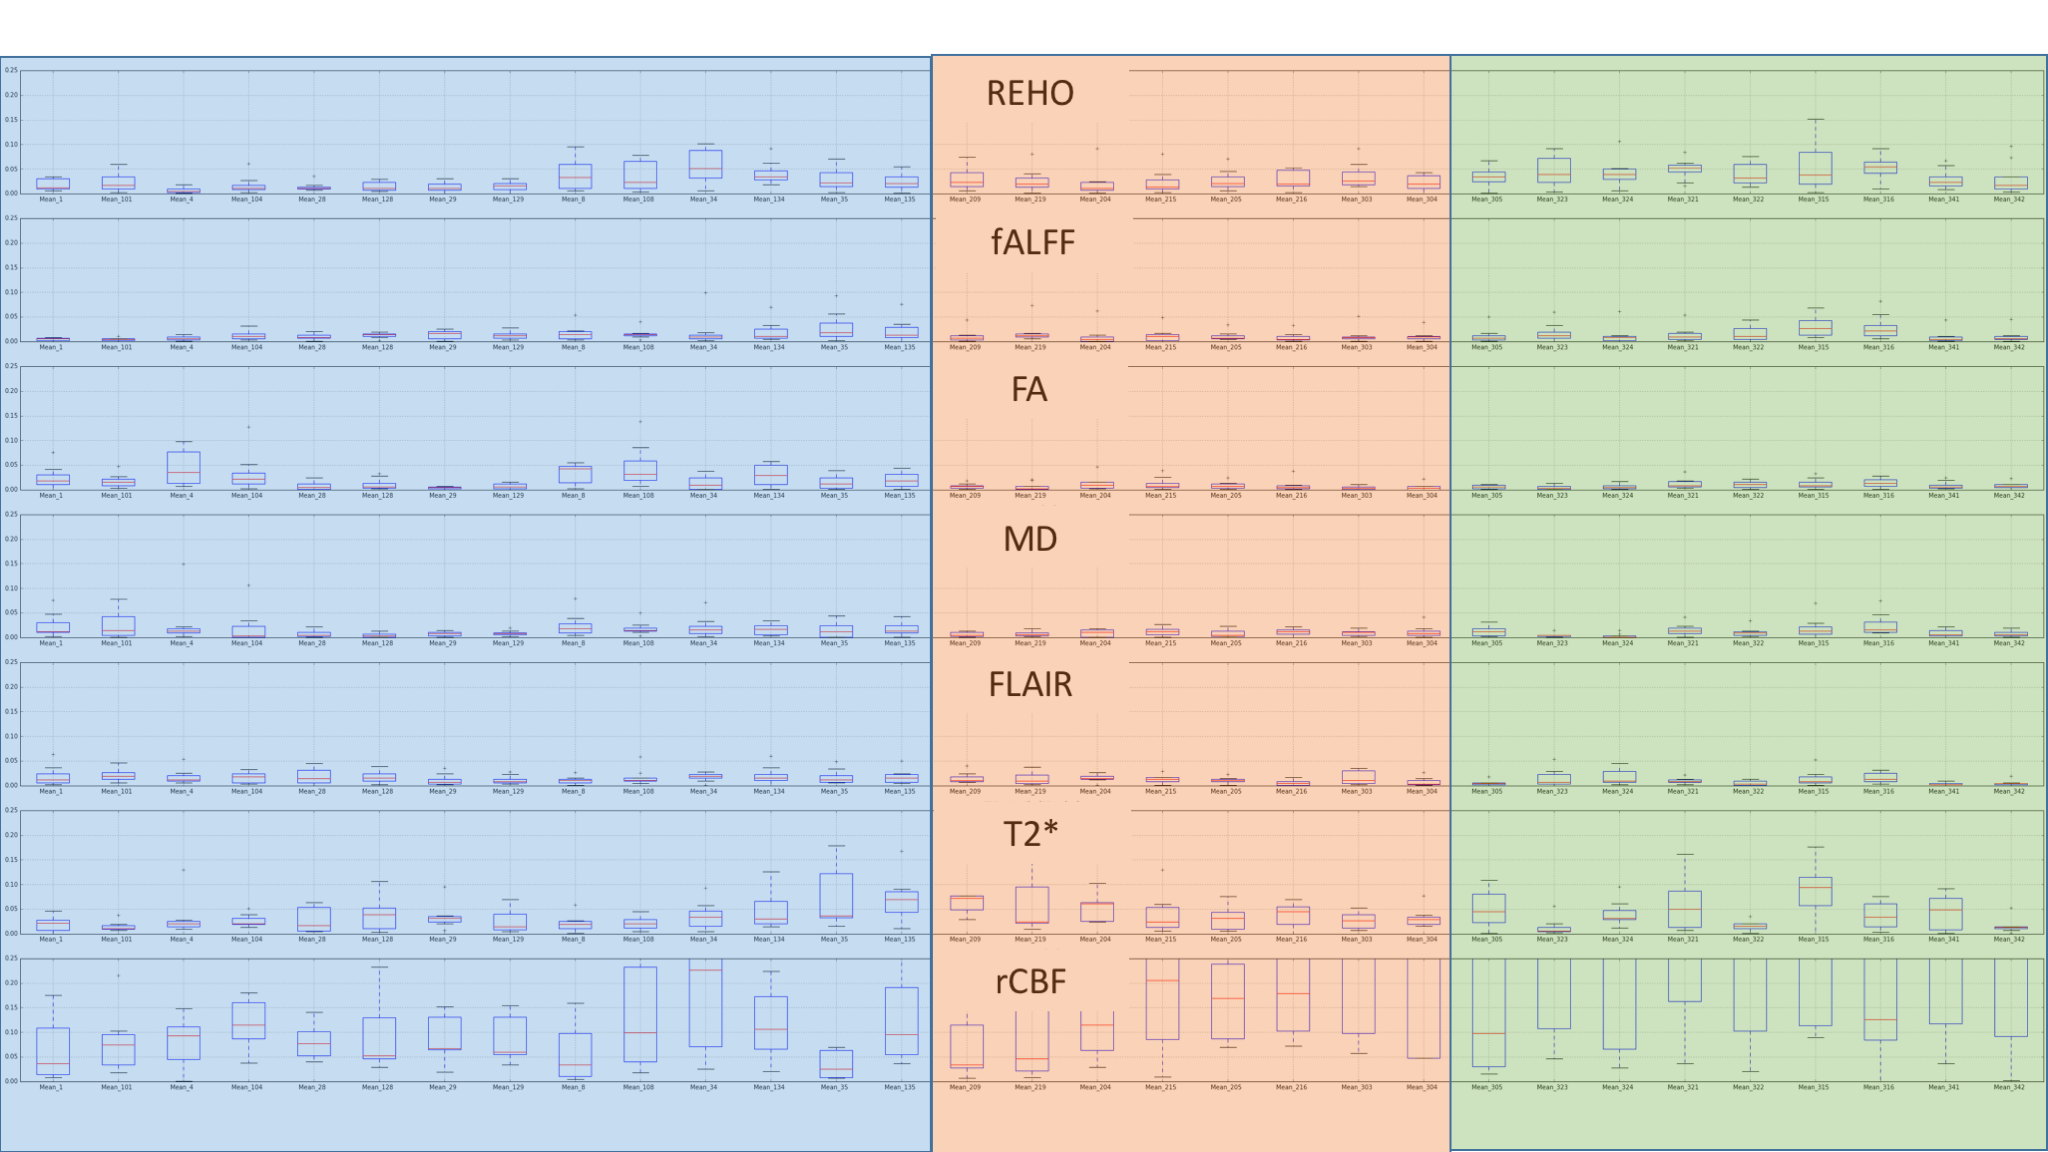
Additionally, data from 31 regions of interest based upon the Harvard-Oxford brain atlas4 and Johns Hopkins white matter atlas5 spread throughout cortical and deep brain gray matter and white matter were selected for stability analysis (Frontal Pole R/L, Middle Frontal Gyrus R/L, Paracingulate Gyrus R/L, Cingulate Gyrus Anterior Division R/L, Temporal Pole R/L, Parahippocampal Gyrus Anterior Division R/L, Hippocampus R/L, Thalamus R/L, Caudate R/L, Genu of Corpus Callosum, Body of Corpus Callosum, Splenium of Corpus Callosum, Anterior Corona Radiata R/L, Retrolenticular Internal Capsule R/L, Cerebral Peduncle R/L, Superior Longitudinal Fasciculus R/L). CVs were calculated across all non-contact control athletes, as well as across two subjects who traveled across all sites.
Results
Within subject and inter-subject coefficients of variation are shown in Figures 1 and 2. Within subject variations are lower than between subject variations by a factor of approximately two. CBF measurements are confirmed to be unreliable outside of gray matter, but relatively consistent within the well perfused gray matter. Variations arising from vendor differences in CBF and T2* measurements are apparent through increased CV with inter-subject comparisons. Box plots of inter-subject CV for select gray and white matter regions of interest are shown in Figure 3, while box plots of inter-site CV for those same regions of interest are shown in Figure 4.Discussion
Coefficients of variation are in line with what would be expected in the respective modalities6,7,8. Functional and blood flow metrics are most consistent within gray matter, while diffusion metrics are most consistent within white matter. Figures 3 and 4 show that the inter-subject variability is greater in this data than inter-site variability.Conclusion
The cross-platform, multi-contrast design of this study yields an array of imaging metrics for use in the assessment of concussion assessment and recovery. Variance of measurements across subjects in the considered metrics are greater than variances between sites, and are on the order of variance metrics published in in other studies.Acknowledgements
This work was funded as part of the NCAA DOD Grand Alliance CARE Consortium.References
1. Bernstein, et al. Handbook of MRI Pulse Sequences (2004) 2. Zang, et al. NeuroImage 22: 294-400 (2004) 3. Zou, et al. Journal of Neuroscience Methods 172: 137-141 (2008) 4. FSL fsl.fmrib.ox.ac.uk/fsl/fslwikil/FSL 5. Fonov, et al. Neuroimage 54: (2011) 6. Vollmar et al. NeuroImage 51: 1384-1394 (2010) 7. Li et al. Journal of Magnetic Resonance Imaging 36: 344-354 (2012) 8. Zuo et al. Scientific Data 1:140049 (2014).Figures