0252
Machine Learning Based Diagnosis of Early Parkinson's Disease using QSM1Department of Mechanical and Aerospace Engineering, Seoul National University, Seoul, Korea, Republic of, 2Department of Electrical and Computer Engineering, Seoul National University, Seoul, Korea, Republic of, 3Department of Radiology, Seoul National University Boramae Medical Center, Seoul, Korea, Republic of
Synopsis
This study proposed a support vector machine model to classify early PD patients from healthy controls using QSM. The results validated better performance of SVM than conventional logistic regression based on statistical ordering of backward feature selection. This computer aided technique may help to reduce misdiagnosis rate of early-PD patients.
Purpose
Pathogenesis of Parkinson’s disease (PD) is associated with iron deposition in the midbrain [1-3]. Since the resulting iron accumulation alters the distribution of susceptibility of the brain [4,5], recent PD studies have focused on changes in the susceptibility using quantitative susceptibility mapping (QSM) [1,2]. However, it is still challenging to diagnose early-PD with susceptibility changes due to the insignificant amount of iron deposition. In this study, we aimed to enhance the accuracy of diagnosing early-PD by applying QSM technique using machine learning.Methods
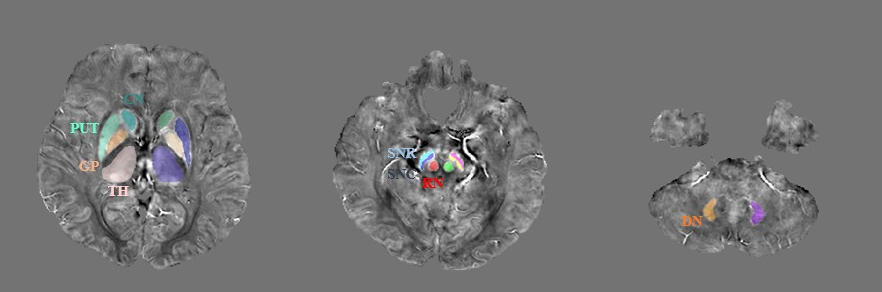
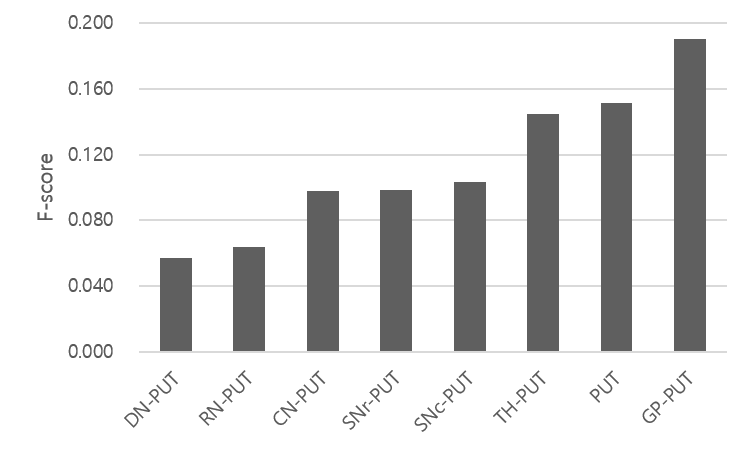
The study was conducted with a group of 51 early-PD patients (70.90 ± 9.20 year) and a group of 29 healthy controls (66.03 ± 10.01 year). Data were collected at 3T MRI (IRB-approved). QSM image: a 3D PRESTO sequence was acquired with the following parameters: resolution = 0.3906 x 0.3906 x 2 mm3, slices = 70 or 90 slices, TR = 18.16 to 20.77 ms, TE = 25.65 to 29.60 ms. To reconstruct QSM images, Harperella algorithm was used for phase unwrapping and iLSQR algorithm for estimation of magnetic susceptibility [6]. ROI selection: Eight ROIs (caudate nucleus (SN), putamen (PUT), globus pallidus (GP), thalamus (TH), substantia nigra pars compacta (SNc), substantia nigra pars reticulata (SNr), red nucleus (RN), and dentate nucleus (DN)) were selected (Figure 1) [1]. Each ROI was manually segmented using ITK-SNAP [7]. QSM offset compensation: To compensate for an arbitrary offset in each QSM data, putamen was used as a reference and the value was subtracted from other ROIs. Support Vector Machine (SVM): SVM spreads the input data onto a higher dimensional space through a kernel function to linearly separate data patterns. The SVM model maximizes margin of the nearest support vector of two groups around the hyperplane. The accuracy of the SVM model is improved by choosing the kernel function for the better separation of the space. To obtain an optimal SVM model, we conducted grid search of the kernel function. For the backward elimination of the input ROIs, F-score was measured for each ROI [8]. Higher the F-score is, it is more likely for the feature to be discriminative between two groups. Then, 10-fold cross-validation was repeated for 100 times to examine the performance of the SVM, eliminating the least contributing ones based on the F-score (backward elimination). Logistic regression (LR) was also constructed to compare the performance with SVM. Along with LR, areas under the ROC curve (AUCs) of individual ROIs were calculated to compare with that of SVM. To visualize the distribution of the QSM data in PD and HC, the scatter plots of the groups in a set of two ROIs with the two highest F-score were plotted.Results
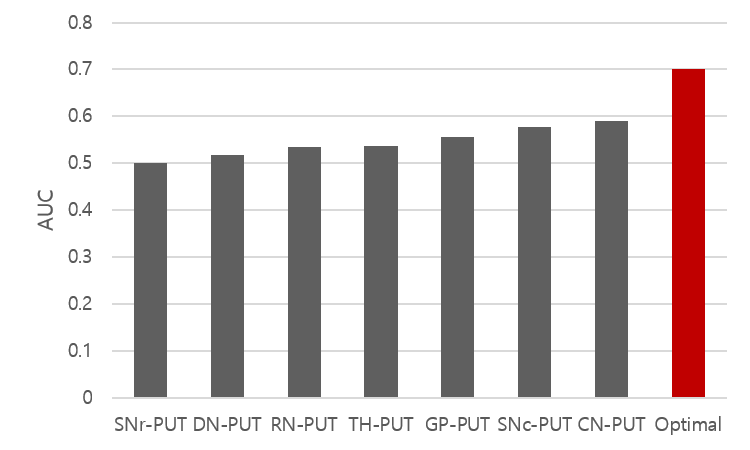
Input variables: The order of eliminating input data for backward elimination was shown in Figure 3 (eliminated from low to high of F-score). Performance: The SVM with the selected optimal ROIs (GP, TH, SNc, and SNr) recorded overall better accuracy (0.744), AUC (0.700), sensitivity (0.723), and specificity (0.776) compared to those in LR (accuracy = 0.718, AUC = 0.646, sensitivity = 0.751, and specificity = 0.670). To validate the classified result, we compared the AUC of SVM model with the AUC of each features (Table 1). The highest among the AUCs of individual features recorded 0.589 (CN) and it was smaller than the AUC of SVM (relative difference = 18.84%), demonstrating SVM had better performance to detect early-PD compared to individual features.Discussion
In this study, we proposed the 10-fold cross-validation SVM model to classify early-PD from HC using QSM. To optimize the performance, we used the statistical ordering of F-score for the backward elimination. Although the performance of the SVM is statistically worthwhile, it may be insufficient for clinical applications. Nevertheless, as shown in Figure 4, distributions of QSM in PD and HC were highly overlapping, suggesting that 74.4 % accuracy of the SVM may be acceptable for the detection of early-PD. Also, if additional clinical diagnostic information such as symptoms is included in SVM, the performance may increase in detecting early-PD [9].Conclusion
In this work, we demonstrated that SVM can potentially be used as a classifier to diagnose early-PD with QSM values.Acknowledgements
This research was supported by the Brain Research Program through the National Research Foundation of Korea(NRF) funded by the Ministry of Science, ICT & Future Planning (NRF-2015M3C7A1031969) and by the Brain Korea 21 Plus Project in 2016.References
[1] Guan, Xiaojun, et al. "Regionally progressive accumulation of iron in Parkinson's disease as measured by quantitative susceptibility mapping." NMR in Biomedicine (2016).
[2] Ide, Satoru, et al. "Internal structures of the globus pallidus in patients with Parkinson’s disease: evaluation with quantitative susceptibility mapping (QSM)." European radiology 25.3 (2015): 710-718.
[3] Kwon, Dae-Hyuk, et al. "Seven-tesla magnetic resonance images of the substantia nigra in Parkinson disease." Annals of neurology 71.2 (2012): 267-277.
[4] Liu, Chunlei, et al. "Quantitative Susceptibility Mapping: Contrast Mechanisms and Clinical Applications." Tomography: a journal for imaging research 1.1 (2015): 3.
[5] Wang, Yi, and Tian Liu. "Quantitative susceptibility mapping (QSM): decoding MRI data for a tissue magnetic biomarker." Magnetic resonance in medicine73.1 (2015): 82-101.
[6] Li, Wei, et al. "Integrated Laplacian-based phase unwrapping and background phase removal for quantitative susceptibility mapping." NMR in Biomedicine27.2 (2014): 219-227.
[7] Yushkevich, Paul A., et al. "User-guided 3D active contour segmentation of anatomical structures: significantly improved efficiency and reliability." Neuroimage 31.3 (2006): 1116-1128.
[8] Chen, Yi-Wei, and Chih-Jen Lin. "Combining SVMs with various feature selection strategies." Feature extraction. Springer Berlin Heidelberg, 2006. 315-324.
[9] Jain, Samay, Steven E. Lo, and Elan D. Louis. "Common misdiagnosis of a common neurological disorder: how are we misdiagnosing essential tremor?." Archives of neurology 63.8 (2006): 1100-1104.
Figures