0251
Population Receptive Field Mapping of Human Somatosensory Cortex at 7 T1SPMIC, School of Physics, University of Nottingham, Nottingham, United Kingdom, 2School of Psychology, University of Nottingham, Nottingham, United Kingdom
Synopsis
To advance the investigation of function and structure in human somatosensory areas, detailed topographic maps that are reproducible across time are invaluable. In previous 7 Tesla fMRI studies using travelling wave (TW) and event-related (ER) paradigms, the functional parcellation of digit representations in human S1 has been shown. Here, we present the application of ‘population Receptive Field’ analysis (pRF) to high-resolution fMRI data from somatosensory cortex. The pRF method can provide information beyond preferred stimulus location, such as measures of receptive field size. We also show how surface coils can be used to improve spatial resolution in somatotopic maps.
Purpose
Detailed and reproducible topographic maps are important for studying somatosensory cortex (S1/S2) in healthy individuals and patients, e.g. altered sensory hand representations in dystonia. However, underlying mechanisms are unclear and detailed maps of such changes are unavailable1. Until now, block2,3, travelling wave (TW) and event-related (ER) paradigms4,5 have been used to measure somatotopic maps in human S1. Here, we apply population Receptive Field (pRF) mapping6 to 7T functional MRI data of S1, providing additional information (pRF size, preferred stimulus location) about the functional organization of S1.Methods
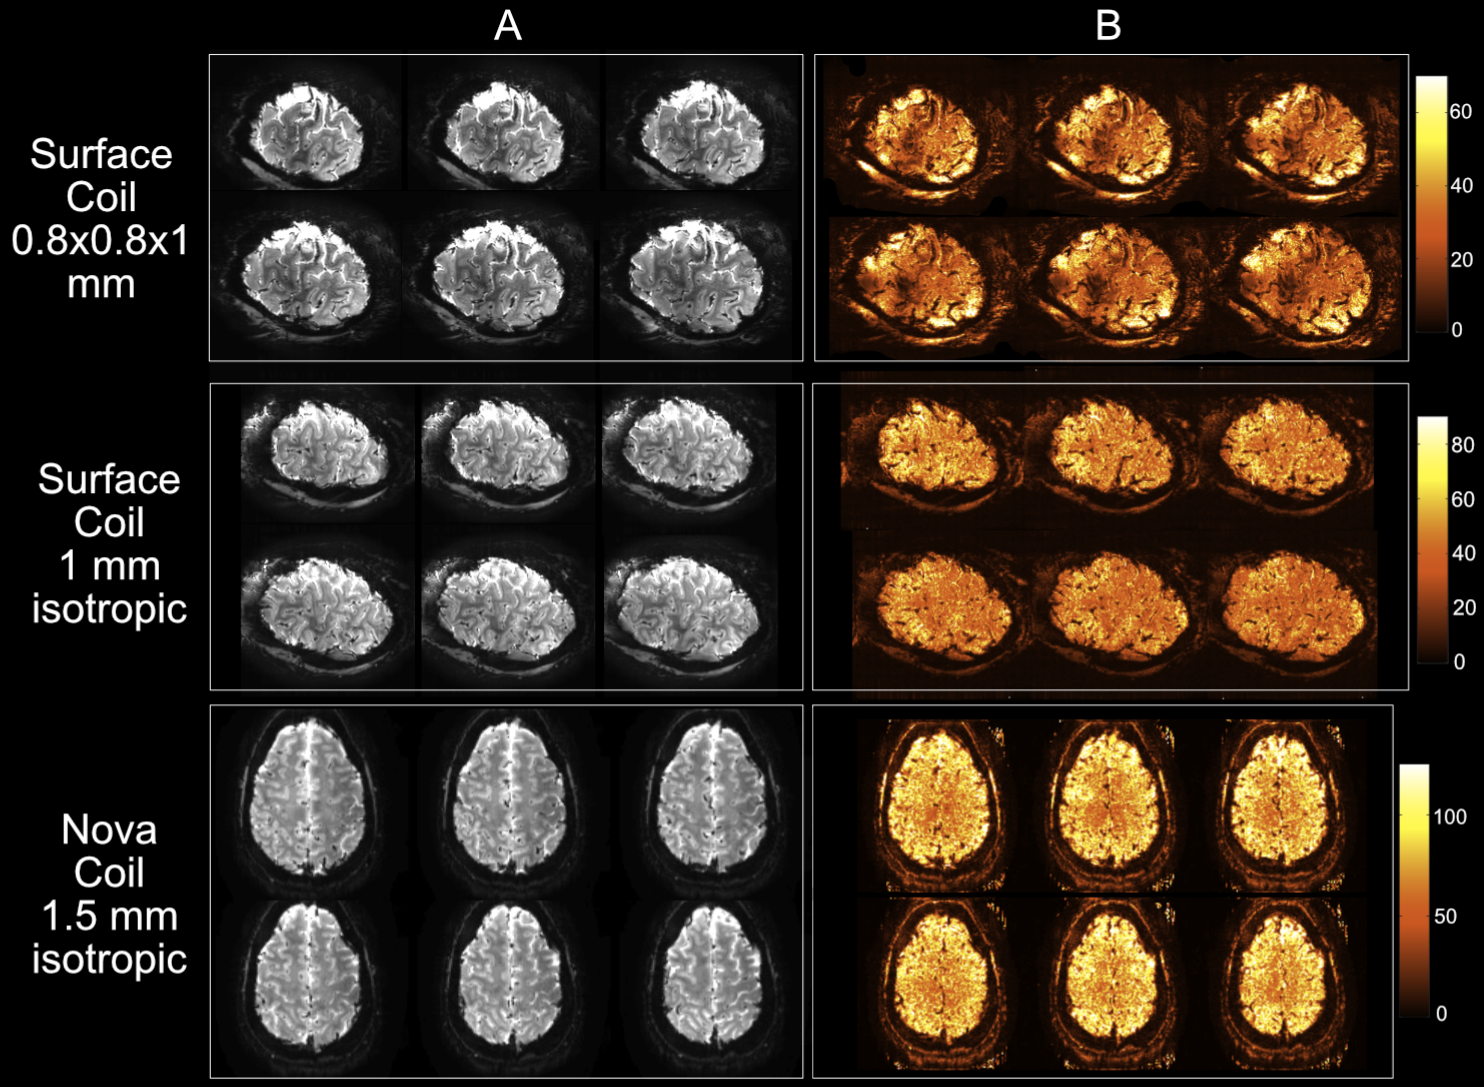
Somatosensory fMRI data were collected on a 7T Philips Achieva scanner using either (1) a 32-channel Nova receive coil (four datasets, two at MB2) and (2) two 16-channel surface coils (MRCoils) (three datasets, MB1). fMRI parameters: GE-EPI BOLD, TR/TE = 2000/25ms; 32-ch Nova Coil: (1.5mm)3 (MB2) & (1.25mm)3 (MB1), 26/52 slices; 32-ch Surface coil: 0.8×0.8×1mm3 & 1mm3 (MB1), 20 slices. High-resolution structural data: T1-weighted, Phase Sensitive Inversion Recovery (PSIR) images, 0.3×0.3×1mm3.
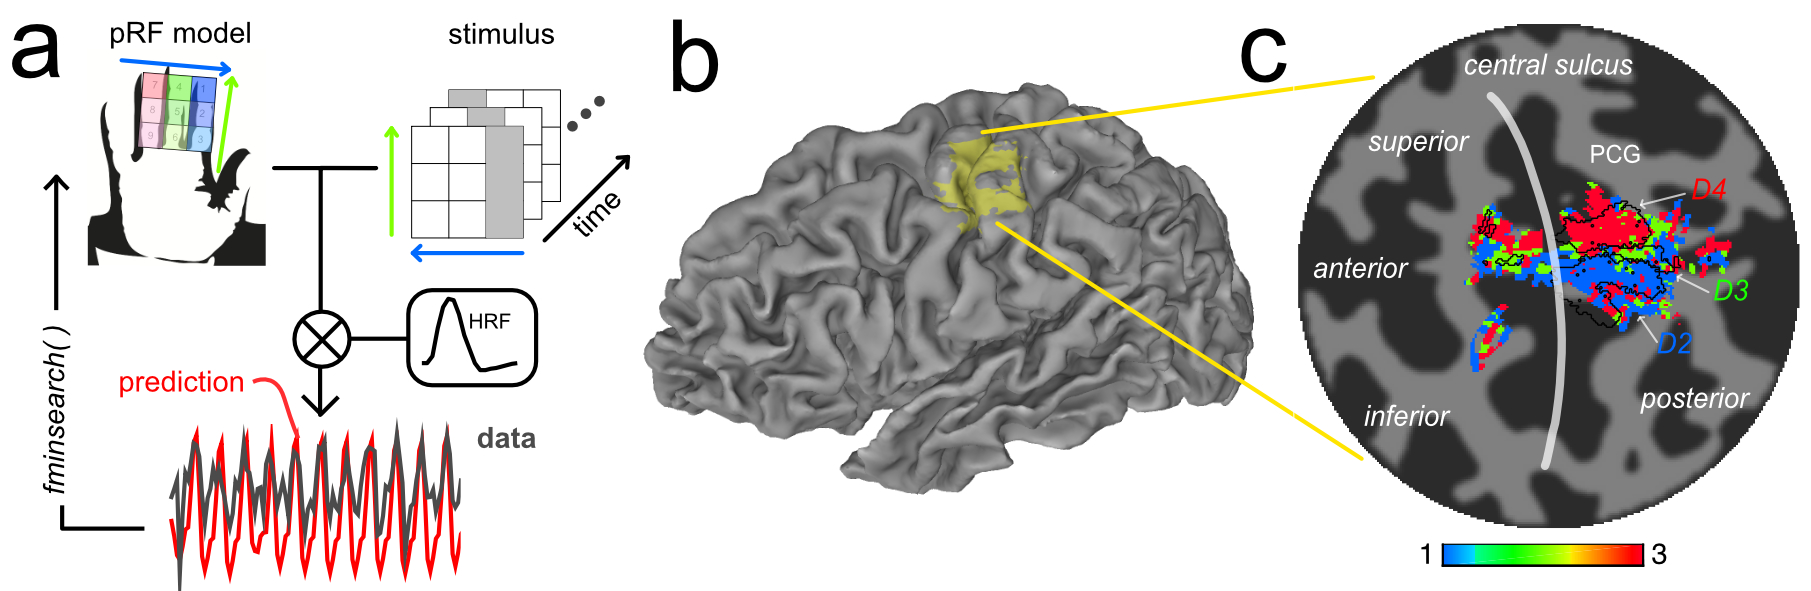
The fMRI paradigm used nine independently controlled piezo-devices (Dancer Design, UK) to deliver vibrotactile stimuli (30 Hz) to each phalanx of the index (D2), middle (D3), and ring finger (D4) of subjects’ right hand, in a 3×3 grid of stimulation sites. Each piezo-device stimulated ~1mm2 of skin. The paradigm comprised a modified TW paradigm interspersed with brief rest periods: (a) between digits (BD), 6s stimuli per digit, 12 cycles, (b) within-digits (WD), 6s stimuli on proximal to distal sites, 12 cycles, (c) diagonal stimulation (Diag), 6s, 8 cycles.
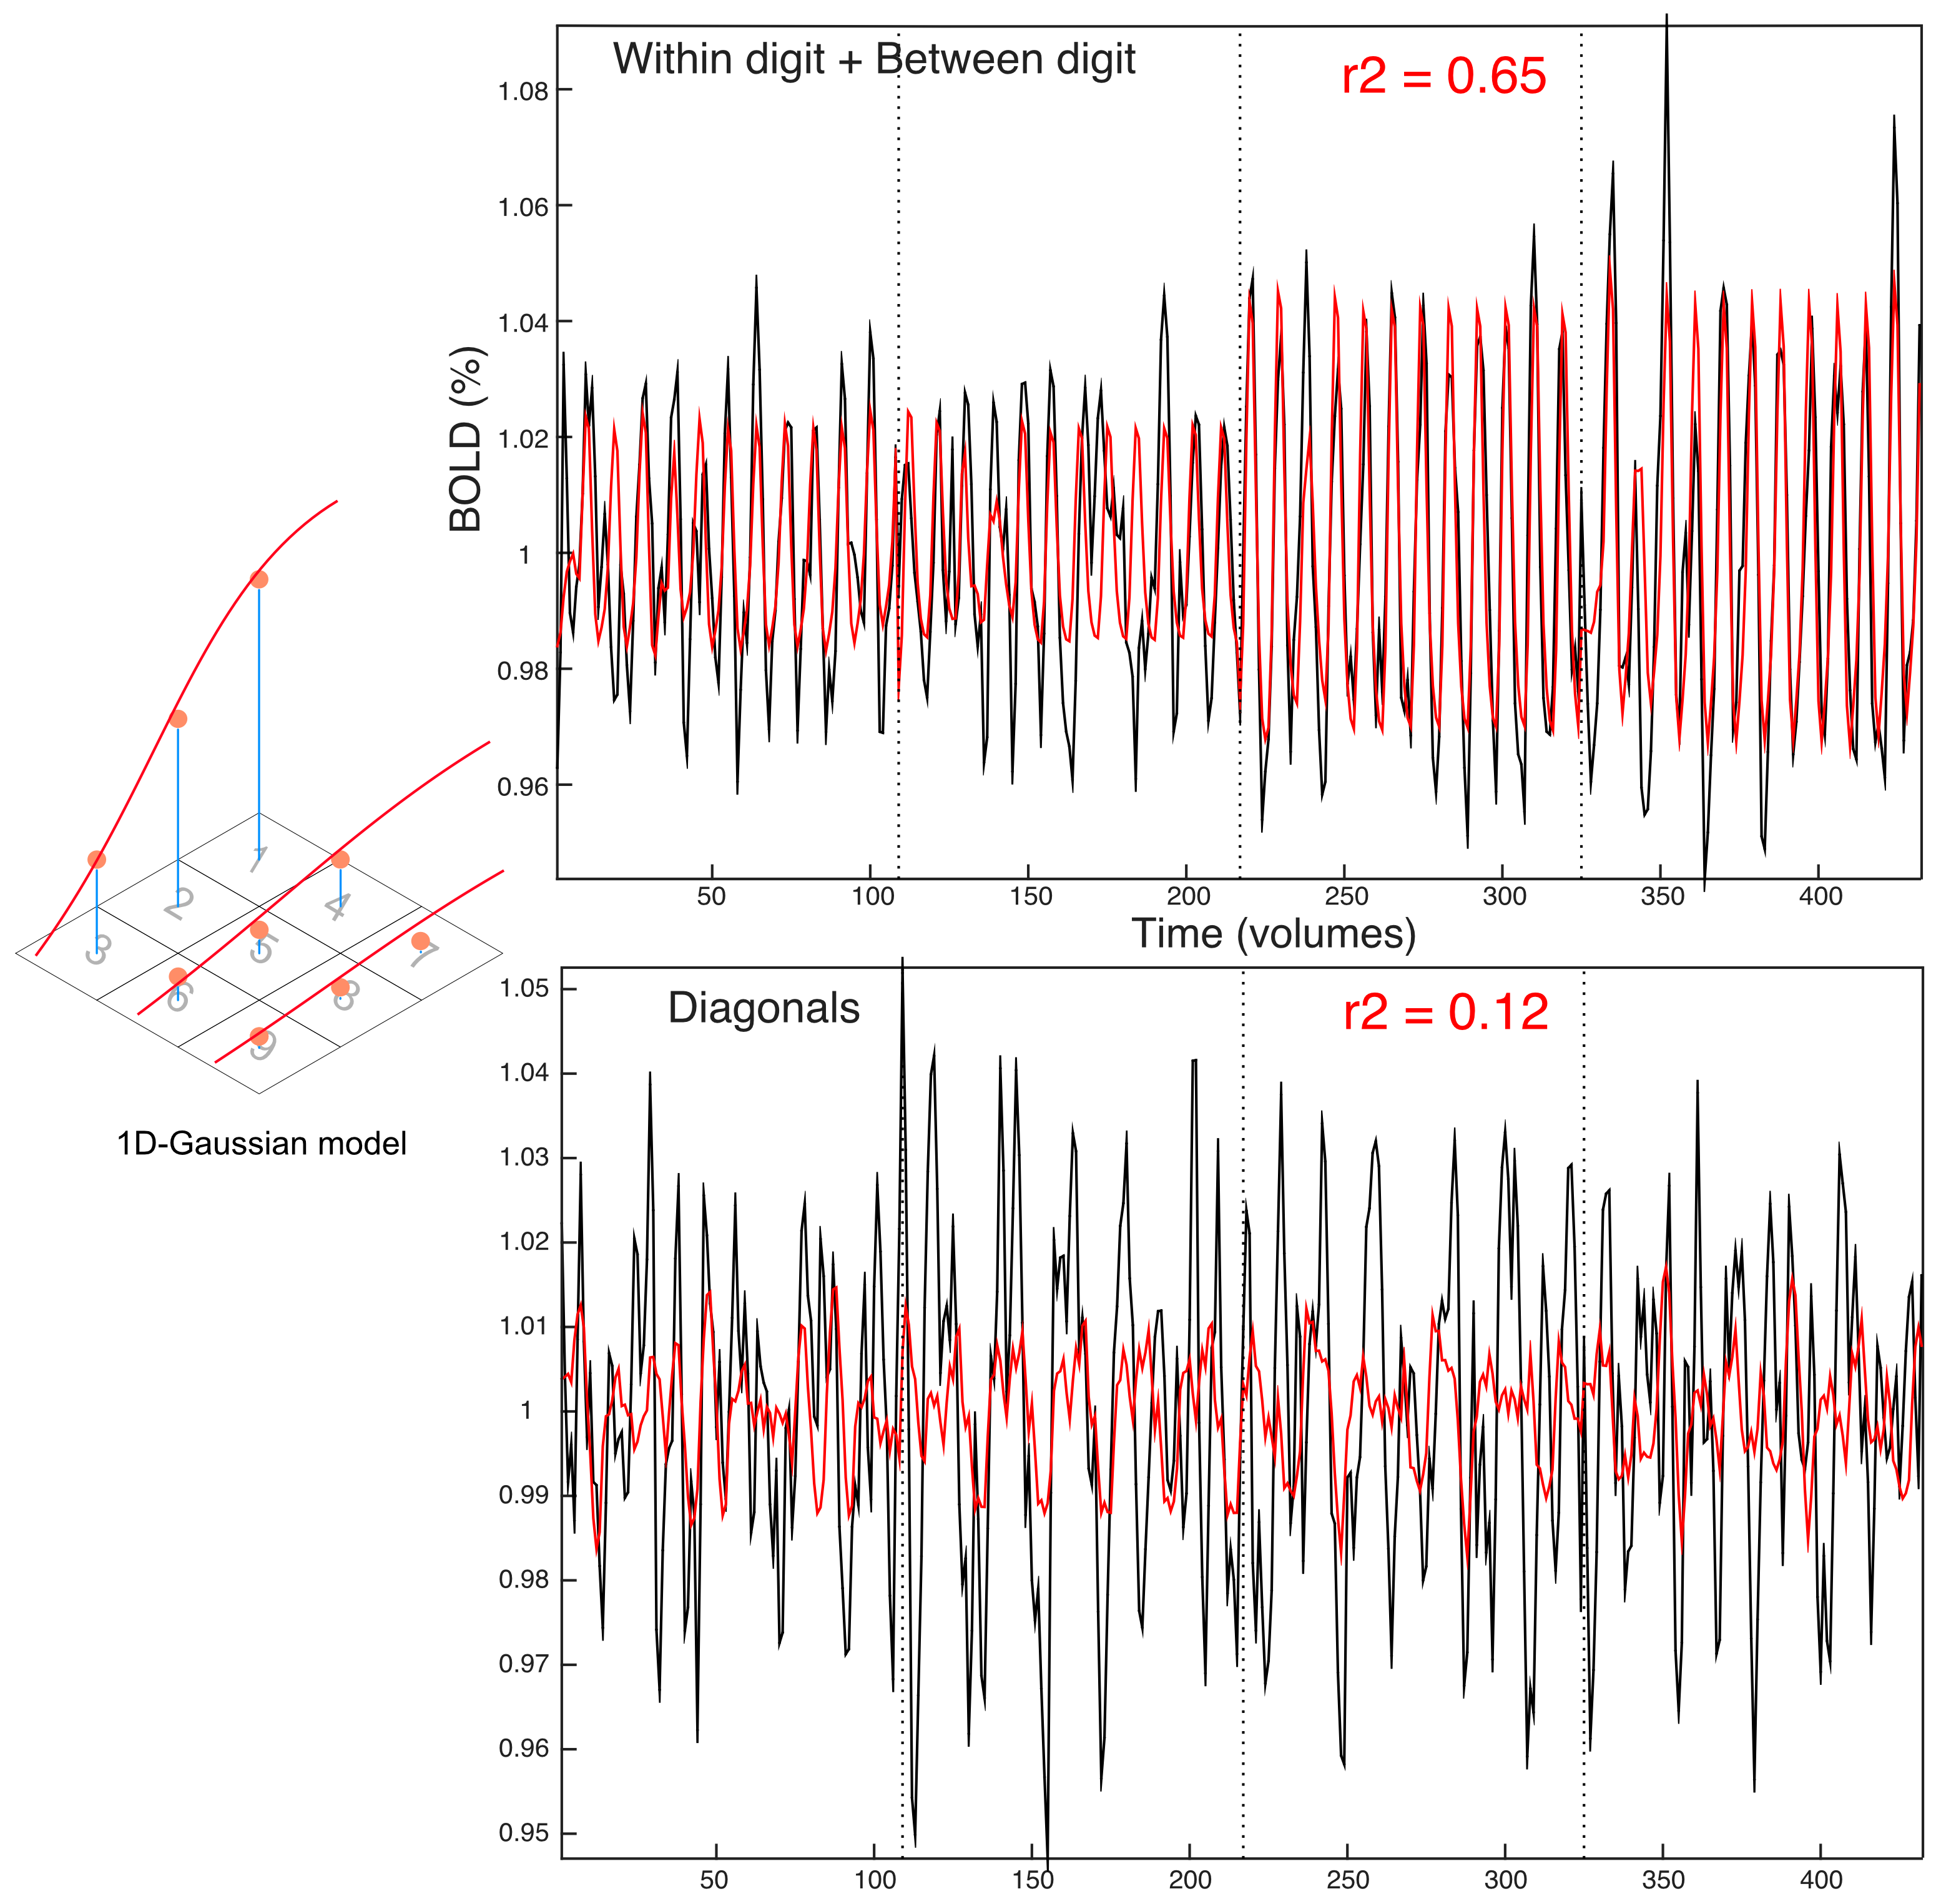
To fit the somatosensory fMRI data, we adapted a previously reported pRF framework6. We tested different models for the spatial layout of the pRF (1-dimensional/2D-Gaussian, unconstrained) and haemodynamic response function (single, double-gamma), to compute predicted fMRI responses from the spatial location of the stimuli (3×3 grid) over time. The best-fit parameters were estimated by nonlinear least squares7,8. fMRI data were also analyzed using Fourier-based TW methods to produce comparison somatotopic maps. For visualization, parameter maps from the pRF and TW analyses were superimposed on cortical surfaces derived using FreeSurfer9,10.
Results
Temporal signal-to-noise (tSNR) calculations confirmed the benefits of the surface coil: 1.4x reduction in tSNR despite a 5x volume reduction (Fig.1, 2), yielding increased number of voxels for analysis.
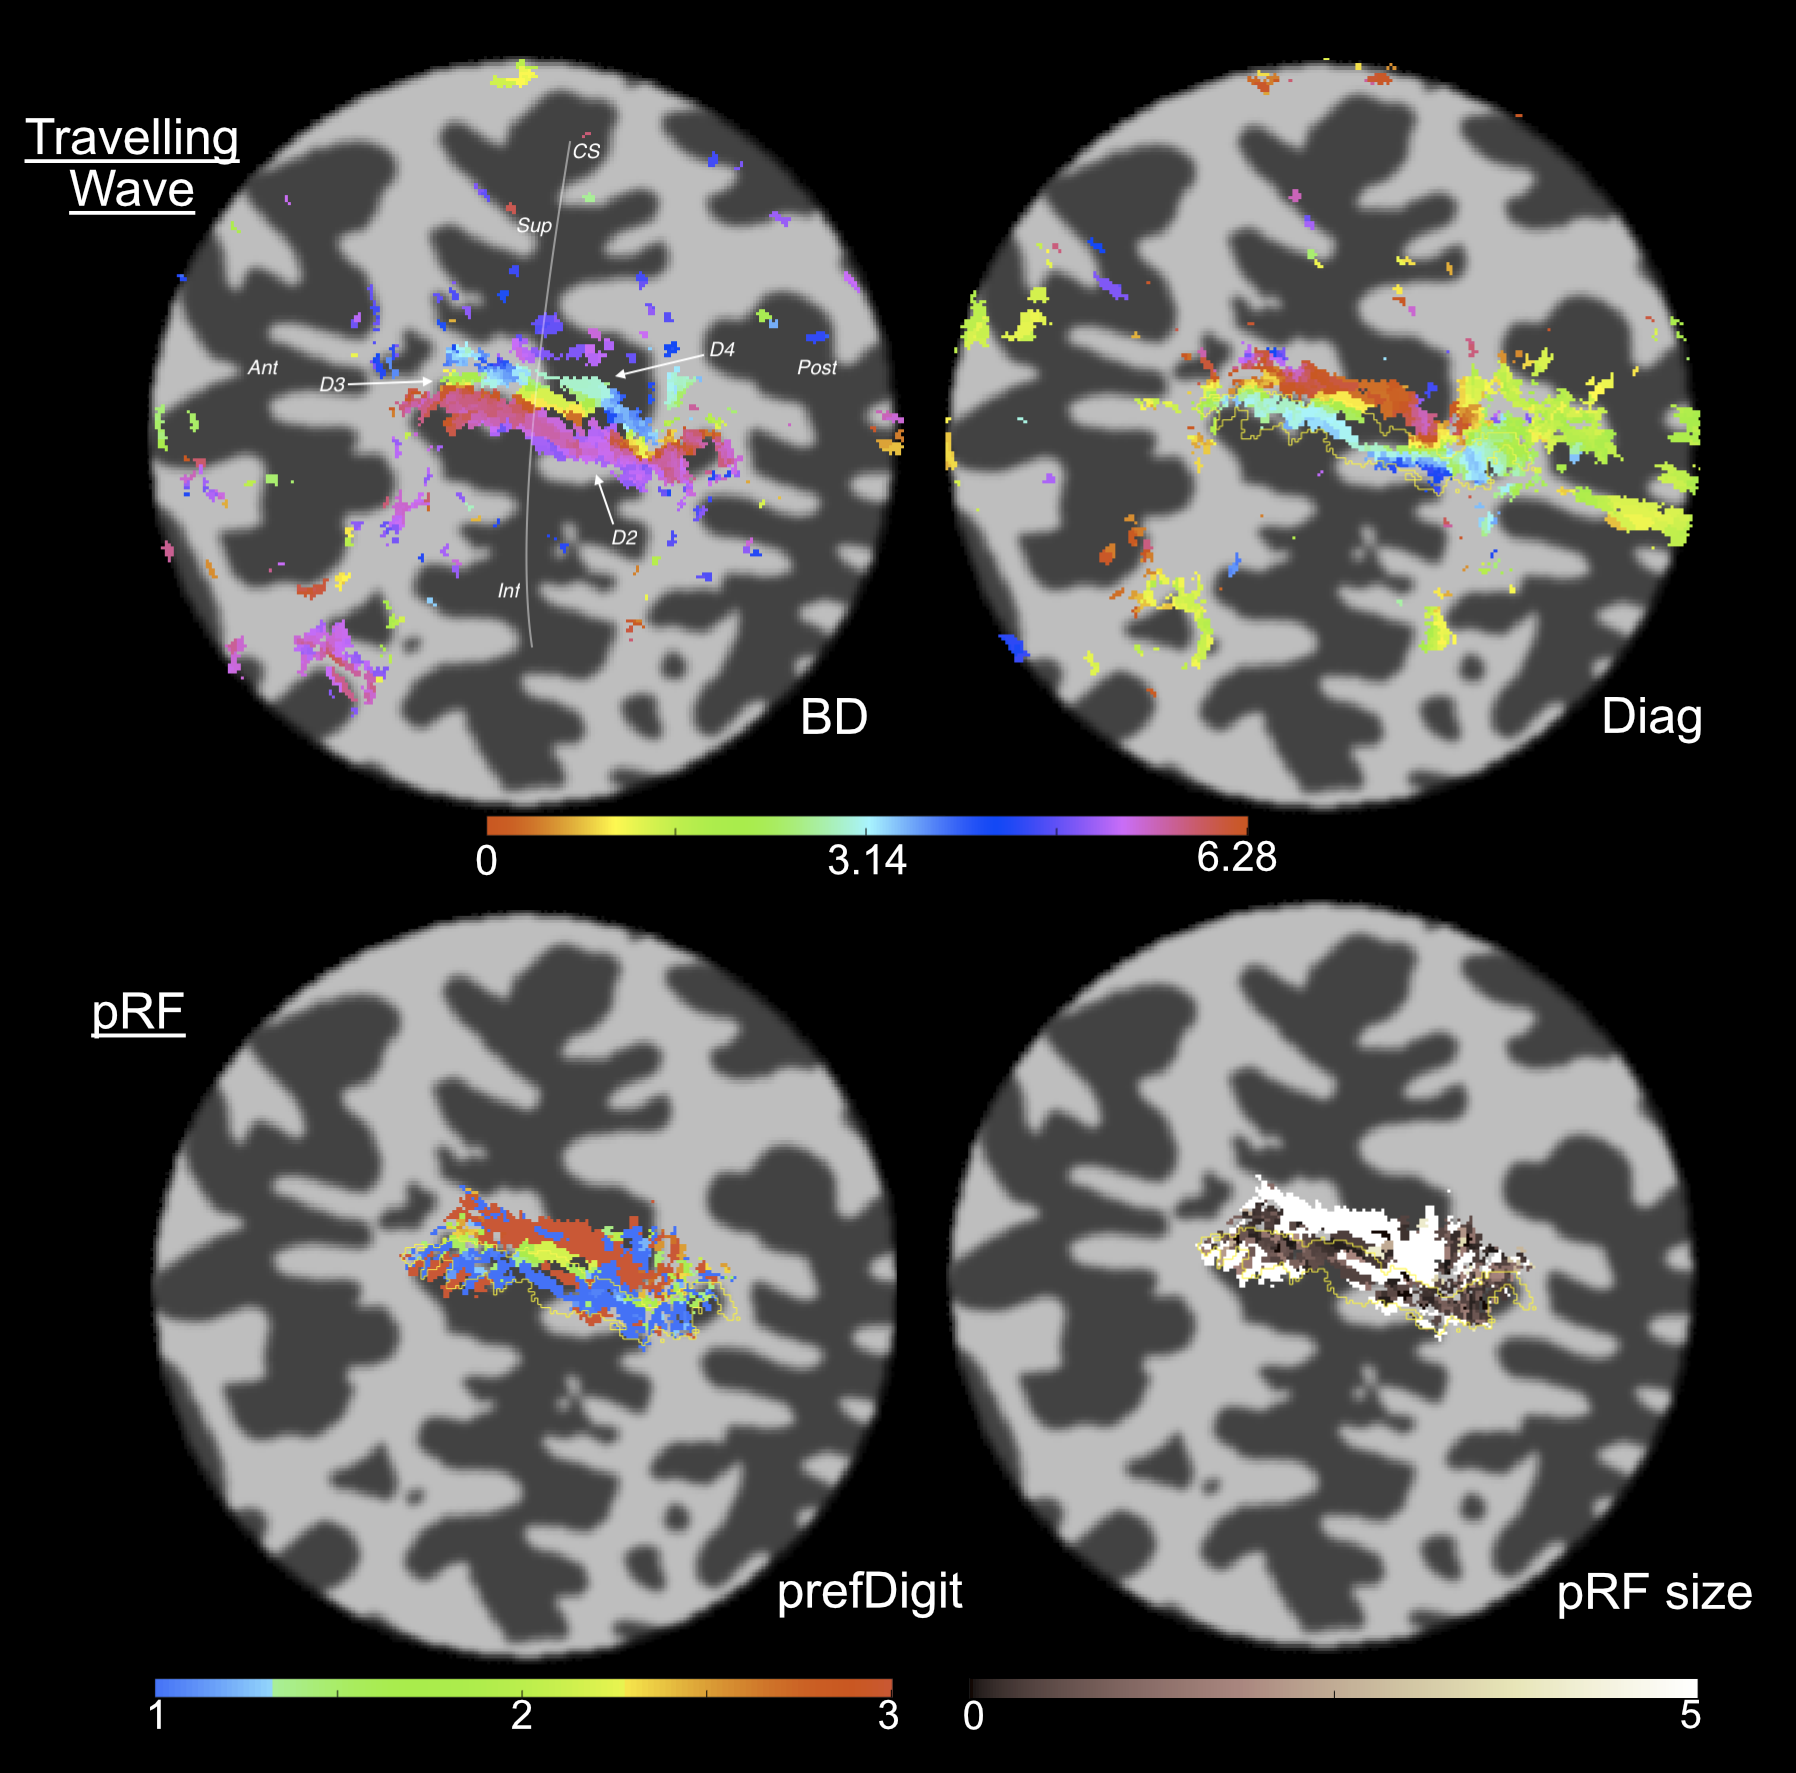
Across datasets, the 1D Gaussian pRF model (Fig.3) provided the best fit to the data (r2 up to 0.65, per voxel). This parametrization of the pRF shape assumes a 1D-Gaussian profile along the proximal-distal axis of each digit. This model provided a good fit to data for BD and WD stimulation, corresponding to the “major” axes of the maps in S1. Somatotopic pRF maps of ‘preferred digit’ and ‘preferred proximal/distal location’ were consistent with TW analysis (Fig.4).
Surprisingly, model fits for diagonal stimulation were poor, suggesting these complex spatial response patterns led to interactions uncaptured by our pRF model (Fig.5). By considering the “diagonal” map as a weighted linear combination of BD and WD maps, residuals between the data and the best fitting least squares estimate can provide information regarding interaction effects.
Discussion
pRF mapping is an increasingly popular fMRI analysis method, particularly in visual cortex11.
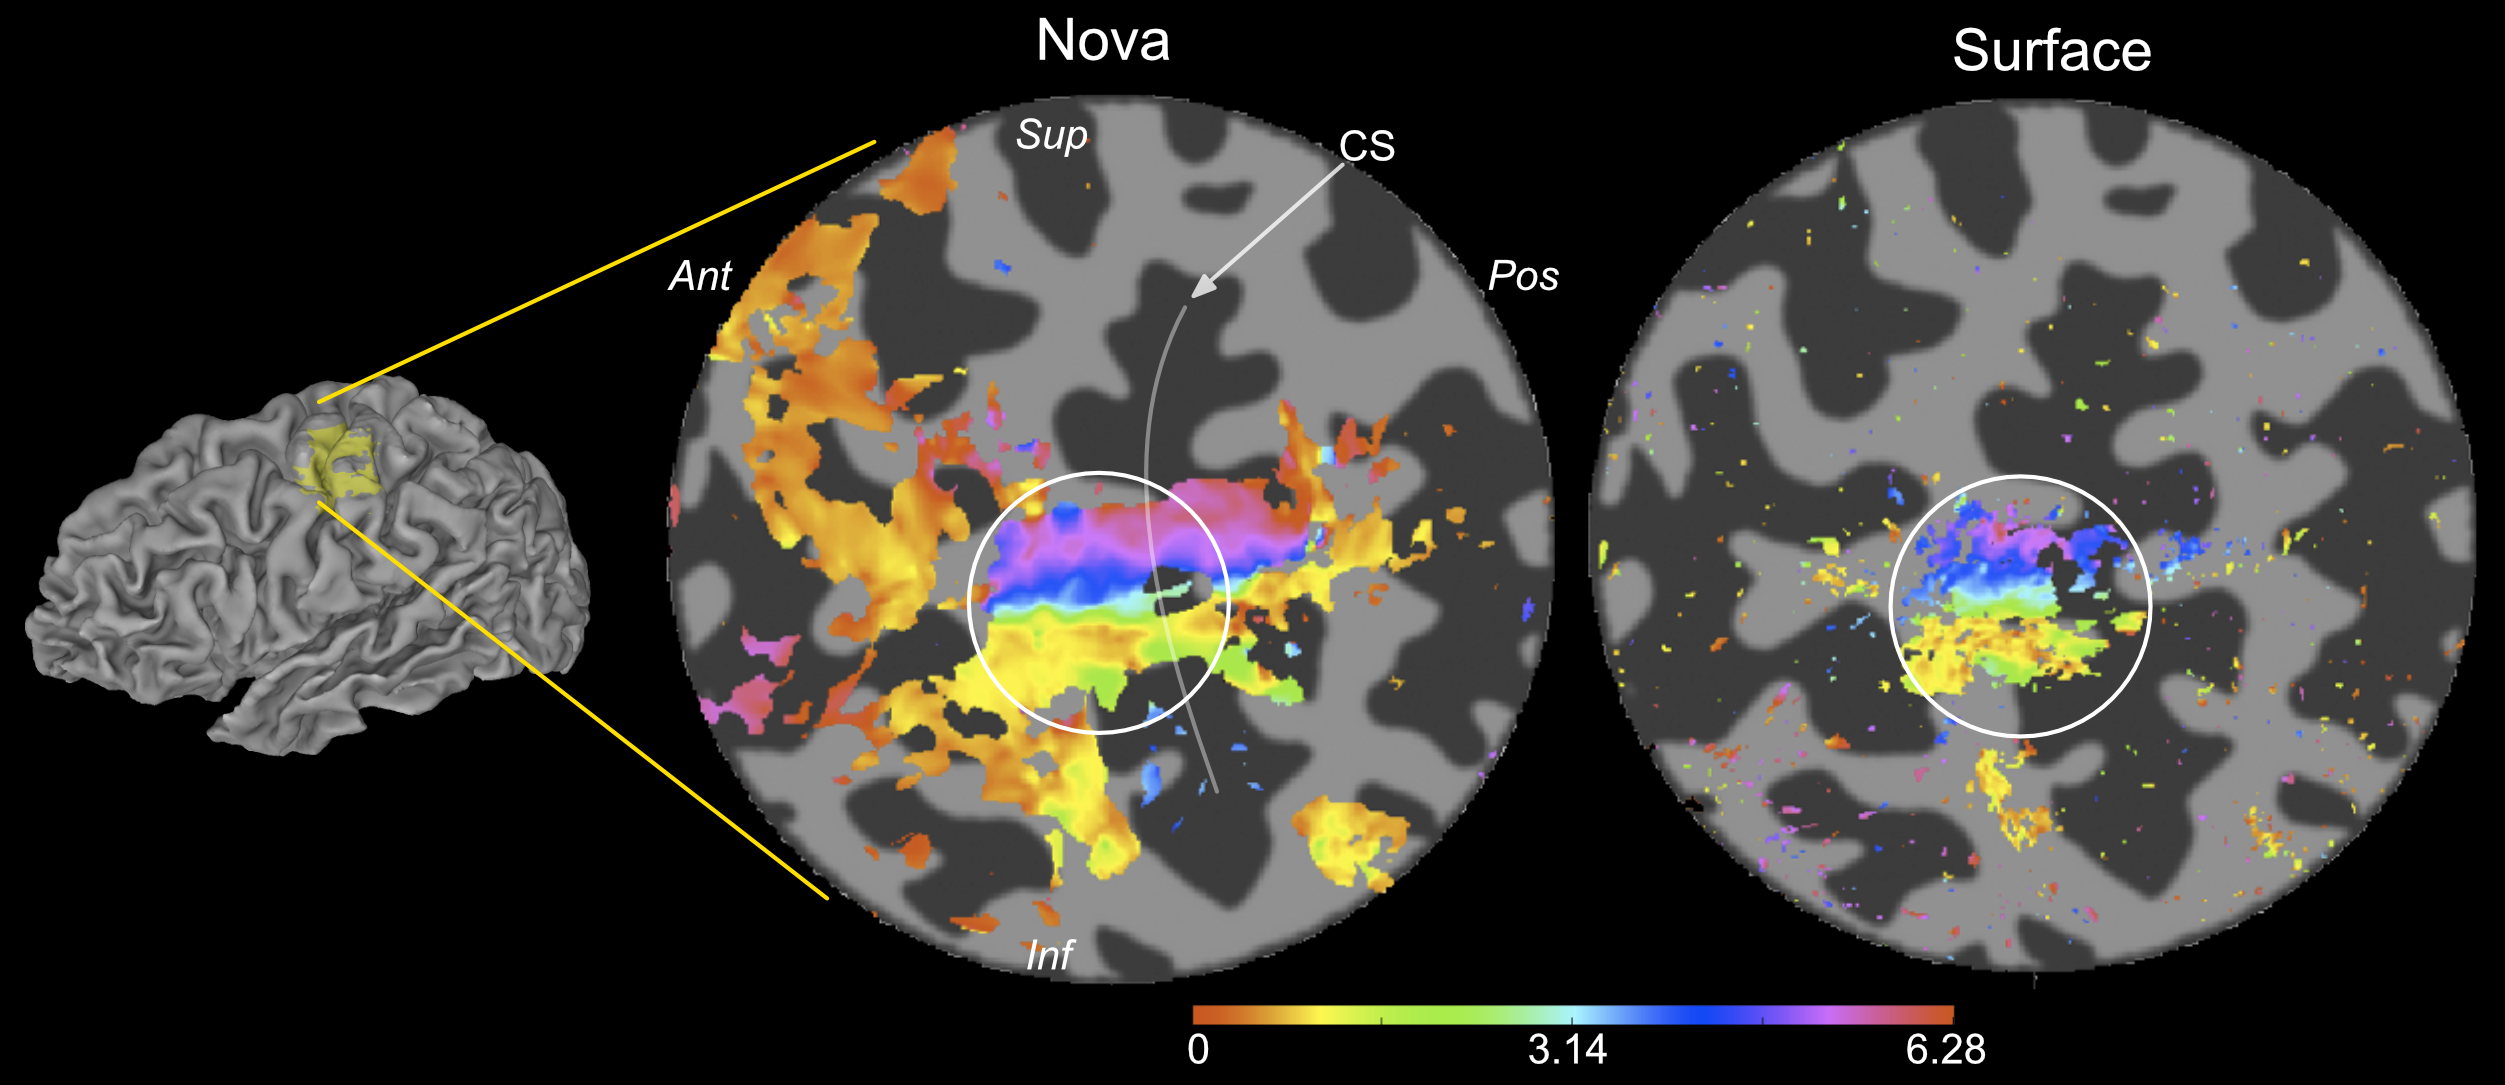
The best fit parameters (minimizing the squared error between a voxel’s timecourse and predicted fMRI timeseries), provide information about neuronal ensembles that contribute to the voxel fMRI response. Here, we show that pRF analysis can be extended to high-resolution S1 data. pRF somatotopic map quality (preferred stimulus location) was comparable to TW (Fourier-based) maps (Fig.4). However, pRF maps provide additional pRF size information. Our results also show that using a surface coil capitalises on higher field strength12,13 by increasing TW map spatial resolution (Fig.2).
We have two challenges: 1) increasing the sampling of sensory space beyond our 3x3 grid and 2) identifying a physiologically relevant pRF model parameterization. We assume that voxel responses are an additive combination of the responses to each stimulation site; the poorly model-fitted diagonal stimulation data suggest that this assumption is violated.
We are now moving to a finer stimulation grid (4x4), and extending the pRF model to account for apparent nonlinear effects, which may be due to interactions in stimuli space, the cortex or across time (trial history).
Conclusion
We show pilot data confirming the pRF method in somatosensory cortex at 7T fMRI, with pRF mapping providing additional information, such as pRF size, compared to TW experiments. The development of software (more complex pRF models) and hardware (finer sampling of sensory space, surface coil) are key steps towards higher quality cortical mapping.Acknowledgements
This work was funded by an MRC grant (MR/M022722/1).References
1. Butterworth, S. et al. Movement Disorders. 2003;18(6):673-682.
2. Stringer, EA, et al. NeuroImage. 2011;54:1012-1020.
3. Martuzzi, R, et al. Human Brain Mapping. 2014;35:213-226.
4. Sanchez-Panchuelo RM, et al. Neuroimage. 2014;93:221-230.
5. Sanchez-Panchuelo RM, et al. J Neurophysiol. 2010;103:2544-2556.
6. Dumoulin S, et al. Neuroimage. 2008;39:647-660.
7. Nelder JA, et al. The Computer Journal. 1965;308-313.
8. Marquardt DW, JSTOR. 1963;11(2):431-441.
9. Dale, AM, et al. NeuroImage. 1999;9:179-194.
10. Fischl B, et al. NeuroImage. 1999;9:195-207.
11. Wandell BA, et al. Brain Mapping: An Encyclopedic Reference. 2015;1:651-659.
12. Yacoub E, et al. Magnetic Resonance in Medicine. 2001;45:588-594.
13. Francis S, et al. Physiol. Meas. 2014;35:R167-R185.
Figures