0249
The global resting-state fMRI signal is associated with opposite changes at subcortical structures regulating arousal.1Biomedical Engineering, Pennsylvania State University, University Park, PA, United States, 2National Institute of Neurological Disorders and Stroke, National Institutes of Health, Bethesda, MD, United States, 3National Institute of Mental Health, National Institues of Health, MD, United States
Synopsis
Spontaneous, large scale fluctuations (LSF) in neocortical fMRI activity may result from arousal variations. To investigate the role of arousal, we examined an fMRI database for local fMRI changes at subcortical arousal-regulating structures associated with widespread fMRI co-activations in the neocortex. We identified three subcortical regions that showed anti-polar signal changes with LSF. These regions, known for promoting wakefulness, included the Nucleus Basalis, the Dorsal Midline Thalamus, and the Substantia Nigra. This finding is further evidence of a putative role of arousal in LSF, and suggest that caution should be exercised when extracting functional connectivity measures from fMRI data.
Introduction
Resting-state fMRI (rsfMRI) has been widely used for mapping functional connectivity of healthy1,2 and diseased brains3. A major confound in rsfMRI is the presence of large scale fluctuations (LSF) that involve most of the neocortex, often called “global signal”, that can interfere with the interpretation of functional specialization4. Several findings point to a role of arousal in LSF, e.g. its increase at transitions into light sleep5 or with hypnotic drugs6,7, and its decrease with caffeine administration8. Recently, SSTs were found to occur at arousal transitions9, and their association with LSF was interpreted as indicating a relationship between LSF and arousal 10. However, no evidence has yet been found to establish a direct link between the global rsfMRI signal and brain arousal. Since arousal is known to be regulated by small nuclei and structures at subcortical regions, including the basal forebrain, hypothalamus, and brain stem, we attempted to relate activity in these regions to LSF .Methods
We used resting-state fMRI data from the 500 subjects release of the human connectome project (HCP), which collected four 15-minute runs data in two sessions on two consecutive days for each subject11. The minimally preprocessed, ICA-FIX denoised data from 469 subjects who completed all four runs of scanning were used for analysis. The fMRI data was smoothed both spatially (FWHM = 2.4 mm) and temporally (0.001–0.1 Hz), and then each voxel’s signal was normalized by subtracting its temporal mean and dividing by its temporal standard deviation. We identified a subgroup of 94 (~20% of 469) subjects whose global signal (GS), i.e., the signal average over all gray matter voxels, showed the largest fluctuation amplitude, and focused the subsequent analysis on this subgroup of subjects. Using a previous approach for extracting co-activation patterns (CAPs) of the brain12, we simply averaged the fMRI volumes at the time points where the GS value is larger than a threshold of 0.2, corresponding to ~ 16.6% time points, and then converted the result to Z-scores by comparing the average to a null distribution constructed from sets of randomly selected time points. In this way, we obtained a CAP at the extreme GS points (GS-CAP).Results
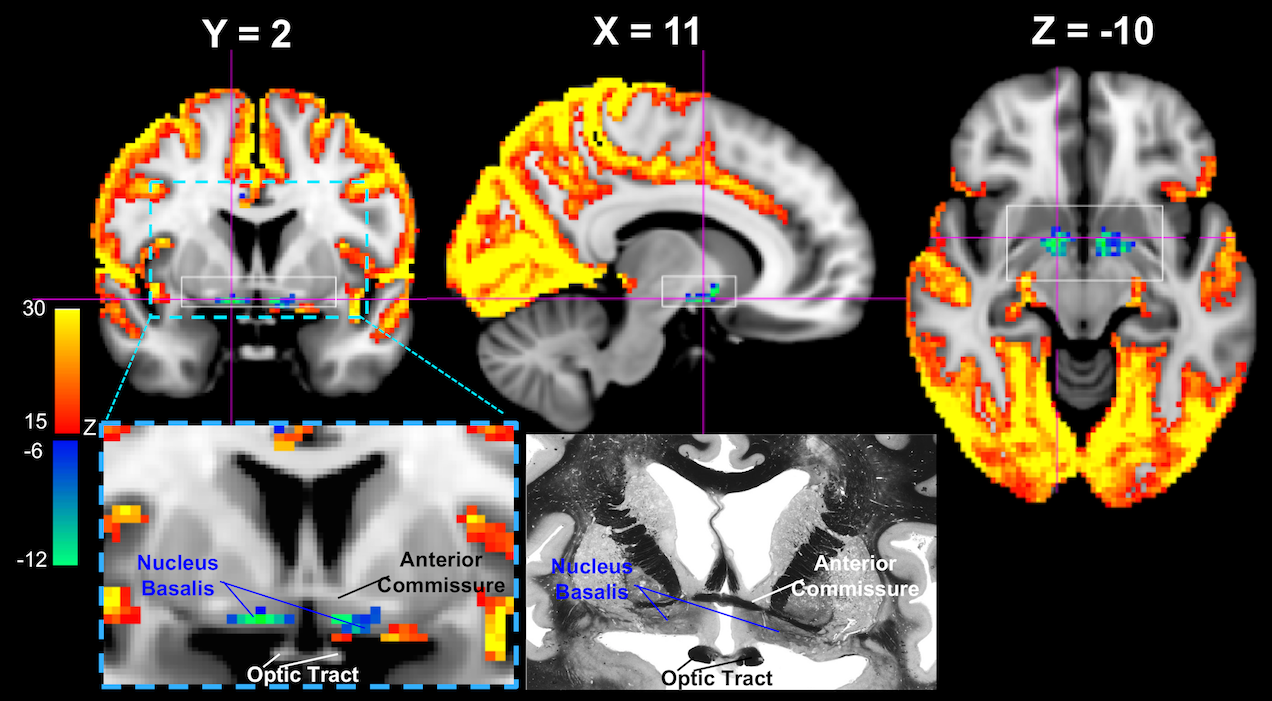
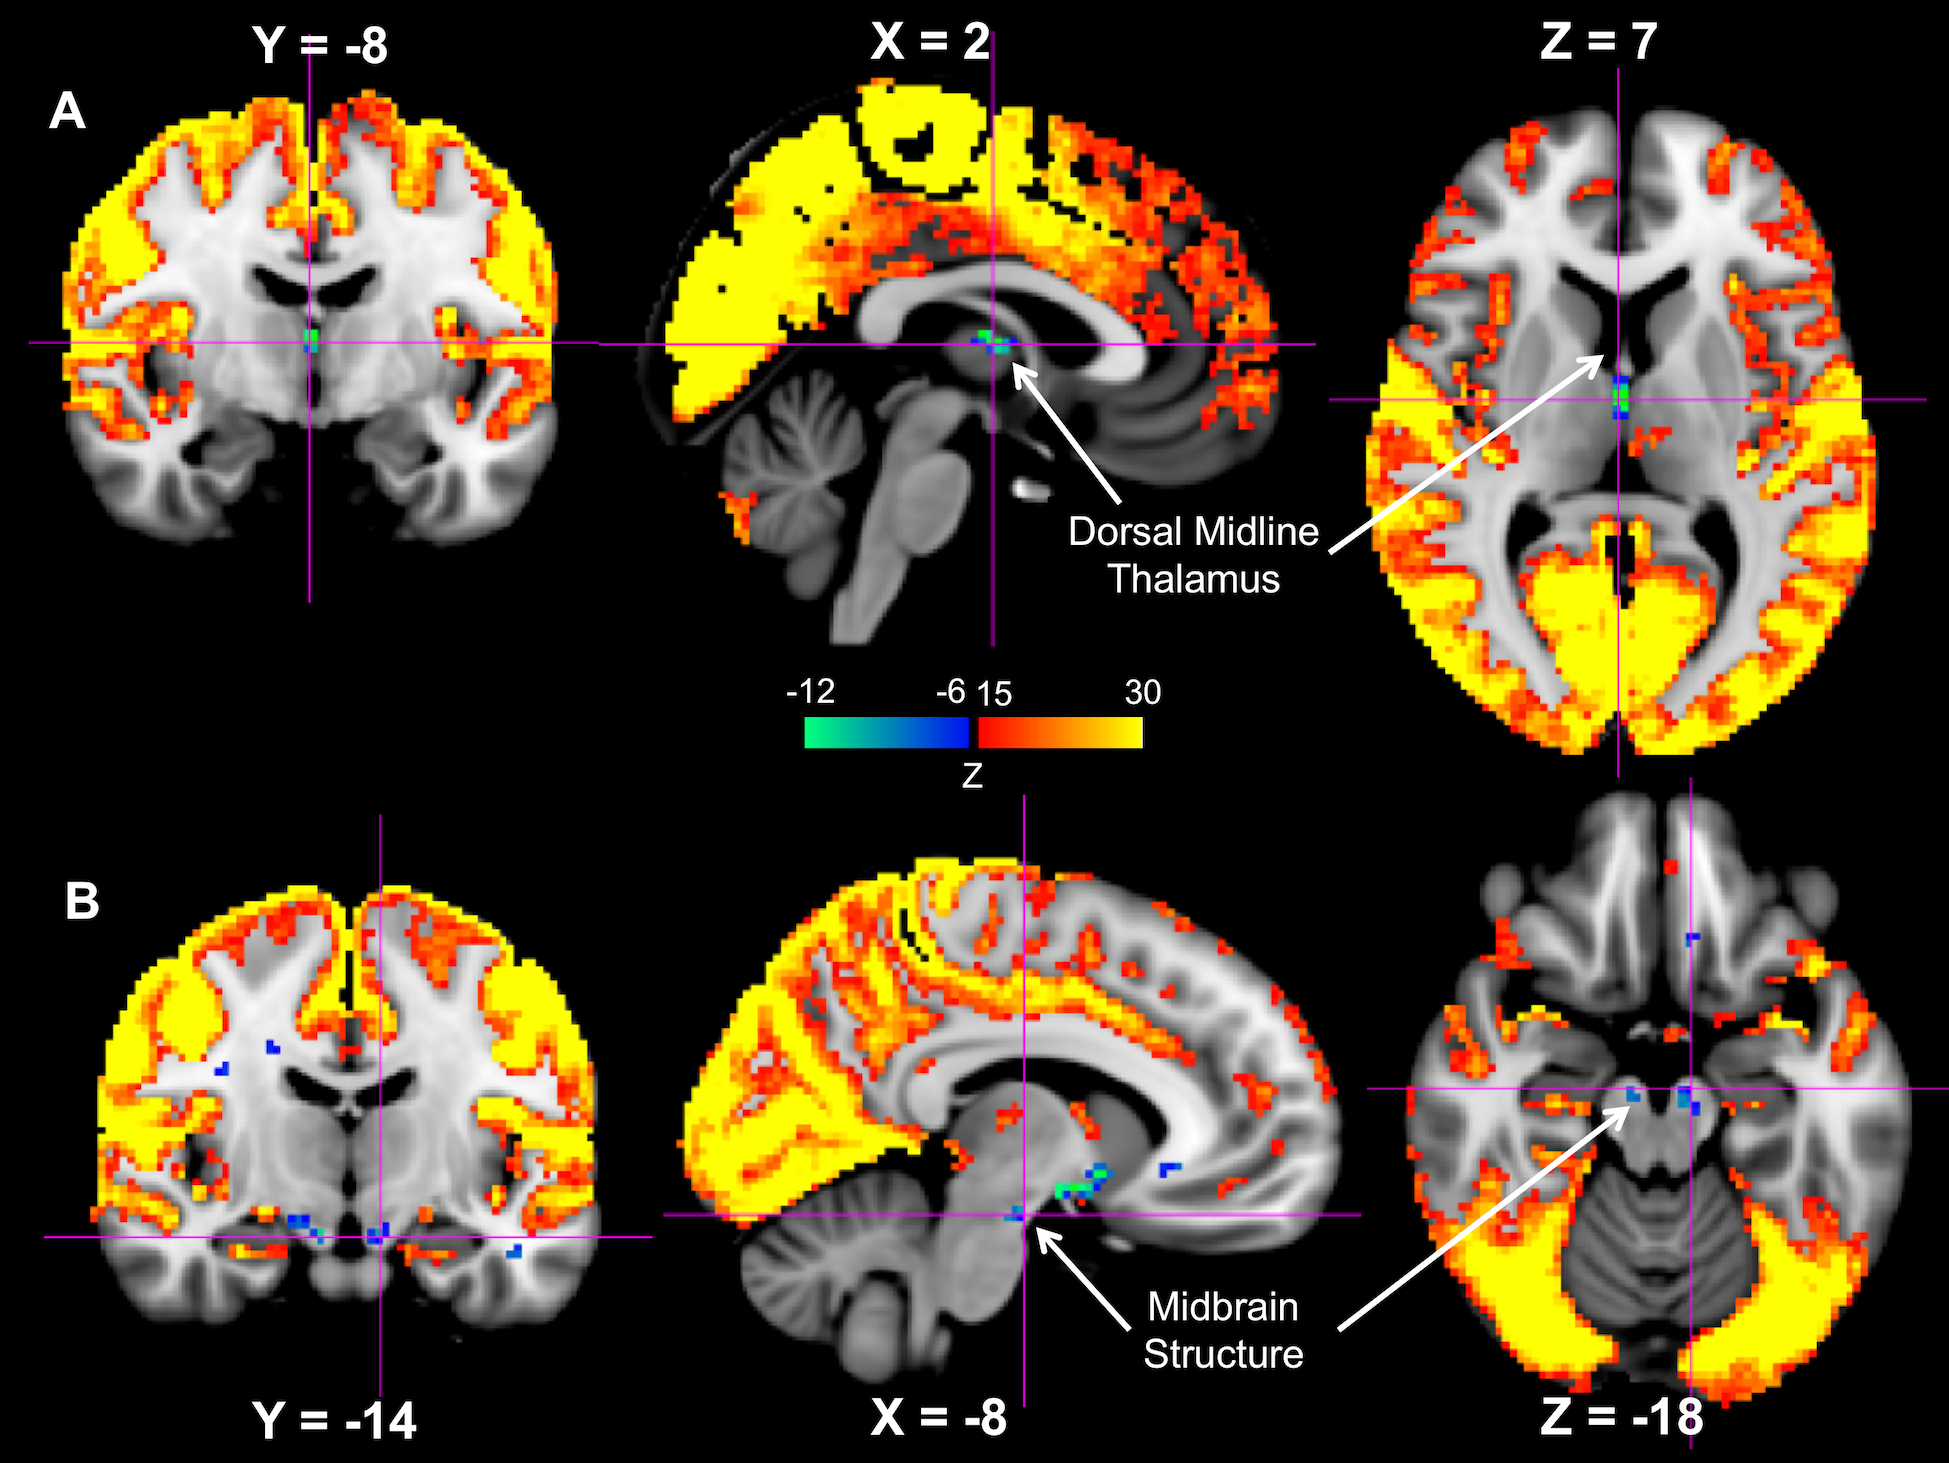
While the majority of the brain shows significant signal increase at the GS-CAP, there are three brain regions showing significant changes in an opposite direction. The largest region is a flat structure situated between the anterior commissure and optic tracts (Figure 1), and its location corresponds well to the anatomical location of the Nucleus Basalis at the Basal Forebrain, based on comparison to a human brain atlas13 as well as to a stereotaxic cytoarchitectonic map of the human basal forebrain14. The signal decrease was also seen at the Dorsal Midline Thalamus (Figure 2A) and a midbrain structure that we tentatively regard as the Substantia Nigra (Figure 2B).Discussion
It has been suggested that LSF is induced by the high-frequency gamma-band (~ 40-100 Hz) activity bursts at the SST, which is in fact associated with emergence of delta waves, a signature of sleep and low vigilance9. Therefore, the subcortical wake-promoting structures are expected to exhibit reduced activity when neocortical activity increases. The finding from this study is consistent with this notion. The Nucleus Basalis of the Basal Forebrain has been established as a key structure of promoting wake and arousal, and a lesion to it can produce large, extensive delta waves15. The dorsal midline thalamus is considered a part of the non-specific arousing system, and the optogenetic stimulation of MT neurons effectuates arousal in naturally sleeping mice16. Similarly, lesions to Substantia Nigra in rats have been shown to affect various aspects of sleep, including a decrease in the latency to the onset of slow wave sleep17.Conclusion
Confined signal reductions were found in subcortical structures that are known to promote wake, at the time when most neocortical brain regions showed their highest level of activity. We infer that arousal plays a substantial role in the generation of LSF.Acknowledgements
This study is supported by internal research funds of the National Institute of Neurological Disorders and Stroke (NINDS) and the NIH Pathway to Independence Award (K99/R00).References
1. Biswal B, Yetkin FZ, Haughton VM, Hyde JS. Functional connectivity in the motor cortex of resting human brain using echo-planar MRI. Magn Reson Med. 1995;34(4):537-541.
2. Fox MD, Raichle ME. Spontaneous fluctuations in brain activity observed with functional magnetic resonance imaging. Nat Rev Neurosci. 2007;8(9):700-711. doi:nrn2201 [pii]\n10.1038/nrn2201.
3. Zhang D, Raichle ME. Disease and the brain’s dark energy. Nat Rev Neurol. 2010;6(1):15-28. doi:nrneurol.2009.198 [pii]10.1038/nrneurol.2009.198.
4. Fox MD, Zhang D, Snyder AZ, Raichle ME. The Global Signal and Observed Anticorrelated Resting State Brain Networks The Global Signal and Observed Anticorrelated Resting State Brain Networks. J Neurophysiol. 2013;101(April 2009):3270-3283. doi:10.1152/jn.90777.2008.
5. Fukunaga M, Horovitz SG, van Gelderen P, et al. Large-amplitude, spatially correlated fluctuations in BOLD fMRI signals during extended rest and early sleep stages. Magn Reson Imaging. 2006;24(8):979-992. doi:10.1016/j.mri.2006.04.018.
6. Kiviniemi VJ, Haanpää H, Kantola JH, et al. Midazolam sedation increases fluctuation and synchrony of the resting brain BOLD signal. Magn Reson Imaging. 2005;23(4):531-537. doi:10.1016/j.mri.2005.02.009.
7. Licata SC, Nickerson LD, Lowen SB, Trksak GH, MacLean RR, Lukas SE. The hypnotic zolpidem increases the synchrony of BOLD signal fluctuations in widespread brain networks during a resting paradigm. Neuroimage. 2013;70:211-222. doi:10.1016/j.neuroimage.2012.12.055.
8. Wong CW, Olafsson V, Tal O, Liu TT. The amplitude of the resting-state fMRI global signal is related to EEG vigilance measures. Neuroimage. 2013;83:983-990. doi:10.1016/j.neuroimage.2013.07.057.
9. Liu X, Yanagawa T, Leopold DA, et al. Arousal transitions in sleep, wakefulness, and anesthesia are characterized by an orderly sequence of cortical events. Neuroimage. 2015;116:222-231. doi:10.1016/j.neuroimage.2015.04.003.
10. Liu X, Yanagawa T, Leopold DA, et al. A Spontaneous Neurophysiological Event Underlying Spontaneous fMRI Signal Changes. Proc Organ Hum Brain Mapp 2015 Annu Meet Hawaii, USA. 2015;7439:7439.
11. Van Essen DC, Smith SM, Barch DM, Behrens TE, Yacoub E, Ugurbil K. The WU-Minn Human Connectome Project: an overview. Neuroimage. 2013;80:62-79. doi:10.1016/j.neuroimage.2013.05.041.
12. Liu X, Duyn JH. Time-Varying Functional Network Information Extracted from Brief Instances of Spontaneous Brain Activity. Proc Natl Acad Sci U S A. 2013;110(11):4392-4397. doi:10.1073/pnas.1216856110.
13. Haines DE. Neuroanatomy: An Atlas of Structures, Sections, and Systems . Lippincott Williams Wilkins; 5th Ed. 2000.
14. Zaborszky L, Hoemke L, Mohlberg H, Schleicher A, Amunts K, Zilles K. Stereotaxic probabilistic maps of the magnocellular cell groups in human basal forebrain. Neuroimage. 2008;42(3):1127-1141. doi:10.1016/j.neuroimage.2008.05.055.
15. Buzsaki G, Bickford RG, Ponomareff G, Thal LJ, Mandel R, Gage FH. Nucleus basalis and thalamic control of neocortical activity in the freely moving rat. J Neurosci. 1988;8(11):4007-4026.
16. Komlosi G, Porrero C, Bartho P, et al. Quantitative control of arousal via the midline thalamic nuclei. Proc Soc Neurosci 2015 Annu Meet Chicago, IL, USA. 2015;(167.13):V4.
17. Lima MMS, Andersen ML, Reksidler AB, Vital MABF, Tufik S. The role of the substantia nigra pars compacta in regulating sleep patterns in rats. PLoS One. 2007;2(6):1-7. doi:10.1371/journal.pone.0000513.
Figures