0248
EPI-signal fluctuations at the cardiac frequency: A tissue-specific quantification of inflow, displacement and potential oxygenation effects over the cardiac cycle.1FMRIB Centre, Nuffield Department of Clinical Neurosciences, Oxford University, Oxford, United Kingdom
Synopsis
The impact and transmission mechanisms of the cardiac arterial pressure wave into brain tissue are not fully understood. It is hypothesised that age-related arterial stiffening and increased CBF pulsatility leads to propagation of the arterial wave further down the vascular tree causing tissue damage. Here we quantify inflow ($$$S_0$$$) and displacement/oxygenation ($$$T_2^*$$$) induced fluctuations of the EPI-signal at the cardiac frequency. We relate the EPI-signal phase at the cardiac frequency to the fluctuations of $$$S_0$$$ and $$$T_2^*$$$ over the cardiac cycle in the arteries, veins and tissue.
Purpose
Confined by the skull, the brain transfers the cardiac arterial pressure wave into local changes in cerebral blood flow (CBF), volume and tissue displacement. The transmission mechanisms of cardiac pulsatility into different tissue compartments are subject to debate1. High-temporal resolution EPI (TR<400ms) resolves signal fluctuations at the cardiac frequency. The purpose of this study is a characterisation of the mechanisms underlying these signal fluctuations using
1. Single-echo multiband EPI2 to compare the signal phase distributions at the cardiac frequency in different tissues.
2. Double-echo multiband EPI to assess the contribution of inflow, quantified by $$$S_0$$$, as well as movement and potential oxygenation changes, quantified by $$$T_2^*$$$.
This approach offers a means to study tissue-specific cardiac resistance that is affected by age-related increases in arterial stiffness and CBF pulsatility3,4.
Methods and Analysis
8 healthy volunteers (age: 23-34) were scanned on a 7T scanner (Siemens, Magnetom, Germany) using a 32-channel head coil. The cardiac trigger was acquired during scanning via pulse-oximetry (BioPac, USA).
Acquisition: single-echo EPI : TR/TE = 334/26ms, 2x2x2mm3 resolution, 36 slices, multiband=6, BW=1852Hz/px, FA=33º, 2200 volumes. double-echo EPI: TR/TE1/TE2 = 405/21/52ms, 2x2x2mm3 resolution, 15 slices, multiband=3, FA=90º, 500 volumes. A T1-weighted scan (T1-MPRAGE, 0.7x0.7x0.7mm3) and a susceptibility-weighted scan (SWI, 0.5x0.5x2mm3) were also acquired. Post-processing involved registration and distortion and motion correction using FSL-FEAT5. Grey, white matter and CSF masks were created from the T1 segmentation. The bright signal of arterial blood on 7T T1-MPRAGE scans6 served to create arterial masks. Venous masks were derived from the SWI.
1.Single-echo data: cardiac phase distributions
The cardiac frequency $$$f_{card}$$$ was chosen as the component with the maximum power amplitude in the external pulse-ox spectrum. We Fourier-transformed the single-echo timecourses $$$X(t)$$$ into the frequency domain $$$\tilde{X}(f)$$$. The cardiac phase at voxel $$$i$$$ versus reference voxel $$$r$$$ was then calculated as $$\phi_i(f_{card}) = arctan\Bigg[\frac{\tilde{X_i}(f_{card})}{\tilde{X_r}(f_{card})}\Bigg] + \Delta \phi_{i,r}$$ with $$$\Delta \phi_{i,r}$$$ being the slice-timing phase offset. Phases were shifted such that the predominant phase in the arterial mask was aligned to $$$-\pi/2$$$ (see Fig.1) in every subject. Voxels with non-significant cardiac fluctuations were excluded, based on a regression of each voxel's spectrum against the pulse-ox cardiac spectrum, rejecting at p>0.05.
2. Double-echo data: cardiac $$$S_0$$$ and $$$T_2^*$$$ pulsatility
Each peak-to-peak period in the subject's cardiac cycle (pulse-ox data) was binned into a cardiac unit period of 10 equidistant bins $$$\tau_{card,j}=1,2,\dots,10$$$. The EPI-signal at each point $$$j$$$ is$$S(\tau_{card,j}) =S_0(\tau_{card,j})\cdot e^{-TE/T_2^*(\tau_{card,j})}$$ $$\textrm{linearised:}\quad \Rightarrow ln\big[S(\tau_{card,j}\big] = ln\big[S_0(\tau_{card,j})\big]-\frac{TE}{T_2^*(\tau_{card,j})}.\qquad (1)$$ $$$T_2^*$$$ and $$$S_0$$$ values were fitted from the double-echo data according to Eq.(1) and sorted into their acquisition bin. Values were then averaged to create $$$S_0(\tau_{card,j})$$$ and $$$T_2^*(\tau_{card,j})$$$ fluctuation maps. We defined a pulsatility measure as the minimum-to-maximum percentage fluctuation around the mean: $$S_{0,p} = \frac{max\big[S_0(\tau_{card,j})\big]-min\big[S_0(\tau_{card,j})\big]}{mean[S_0(\tau_{card,j})]}$$ and for $$$T_{2,p}^*$$$ respectively, see Fig.2b.
Results
In Fig.1 a dominant arterial phase is present in all tissue types, especially near arteries. The phase distribution disperses from the arterial towards the venous side. There is a bi-phasal evolution, with a second peak in the distribution around $$$+\pi/2$$$. Fig.2 and the animation in Fig.3 show how different phases are associated with different $$$S_0$$$ and $$$T_2^*$$$ fluctuations in grey matter. Tissue-specific $$$S_{0,p}$$$ and $$$T_{2,p}^*$$$ pulsatilities for both main peaks are displayed in Table 1. $$$S_{0,p}$$$ pulsatility is maximised at the dominant arterial peak and is highest in the arteries ($$$S_{0,p}=5\%$$$) and decreases through tissue (grey matter:$$$S_{0,p}=0.93\%$$$, white matter:$$$S_{0,p}=0.24\%$$$, veins:$$$S_{0,p}=1.2\%$$$). In grey matter and CSF $$$S_{0,p}$$$ decreases around the second phase peak, where $$$T_2^*$$$ fluctuations are maximised. The CSF voxels in this phase range are mainly localised in the ventricles (slow flow), whereas the grey matter voxels in this phase range are distributed throughout the brain. Further, we found that maximal $$$T_2^*$$$ variation occurs asynchronously with maximal $$$S_0$$$ variation (lag of $$$\pi$$$) at the dominant peak in the arterial mask and CSF, but not for grey matter where the lag is $$$0.8\pi$$$ (Fig.2b).
Conclusion and Discussion
A bi-phasal signal distribution at the cardiac frequency is observed with a dominant peak originating in the arteries, apparently associated with maximised inflow $$$S_0$$$ pulsatility. A phase dispersion and inflow pulsatility reduction follows though the vascular bed (arterial -> venous). Interestingly, $$$T_2^*$$$ pulsatility in grey matter is maximised at the second phase peak. The sources of $$$T_2^*$$$ changes could be inter-voxel tissue displacement (vessel contraction/expansion) or oxygenation changes. The latter appears unlikely, but we did not observe a similar $$$T_2^*$$$ behaviour in white matter (although white matter is less vascularised) and the $$$0.8\pi$$$ lag between maximal $$$T_2^*$$$ and $$$S_0$$$ variability, contrary to the $$$\pi$$$ lag in arteries and CSF, hints at a more complex effect than pure displacement.
Acknowledgements
This work was supported by the Initial Training Network, HiMR, funded by the FP7 Marie Curie Actions of the European Commission (FP7-PEOPLE-2012-ITN-316716).
References
[1] Wagshul M, Eide P, Madsen J. The pulsating brain: A review of experimental and clinical studies of intracranial pulsatility. Fluids and barriers of the CNS. 2011;8(1):5-29.
[2] Feinberg D, Setsompop K, Ultra-fast MRI of the human brain with simultaneous multi-slice imaging. Journal of Magnetic Resonance. 2013; 229:90-100.
[3] Tarumi T,et al., Cerebral hemodynamics in normal aging: central artery stiffness, wave reflection, and pressure pulsatility. Journal of Cerebral Blood Flow & Metabolism. 2014; 34(6):971-978.
[4] Robertson A, Tessmer C, Hughson R. Association between arterial stiffness and cerebrovascular resistance in the elderly. Journal of Human Hypertension. 2010;24(3):190-196.
[5] Smith S et al., Advances in functional and structural image analysis and implementation as FSL. NeuroImage. 2004;23(1):208-219
[6] Grinstead J, Rooney W, Laub G. The Origins of Bright Blood MPRAGE at 7 Tesla and a Simultaneous Method for T1 Imaging and Non-Contrast MRA. Proceedings of the ISMRM. 2010; #1429.
Figures
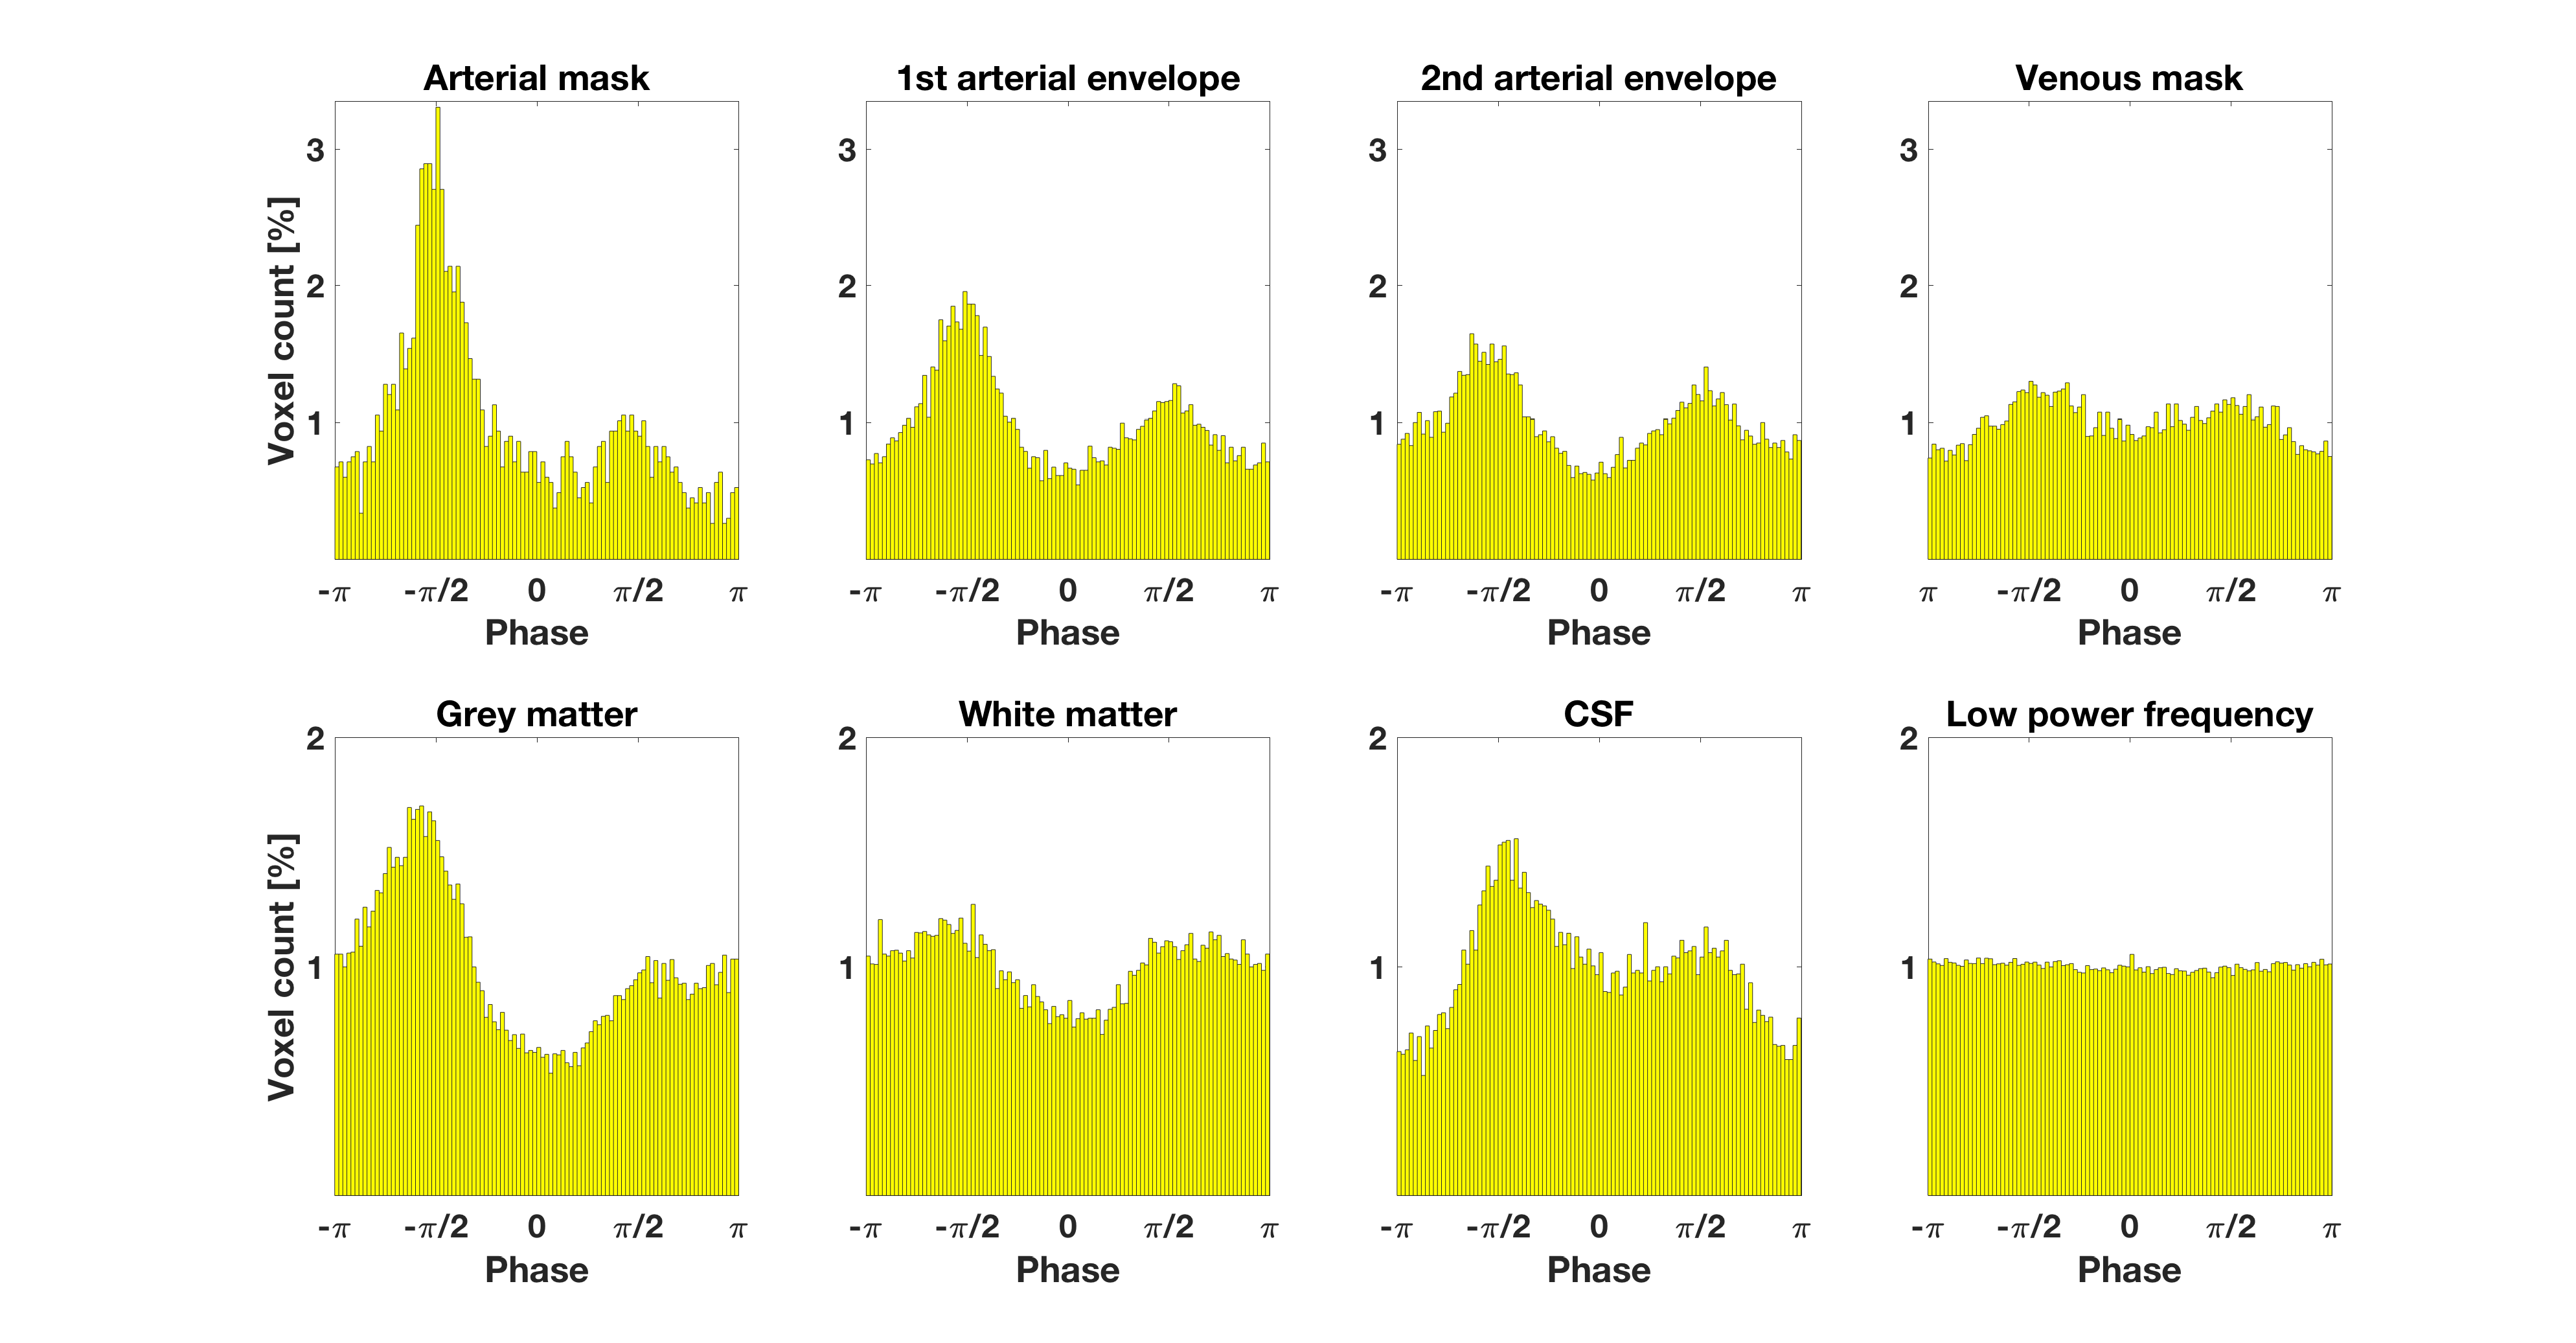
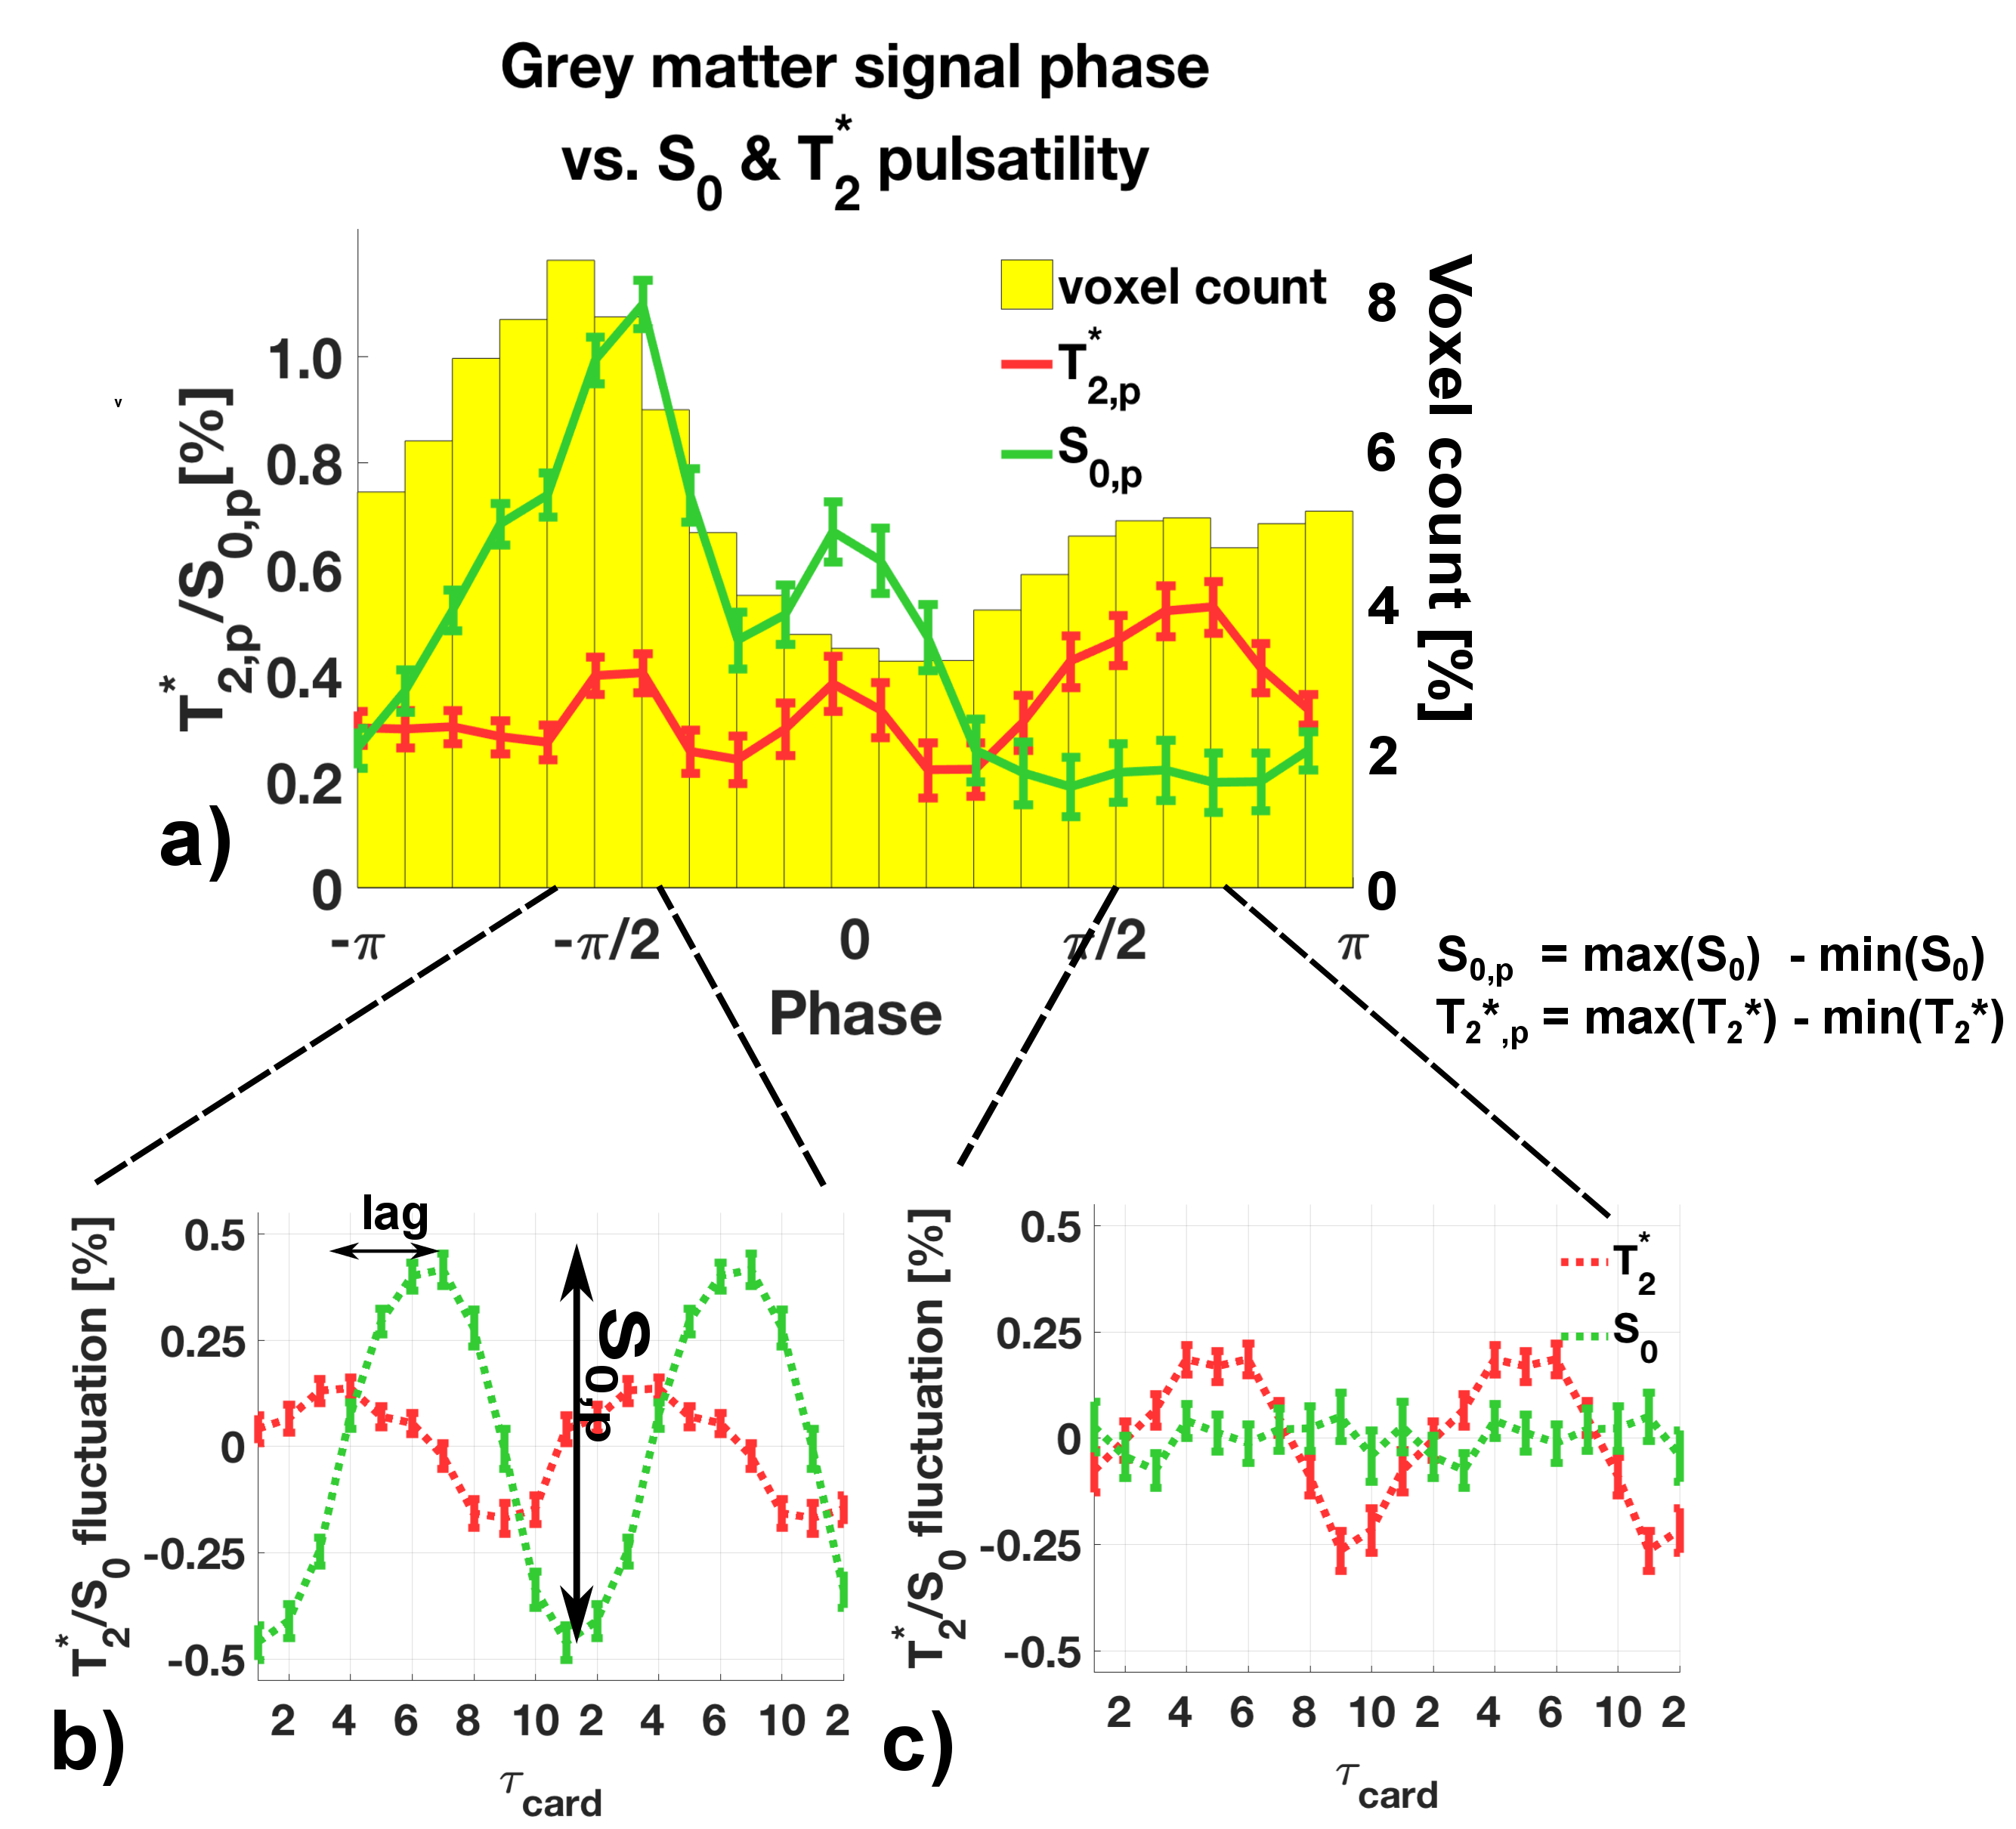
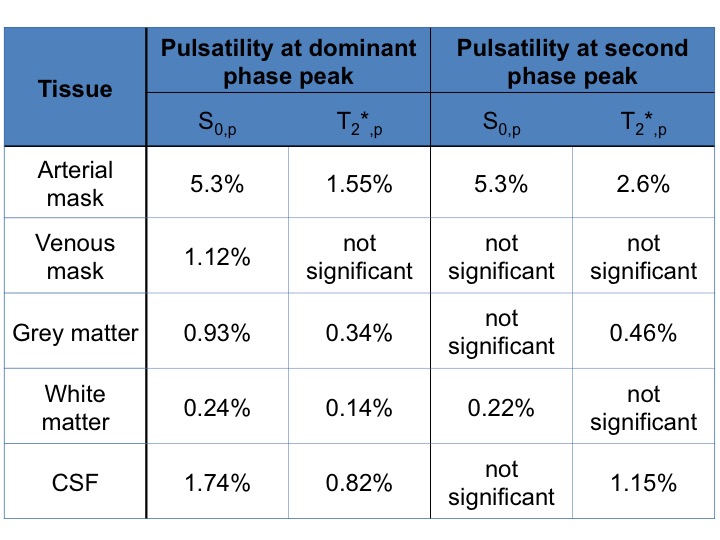
Table 1: $$$S_{0,p}$$$ and $$$T_{2,p}^*$$$ pulsatility (percentage fluctuation range around the mean). Values are given for the dominant phase peak and the second peak ($$$\pm 0.2 \pi$$$) as illustrated in Figure 2b) and c). We decided to judge a pulsatility value as 'significant' if the value was five times larger than the standard error of the mean (see error bars in Figure 2).