0247
CEST fMRI at ultra-high magnetic field1NeuroSpin, Commisariat à l'Energie Atomique et aux Energies Alternatives, Gif-sur-Yvette, France, 2Department of Chemical Physics, Weizmann Institute of Science, Rehovot, Israel
Synopsis
BOLD indirectly measures brain activity based on neurovascular coupling, a reporter which is naturally poor in both its spatial and temporal resolutions. Emerging methods involving spectroscopy (fMRS) and diffusion fMRI suggest that metabolic and structural modifications are taking place in the activated cells. In this paper, we introduce Chemical Exchange Saturation Transfer (CEST)-weighted fMRI as a new method to explore changes in rat brain activation at 17.2T. Monte Carlo simulations were performed to optimize the acquisition and processing methods. Experimentally, CEST-weighted fMRI activation maps showed negative contrast at +1.2ppm most likely originating from changes in the glucose metabolism.
Purpose
BOLD (Blood Oxygenation Level Dependent) functional imaging (fMRI) is one of the keystones of modern neuroimaging.1 BOLD indirectly measures brain activity based on neurovascular coupling, a reporter which is naturally poor in both its spatial and temporal resolutions. Emerging methods involving spectroscopy (fMRS) are opening alternative ways of studying neuronal activation by detecting changes in metabolism2 –related for example to glucose3,4,5 or glutamate uptake.6 Another functional reporter arises from diffusion fMRI, which successfully measured changes in apparent diffusion coefficients during brain activation,7 suggesting that structural modifications are taking place in the activated cells.8 These metabolic and morphological changes are also likely to impact the chemical exchanges between bulk water protons and protons present in various proteins, peptides and metabolites. In this paper, we introduce Chemical Exchange Saturation Transfer (CEST)-weighted fMRI as a new method to explore changes in rat brain activation at 17.2T.Method
Animal preparation. Male Spragues-Dawley rats (250-300g) were anesthetized using medetomidine with an initial dose of 51μg/kg followed by a subcutaneous infusion of 102μg/kg/h. Electric stimuli were delivered to rat forepaws using a Harvard isolated pulse stimulator (pulse duration 0.3ms, frequency 10Hz, current intensity of 2mA). Studies used a block-design paradigm consisting of 10 blocks (30s rest, 30s activation), and alternation between left and right forepaw stimulation in consecutive fMRI acquisitions.
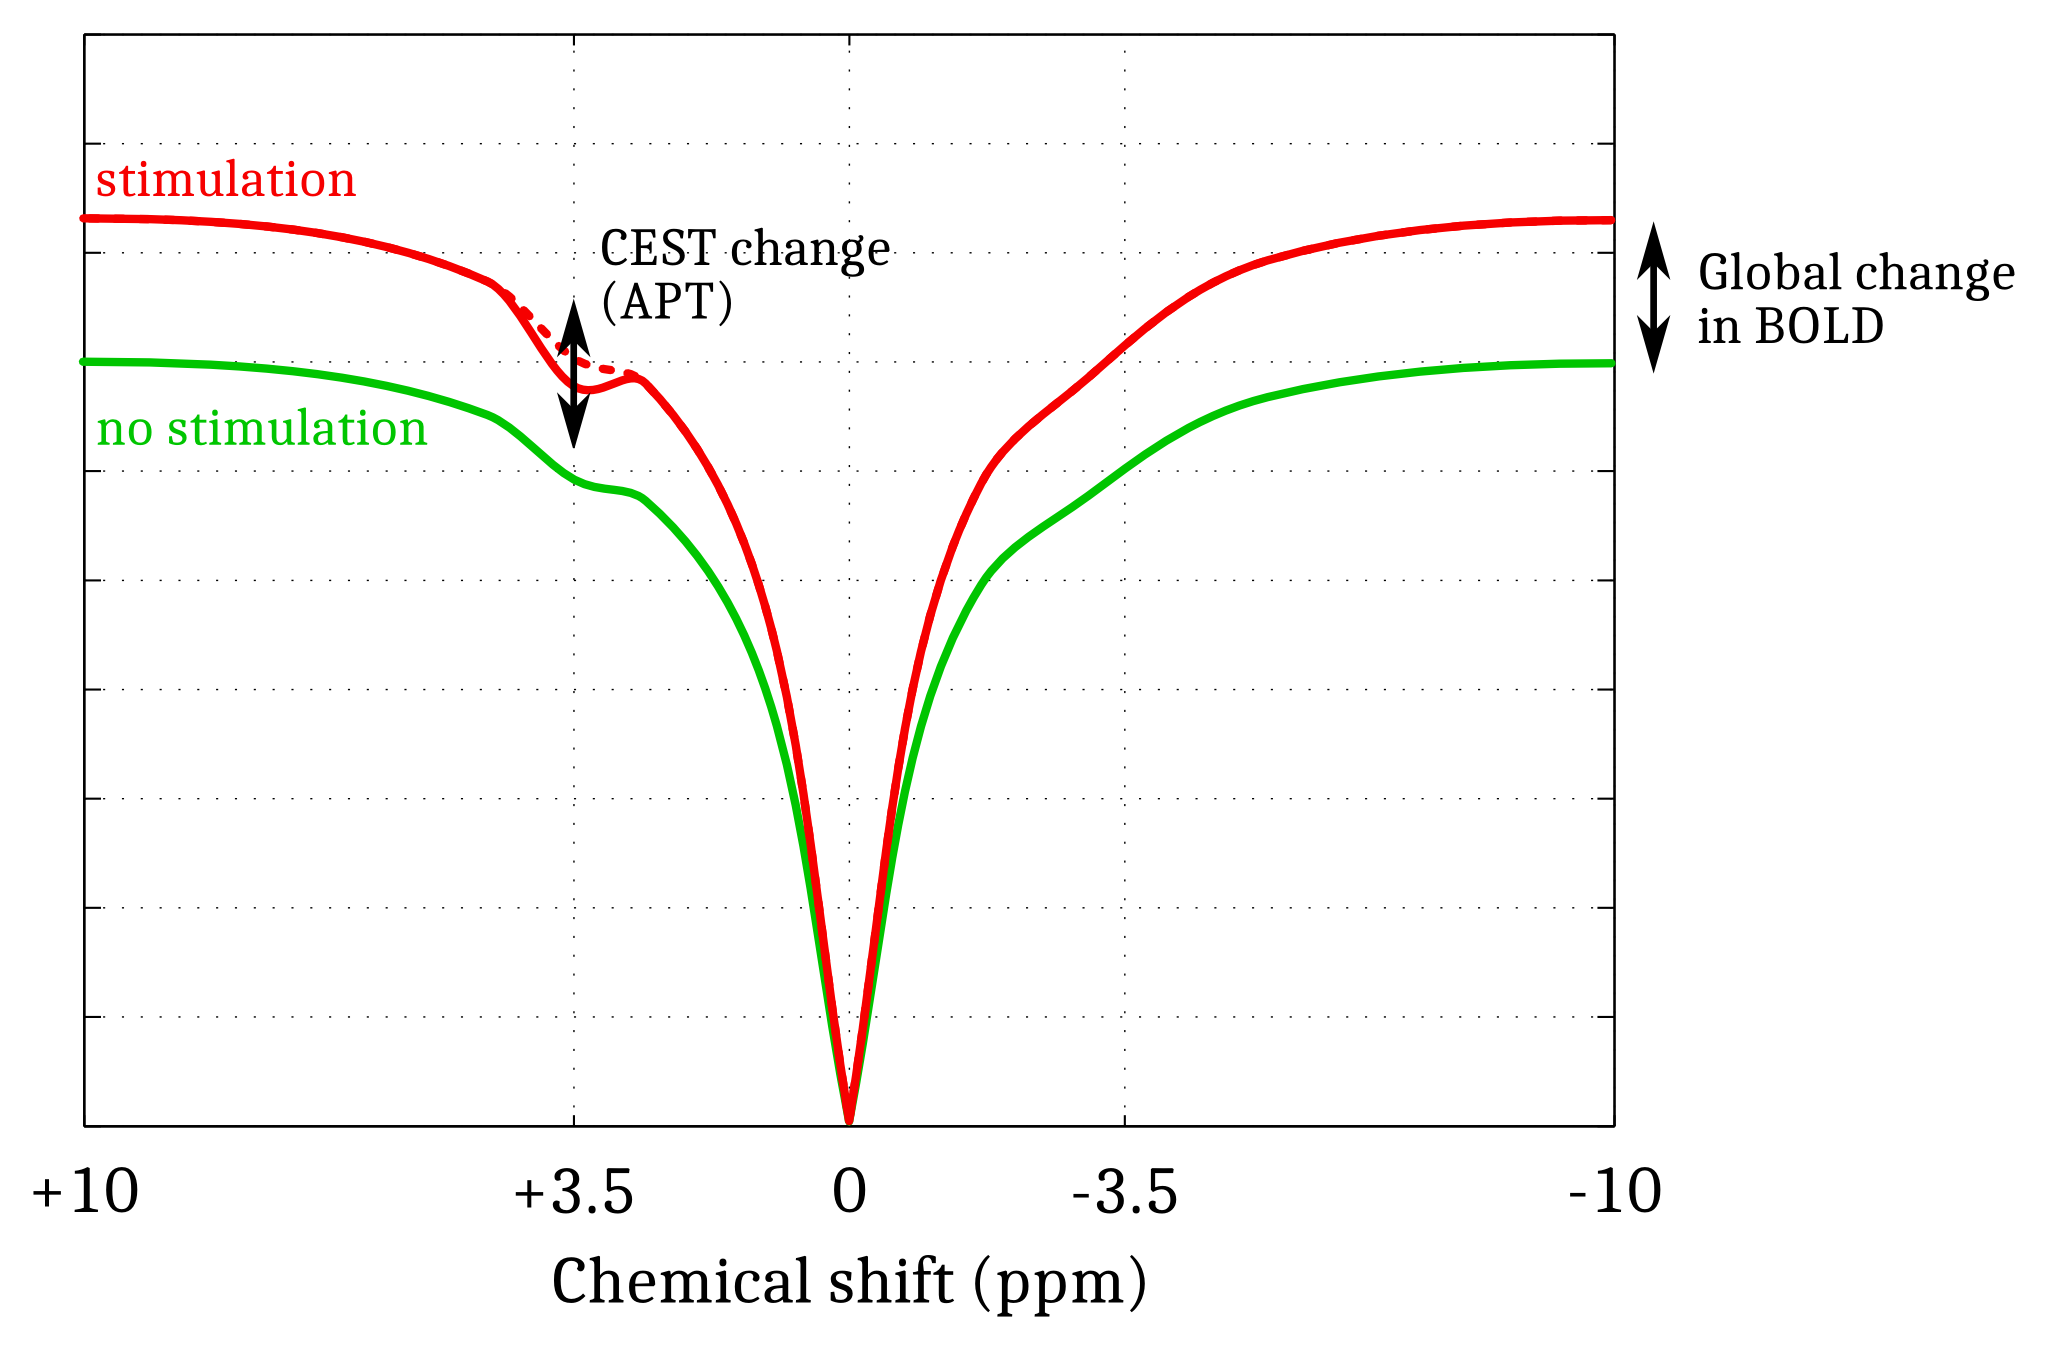
Simulations. A Monte Carlo study was performed to optimize the CEST-fMRI method. 50000 realizations of simulated CEST-fMRI signals –based on previously acquired in vivo CEST-MRI data– were generated for different levels of a Gaussian distributed noise, using a broadband +1 to +6% signal change mimicking the BOLD effect and a -3 to +3% signal change applied locally at +3.5ppm mimicking the Amide Proton Transfer (APT) effect (Fig.1). Each signal was quantified by mathematically combining the signal intensities at -3.5, +3.5 and +10ppm, in order to determine which strategy allowed a robust estimation of the change in APT while compensating unwanted effects such as BOLD, Magnetization Transfer (MT) and Direct Saturation (DS).
CEST-fMRI. Experiments were performed on a 17.2T scanner (Bruker BioSpin) using a 30-mm diameter surface coil. Based on BOLD activation maps obtained using multi-slice GE-EPI, one specific slice was chosen for CEST-GE-EPI acquisitions, which were performed while alternating opposite irradiation frequencies. The CEST preparation consisted of a train of 40 50-ms rectangular pulses with a B1 of 3.5µT. Saturation sets at ±1.2ppm and ±3.5ppm were targeted in separate sessions, using 10 and 7 rats respectively. Common acquisition parameters: 2x2cm FOV, 85x85 matrix size, 1.2mm slice thickness, 450kHz bandwidth, TE/TR=9/2500ms.
Data processing. CEST-fMRI data was processed with a customized MATLAB code. The ratios of CEST-weighted images with opposite irradiation frequencies were calculated as: $$$\frac{S_{-\Delta w}}{S_{+\Delta w}}$$$. CEST- fMRI time courses were extracted from regions of interest (ROIs) drawn on the BOLD activation maps, and were added to the analysis provided the BOLD signal change was higher than 1%.
Results
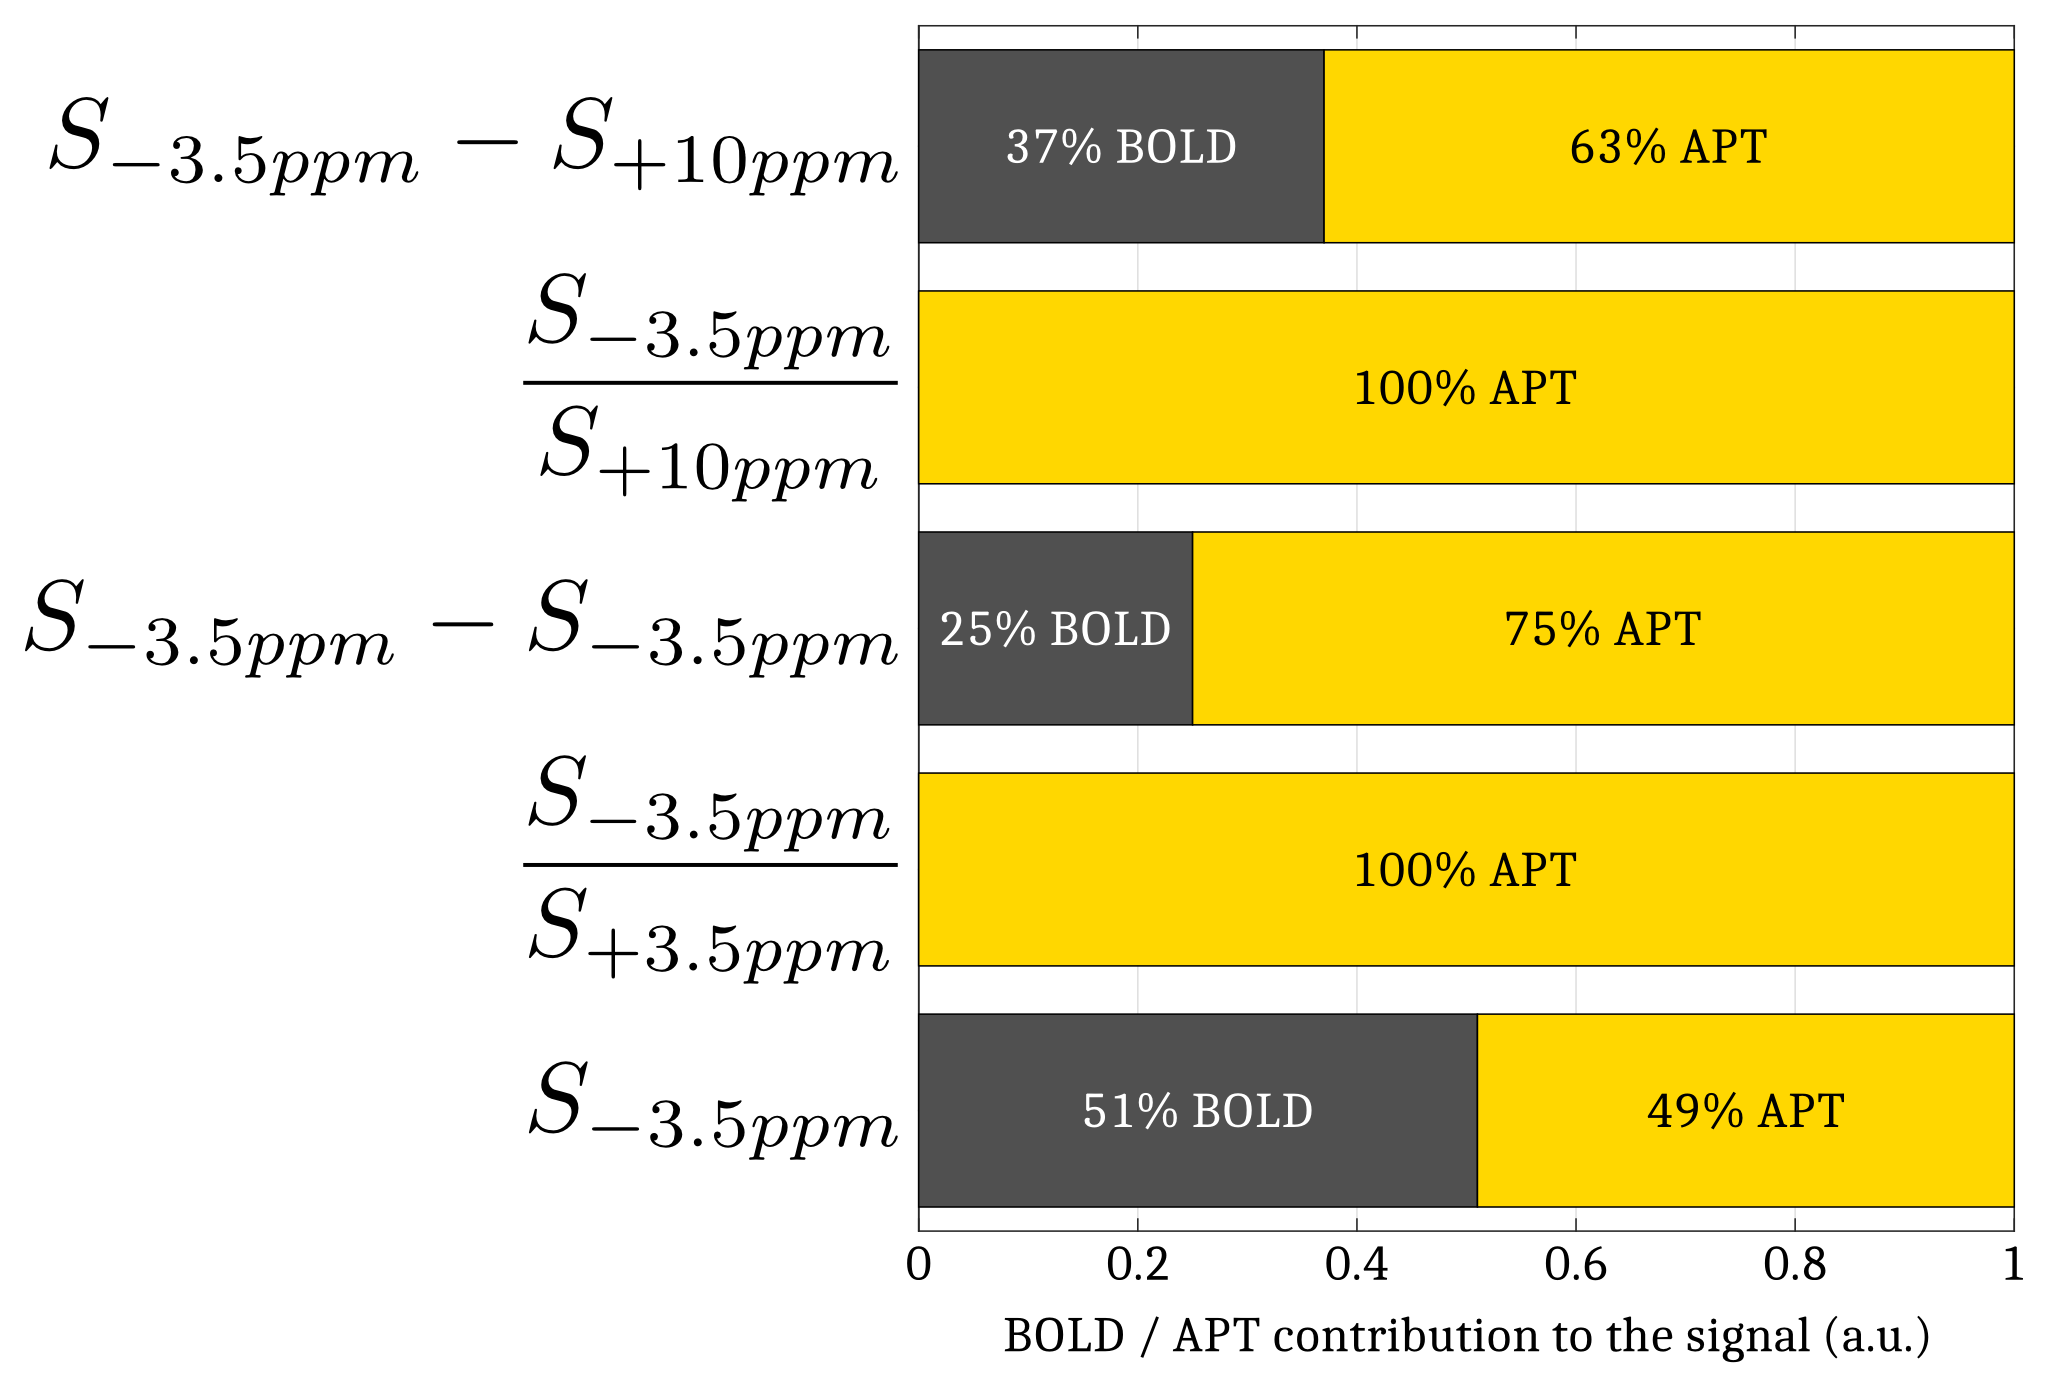
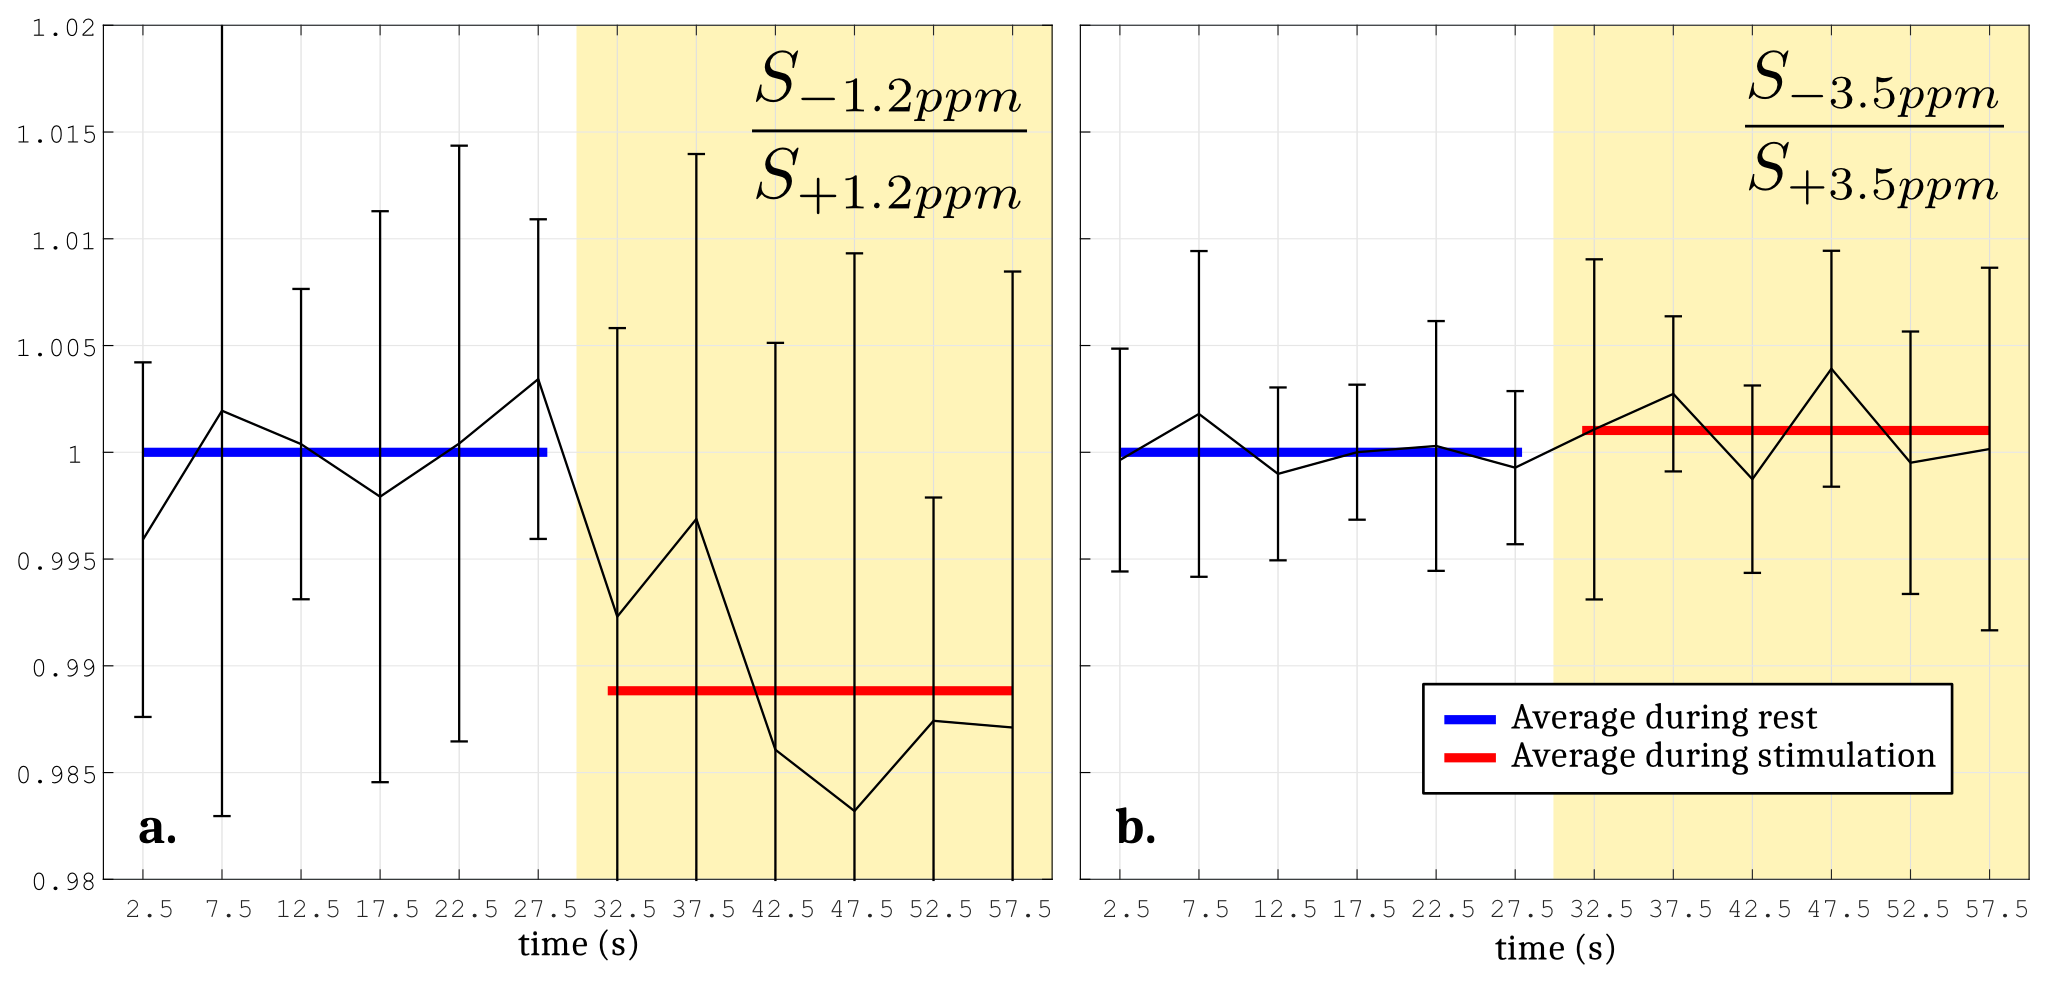
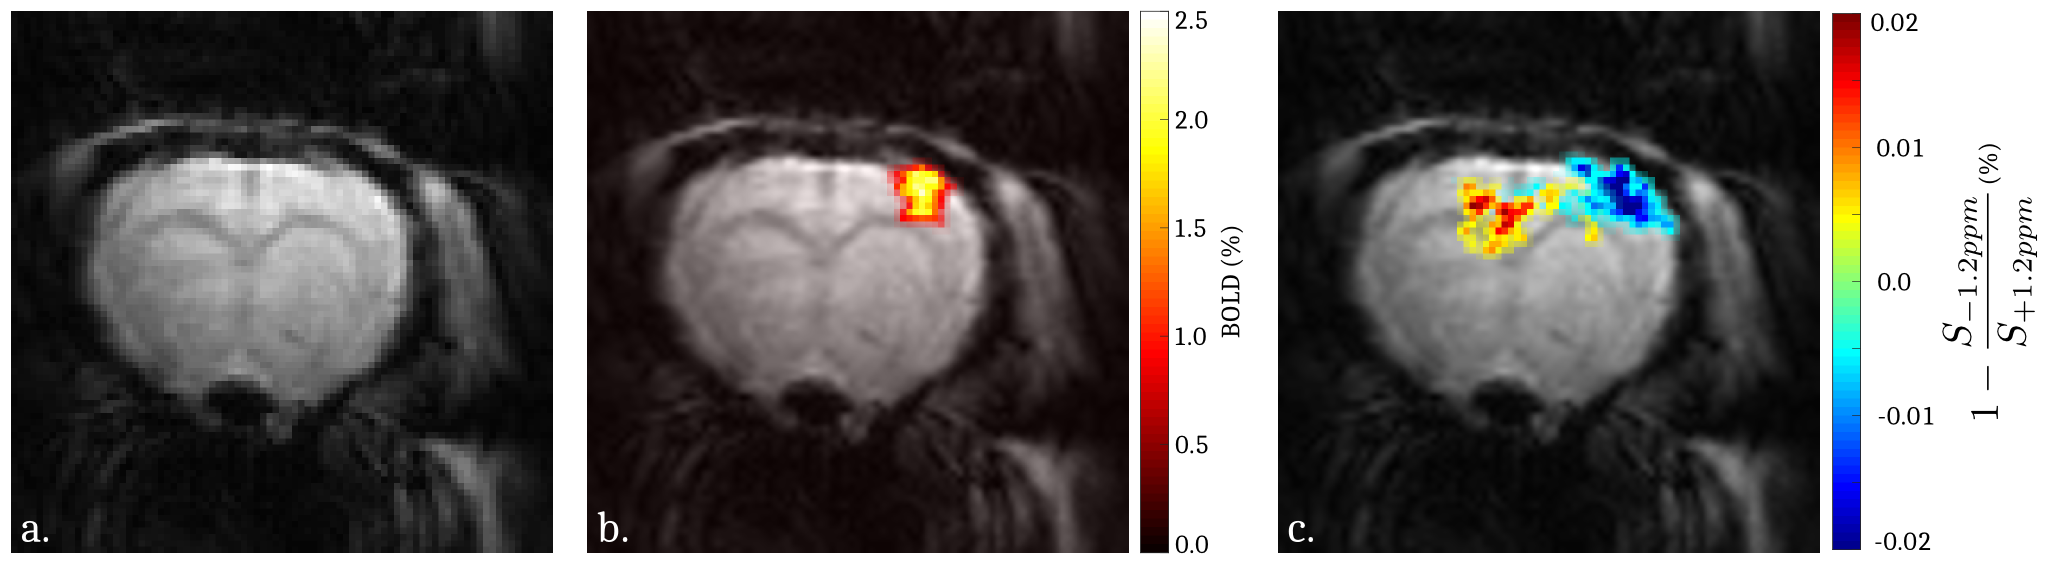
The Monte Carlo study showed that a perturbation of the Z-spectrum taking place at $$$\pm\Delta w$$$ could be detected by acquiring CEST-weighted images at two opposite frequencies $$$-\Delta w$$$ and $$$+\Delta w$$$, and calculating the ratio $$$\frac{S_{-\Delta w}}{S_{+\Delta w}}$$$ (Fig.2) to cancel out the unwanted BOLD, DS and MT effects. Experimentally, a -1.12% decrease of the ratio $$$\frac{S_{-1.2ppm}}{S_{+1.2ppm}}$$$ was observed during the stimulated state (Fig.3a), while no significant changes were observed at ±3.5ppm (Fig.3b). Figure 4 compares a BOLD image with its corresponding ±1.2ppm CEST-weighted fMRI, revealing a negative CEST contrast in the somatosensory cortex.Discussion & Conclusion
This paper presents the first attempt to collect CEST-weighted fMRI activation maps. A change in the CEST spectrum was detected at ±1.2ppm during brain activation while no significant changes were observed at ±3.5ppm. Considering that the upfield CEST-weighted signal is constant and that BOLD, symmetric MT and DS are fully compensated, the observed contrast at +1.2ppm most likely originates from changes in glucose metabolism. Indeed, recent CEST-MRI studies9,10 showed that glucose has a broad Z-spectrum contribution at +1.2ppm. The role of glucose has already been studied using fMRS,3,4,5 PET11 and PET-MRI:2,12 glucose shows an increased metabolic rate during brain activation, which can cause a local and temporary drop of the glucose concentration.13 This is in agreement with our findings. While the CEST-fMRI method introduced here can only provide relative CEST changes, future improvements should allow the use of Magnetization Transfer Ratio (MTR) analyses in order to quantitatively measure glucose metabolic rate. These results are thus very promising, and could lead to the development of a new fMRI tool to measure and image real-time metabolic changes upon neuronal activation.Acknowledgements
This research was supported by the CEA Enhanced Eurotalents program, the Louis-Jeantet Foundation and a public grant overseen by the French National Research Agency (ANR) under the project name “CIACM” (reference: ANR-13-NEUC-0002-01).References
1. NK Logothetis. What we can do and what we cannot do with fMRI. Nature. 2008;453:869-878.
2. Mangia S, Giove F, Tkác I, Logothetis NK, Henry PG, Olman CA, Maraviglia B, Di Salle F and Ugurbil K. Metabolic and hemodynamic events after changes in neuronal activity: current hypotheses, theoretical predictions and in vivo NMR experimental findings. J Cereb Blood Flow Metab. 2009;29:441-463.
3. Chen W, Novotny EJ, Zhu XH, Rothman DL and Shulman RG. Localized 1H NMR measurement of glucose consumption in the human brain during visual stimulation. Proc Natl Acad Sci U S A. 1993;90:9896-9900.
4. Hyder F, Rothman DL, Mason GF, Rangarajan A, Behar KL and Shulman RG. Oxidative glucose metabolism in rat brain during single forepaw stimulation: a spatially localized 1H[13C] nuclear magnetic resonance study. J Cereb Blood Flow Metab. 1997;17:1040-1047.
5. Shestov AA, Emir UE, Kumar A, Henry PG, Seaquist ER and Öz G. Simultaneous measurement of glucose transport and utilization in the human brain. Am J Physiol Endocrinol Metab. 2011;301:E1040-1049.
6. Schaller B, Xin L, O'Brien K, Magill AW and Gruetter R. Are glutamate and lactate increases ubiquitous to physiological activation? A 1H functional MR spectroscopy study during motor activation in human brain at 7 Tesla. Neuroimage. 2014;93:138-145.
7. Le Bihan D. Looking into the functional architecture of the brain with diffusion MRI. Nat Rev Neurosci. 2003;4:469-480.
8. Le Bihan D. Direct and fast detection of neuronal activation in the human brain with diffusion MRI. Proc Natl Acad Sci U S A. 2006;103:8263-8268.
9. Walker-Samuel S, Ramasawmy R, Torrealdea F, Rega M, Rajkumar V, Johnson SP, Richardson S, Gonçalves M, Parkes HG, Arstad E, Thomas DL, Pedley RB, Lythgoe MF and Golay X. In vivo imaging of glucose uptake and metabolism in tumors. Nat Med. 2013;19:1067-1072.
10. Nasrallah FA, Pagès G, Kuchel PW, Golay X and Chuang KH. Imaging brain deoxyglucose uptake and metabolism by glucoCEST MRI. J Cereb Blood Flow Metab. 2013;33:1270-1278.
11. Fox PT, Raichle ME, Mintun MA and Dence C. Nonoxidative glucose consumption during focal physiologic neural activity. Science. 1988;241:462-464.
12. Wehrl HF, Hossain M, Lankes K, Liu CC, Bezrukov I, Martirosian P, Schick F, Reischl G and Pichler BJ. Simultaneous PET-MRI reveals brain function in activated and resting state on metabolic, hemodynamic and multiple temporal scales. Nat Med. 2013;19:1184-1189.
13. Giove F, Mangia S, Bianciardi M, Garreffa G, Di Salle F, Morrone R and Maraviglia B. The physiology and metabolism of neuronal activation: in vivo studies by NMR and other methods. Magn Reson Imaging. 2003;21:1283-1293.
Figures