0245
The first two years of whole brain functional development can be separated into three distinct time periods1Department of Biomedical Engineering and Biomedical Research Imaging Center, University of North Carolina at Chapel Hill, Chapel Hill, NC, United States, 2Department of Radiology and Biomedical Research Imaging Center, University of North Carolina at Chapel Hill, Chapel Hill, NC, United States
Synopsis
Resting functional connectivity has been utilized to characterize early brain functional development. Most of the studies to date have grouped subjects based on biological age, enabling assessment of brain functional maturation. However, this grouping approach assumes that subjects at the same age exhibit similar functional maturation, which may not be valid considering the paces of functional maturation could substantially vary among individuals. In this study, the normalized-Cut method was used to cluster connectivity matrixs of 71 normally developing children, 0 to 2 years of age, into distinct age periods (functional age) reflecting stable brain funcitonal connectivity. We found that brain functional development during the first two years of life consists of three distinct time periods 0 – 2, 3 – 6, and 7 - 26 months, respectively. In addition, 17 core brain regions were identified, which largely drove our clustering results. These regions could be of critical importance for early brain development.
Purpose
To assess brain functional maturation processes during early infancy, grouping subjects based on age has been widely employed. While informative results have been demonstrated, grouping based on age1-6 assumes that subjects at the same age possess a similar pace of brain functional maturation. This assumption may not be valid in light of the behaviroal results demonstrating that the pace of brain functional maturation could vary substantially among each individual particularly during early infancy. In this study, a data driven approach was employed to cluster subjects into different groups with similar functional connectivity independent of age. In so doing, it enables the identification of distinct time periods of brain funcitonal maturation during early infancy (functional age), potentially reflecting different milestones. In addition, brain core regions largely attributed to the clustering results can also be identified, which may reveal the core functional developments during this critical time period of early brain development.Methods
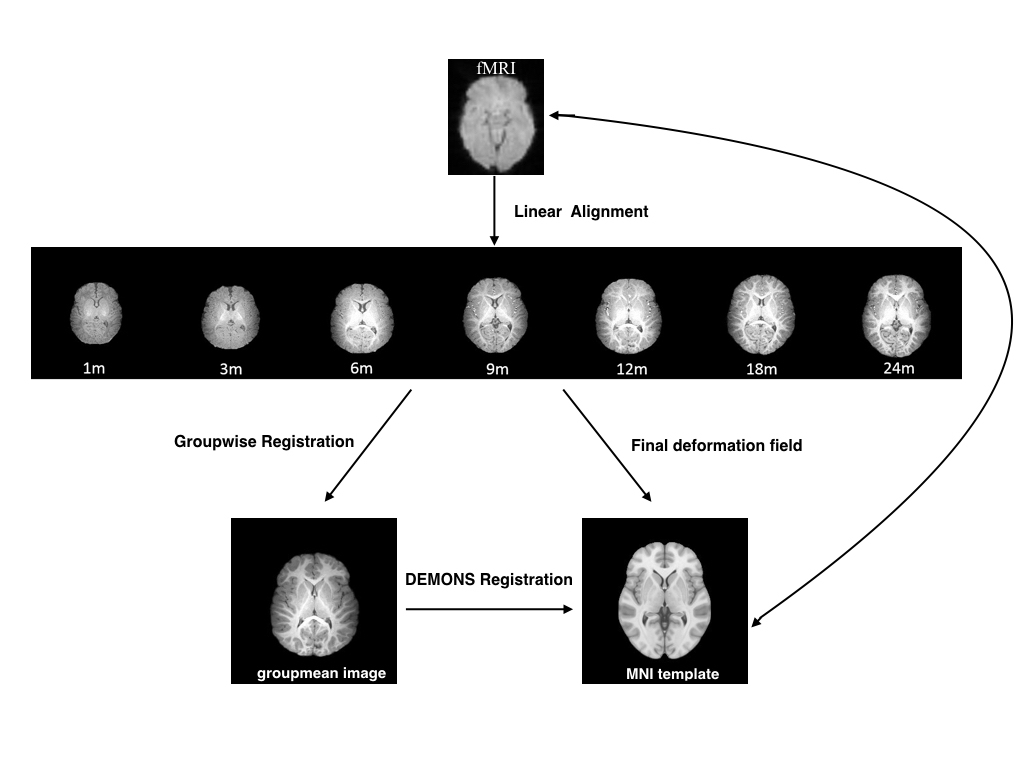
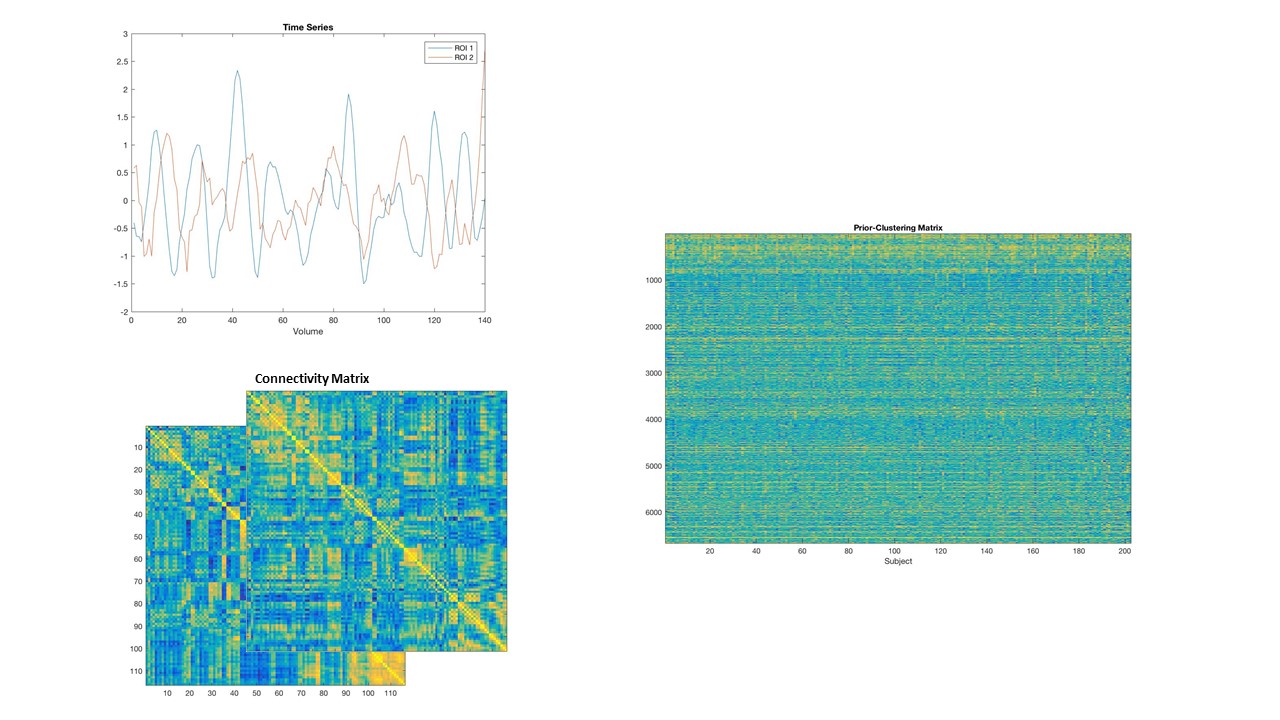
A total of 71 normally developing children were imaged longitudianlly at 0, 3, 6, 9, 12, 18, and 24 months of age. Functional data were preprocessed using FSL software9-11, including discarding the first 10 volumes, slice-timing correction, motion correction, spatial smoothing (6mm FWHM), bandpass filtering (0.01 Hz ~ 0.08 Hz), global mean/white matter/CSF signal regression, as well as FD-DVARS “scrubbing” process12. Images of each subject were then registered to a standard template with the pipeline illustrated in Figure 1. Mean time-series was calculated using the AAL13 ROIs and Pearson’s correlation coefficients between pairs of ROIs were calcualted, yielding a 116x116 symmetric connectivity matrix for each individual scan. The normalized-Cut method was used to cluster connectivity matrices into different groups independent of age. The clustering solution can be iteratively estimated as the method proposed by Yu7 and Shen8 .
T-test was employed to identfy significantly different connections between clustering groups (p<0.05, FDR corrected). Subsequently, significant features among all groups were identified, representing the major features that constituted to the whole brain clustering results. Core brain regions were then defined as the brain regions within the top 15% (17 regions) of the highest degree value within such feature connections.
Result
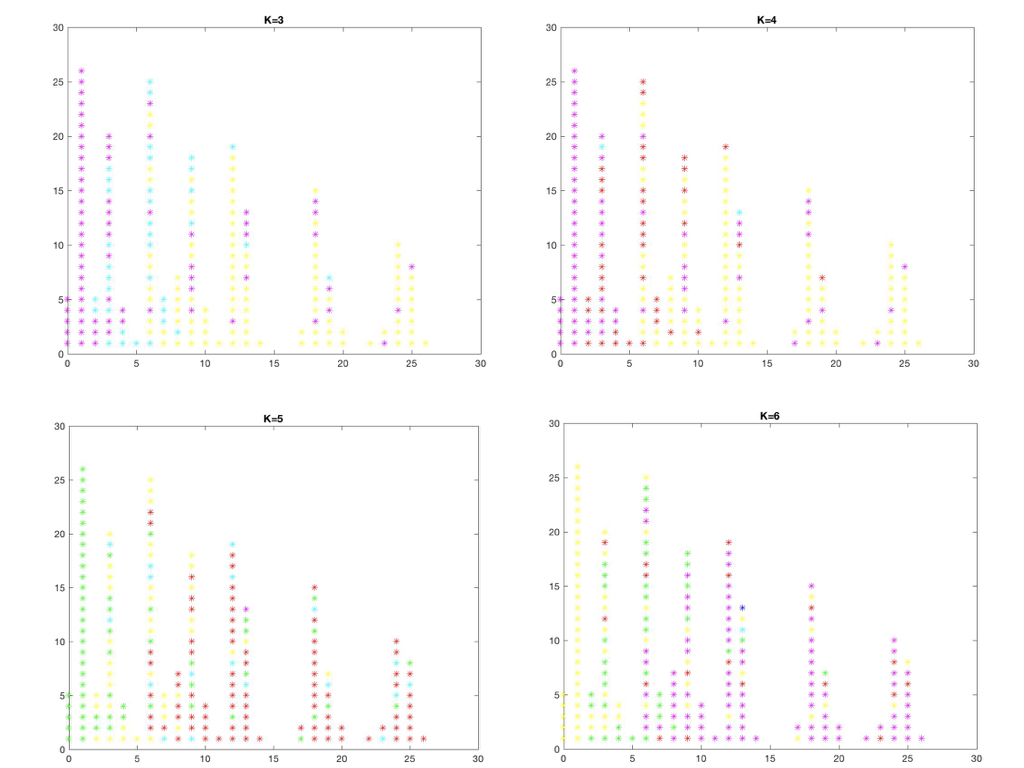
Figure 3 shows the cluster results with k = 3, 4, 5 and 6, respectively. While subtle differences were observed among different k values, the overall pattern remains similar; the whole brain functional development during the first two years of life can be divided into 3 distinctly different time periods, 0 – 2, 3 – 6 and 7 – 26 months, respectively.
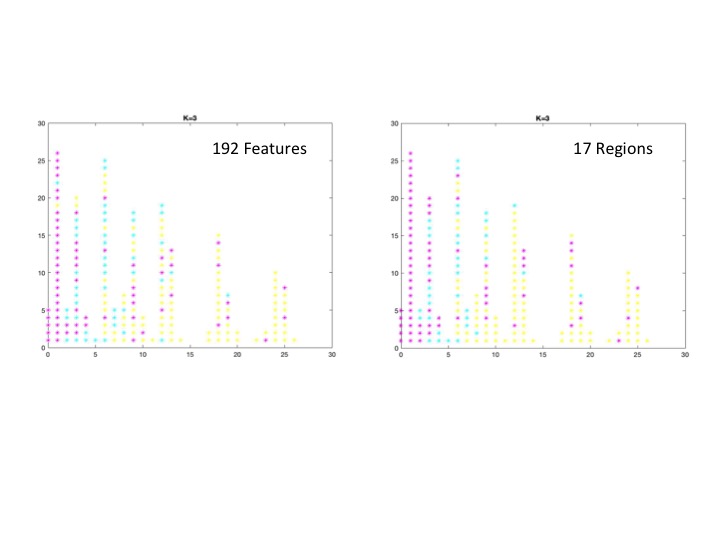
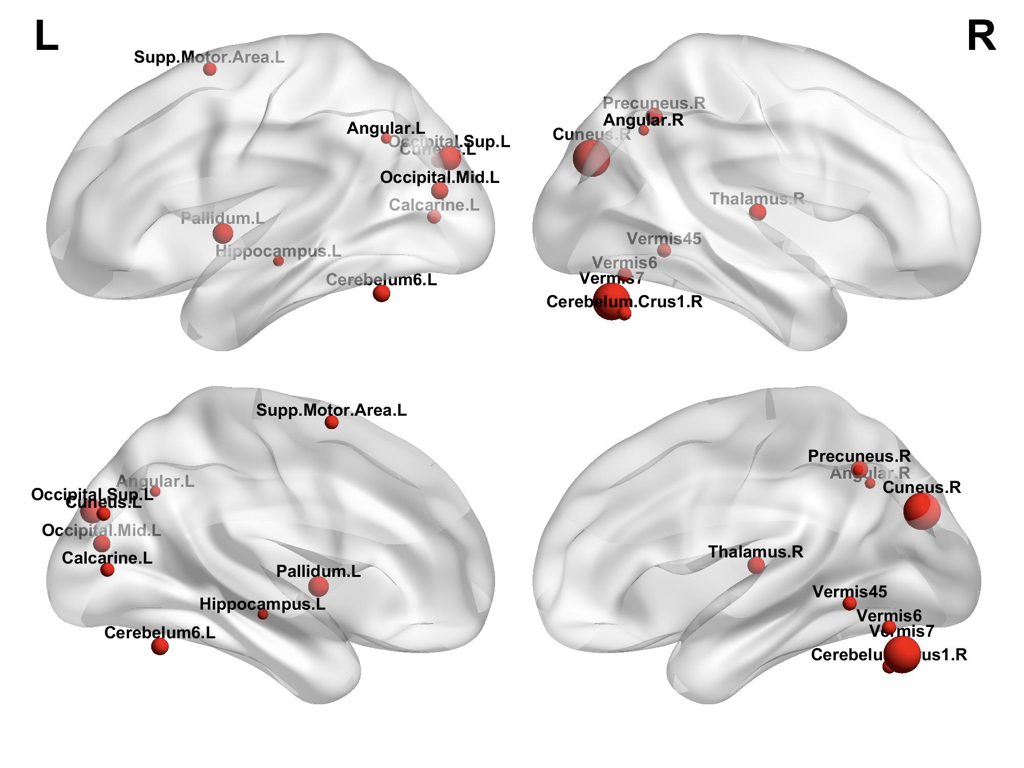
A total of 192 feature connections and 17 core regions were identified, which represent the main connections/regions leading to the observed 3 clusters. Figure 4 shows the cluster results using the 192 feature connections and 17 core regions, respectively. Notice these cluster results resemable that oberved pattern using the whole brain functional connectivity. The 17 core regions are shown in Figure 5.
Discussion
Our results reveal three distinct time periods (functional age) of brain functional development during the first two years of life. Specifically, the interval of each time period increases from 3, 4 to 20 months, suggesting that brain development is temporally non-linear with rapid development during infancy and progressively becoming slower with age. These findings are consistent with our understand of early brain development. Furthermore, 192 feature connections and 17 core brain regions were identified, which play the vital role in distinguishing brain functional connectivity into 3 groups. Of the 17 core regions, Cuneus_L/R, Occipital_Sup_L, Occipital_Mid_L and Calcarine_L were observed, suggesting substantial development of visual function during this time period. Meanwhile, the Cerebellum area, Pallidum and SMA indicate the development of motor function, including fine muscle movement, balance and movement control. Finally, the Angular_L/R and Precuneus_R suggest the development of default network, as well as high-order function maturation.
In our study, AAL template was chosen. To determine if our results depend on the choice of the AAL template, several published atlases, including AAL40314, CC20015, Shen26816 in both standard space and individual functional space were also evaluated. Consisent findings were observed independent of the choice of atlases, suggesting a high reliability of our temporal functional segmentation.
Conclusion
This study reveals temporal evolution of brain function from birth to 2 years of age in a large sample of normal and healthy pediaric subjects. Our results suggest that brain functional development during the first two years of life can be separated into three distinct time periods. In addition, the identified 17 core regions may represent the brain regions undergoing critical development during this time period, which could have profound clinical implications in the diseased populations.Acknowledgements
No acknowledgement found.References
1. Emerson, R.W., W. Gao, and W. Lin, Longitudinal Study of the Emerging Functional Connectivity Asymmetry of Primary Language Regions during Infancy. J Neurosci, 2016. 36(42): p. 10883-10892.
2. Gao, W., et al., Development of human brain cortical network architecture during infancy. Brain Struct Funct, 2015. 220(2): p. 1173-86.
3. Gao, W., et al., Intersubject variability of and genetic effects on the brain's functional connectivity during infancy. J Neurosci, 2014. 34(34): p. 11288-96.
4. Gao, W., et al., Temporal and spatial development of axonal maturation and myelination of white matter in the developing brain. AJNR Am J Neuroradiol, 2009. 30(2): p. 290-6.
5. Lin, W., et al., Functional connectivity MR imaging reveals cortical functional connectivity in the developing brain. AJNR Am J Neuroradiol, 2008. 29(10): p. 1883-9.
6. Gao, W., et al., Temporal and Spatial Evolution of Brain Network Topology during the First Two Years of Life. Plos One, 2011. 6(9).
7. Yu, S.X. and J.B. Shi, Multiclass spectral clustering. Ninth Ieee International Conference on Computer Vision, Vols I and Ii, Proceedings, 2003: p. 313-319.
8. Shen, X., et al., Groupwise whole-brain parcellation from resting-state fMRI data for network node identification. NeuroImage, 2013. 82: p. 403-415.
9. Jenkinson, M., et al., Fsl. Neuroimage, 2012. 62(2): p. 782-790.
10. Smith, S.M., et al., Advances in functional and structural MR image analysis and implementation as FSL. Neuroimage, 2004. 23: p. S208-S219.
11. Woolrich, M.W., et al., Bayesian analysis of neuroimaging data in FSL. Neuroimage, 2009. 45(1): p. S173-S186.
12. Power, J.D., et al., Methods to detect, characterize, and remove motion artifact in resting state fMRI. Neuroimage, 2014. 84: p. 320-41.
13. Tzourio-Mazoyer, N., et al., Automated anatomical labeling of activations in SPM using a macroscopic anatomical parcellation of the MNI MRI single-subject brain. Neuroimage, 2002. 15(1): p. 273-289.
14. Jin, Y., et al., Identification of Infants at High-Risk for Autism Spectrum Disorder Using Multiparameter Multiscale White Matter Connectivity Networks. Human Brain Mapping, 2015. 36(12): p. 4880-4896.
15. Craddock, R.C., et al., A whole brain fMRI atlas generated via spatially constrained spectral clustering. Human Brain Mapping, 2012. 33(8): p. 1914-1928.
16. Finn, E.S., et al., Functional connectome fingerprinting: identifying individuals using patterns of brain connectivity. Nature Neuroscience, 2015. 18(11): p. 1664-1671.
17. Wu, G.R., et al., SharpMean: Groupwise registration guided by sharp mean image and tree-based registration. Neuroimage, 2011. 56(4): p. 1968-1981.
18. Wu, G.R., et al., Groupwise Registration with Sharp Mean. Medical Image Computing and Computer-Assisted Intervention - Miccai 2010, Pt Ii,, 2010. 6362: p. 570-577.
Figures