0244
A Multiband Multi-Echo Simultaneous ASL/BOLD Acquisition for Resting State Functional Connectivity1Radiology, Medical College of Wisconsin, Milwaukee, WI, United States
Synopsis
A multiband multi-echo simultaneous ASL/BOLD sequence was developed and utilized to evaluate resting state connectivity. ASL sequences have inherently long TRs due to the tagging and delay components. To compensate for this, four echoes were collected allowing multi-echo independent component analysis (ME-ICA) to be employed to denoise the BOLD data. A seed-based analysis was used for the computation of functional connectivity. Temporal signal to noise ratio (tSNR) was significantly higher for the denoised data resulting in an increase in connectivity strength, cluster size, and number of clusters. The sequence also allowed perfusion-weighted connectivity to be computed.
Purpose
Sequences have been developed to obtain ASL and BOLD contrast simultaneously by collecting ASL- and BOLD-sensitive echoes in one acquisition1-3. These acquisitions necessitate a long TR due to the ASL tagging and delay modules. Additionally, the total readout times of these acquisitions are severely limited by the short T1-relaxation of the tagged blood, which reduces the signal-to-noise ratio (SNR) and restricts the image resolution and total number of slices that can be acquired. To address these issues, multiband, multi-echo, ASL, and BOLD were combined to create a novel single MBME ASL/BOLD sequence. Using this sequence, high resolution, whole-brain simultaneous ASL/BOLD data were acquired to evaluate resting-state connectivity.Methods
Seven healthy subjects were imaged on a GE 3T MR750 system. A high-resolution T1-weighted MPRAGE anatomical image was collected for co-registration with the functional images. Subjects underwent one resting-state MBME ASL acquisition, which incorporated an unbalanced pCASL labeling scheme with labeling time=1.5s, post-labeling delay (PLD)=1.0s, and an EPI readout. Additional parameters were: TE=9.1,25,39.6,54.3ms, TR=3.5s, in-plane R=2, MB-factor=4, number of excitations=9 (total slices=9x4=36), FOV=240mm, resolution=3x3x3 mm3, FA=90°, Scans lasted approximately 10 minutes.
Preprocessing of each echo included volume registration, detrending, despiking, and blurring with a 4.5mm FWHM Gaussian kernel. The anatomical MPRAGE and functional images were registered to standard MNI space. A perfusion-weighted (PW) timeseries was generated from the first echo (TE=9.1ms) using the surround subtraction method4. BOLD denoising was performed using AFNI. First, echoes were combined using a T2*-weighted approach5,6. Next, the data was denoised using the automated ME-ICA technique (meica.py), which classifies independent components as BOLD or non-BOLD based on whether or not their amplitudes are linearly dependent on TE7,8. Components deemed non-BOLD were then regressed from the data.
Four datasets for each scan underwent further processing for rs-fcMRI: individual echo (E2, TE=25ms), multi-echo combined (MEC), multi-echo combined, denoised (MECDN), and perfusion-weighted (PW). For the E2 and MEC data, six rigid-body motion parameters and their derivatives, gray and white matter signal, and label/control oscillations were regressed from the data.
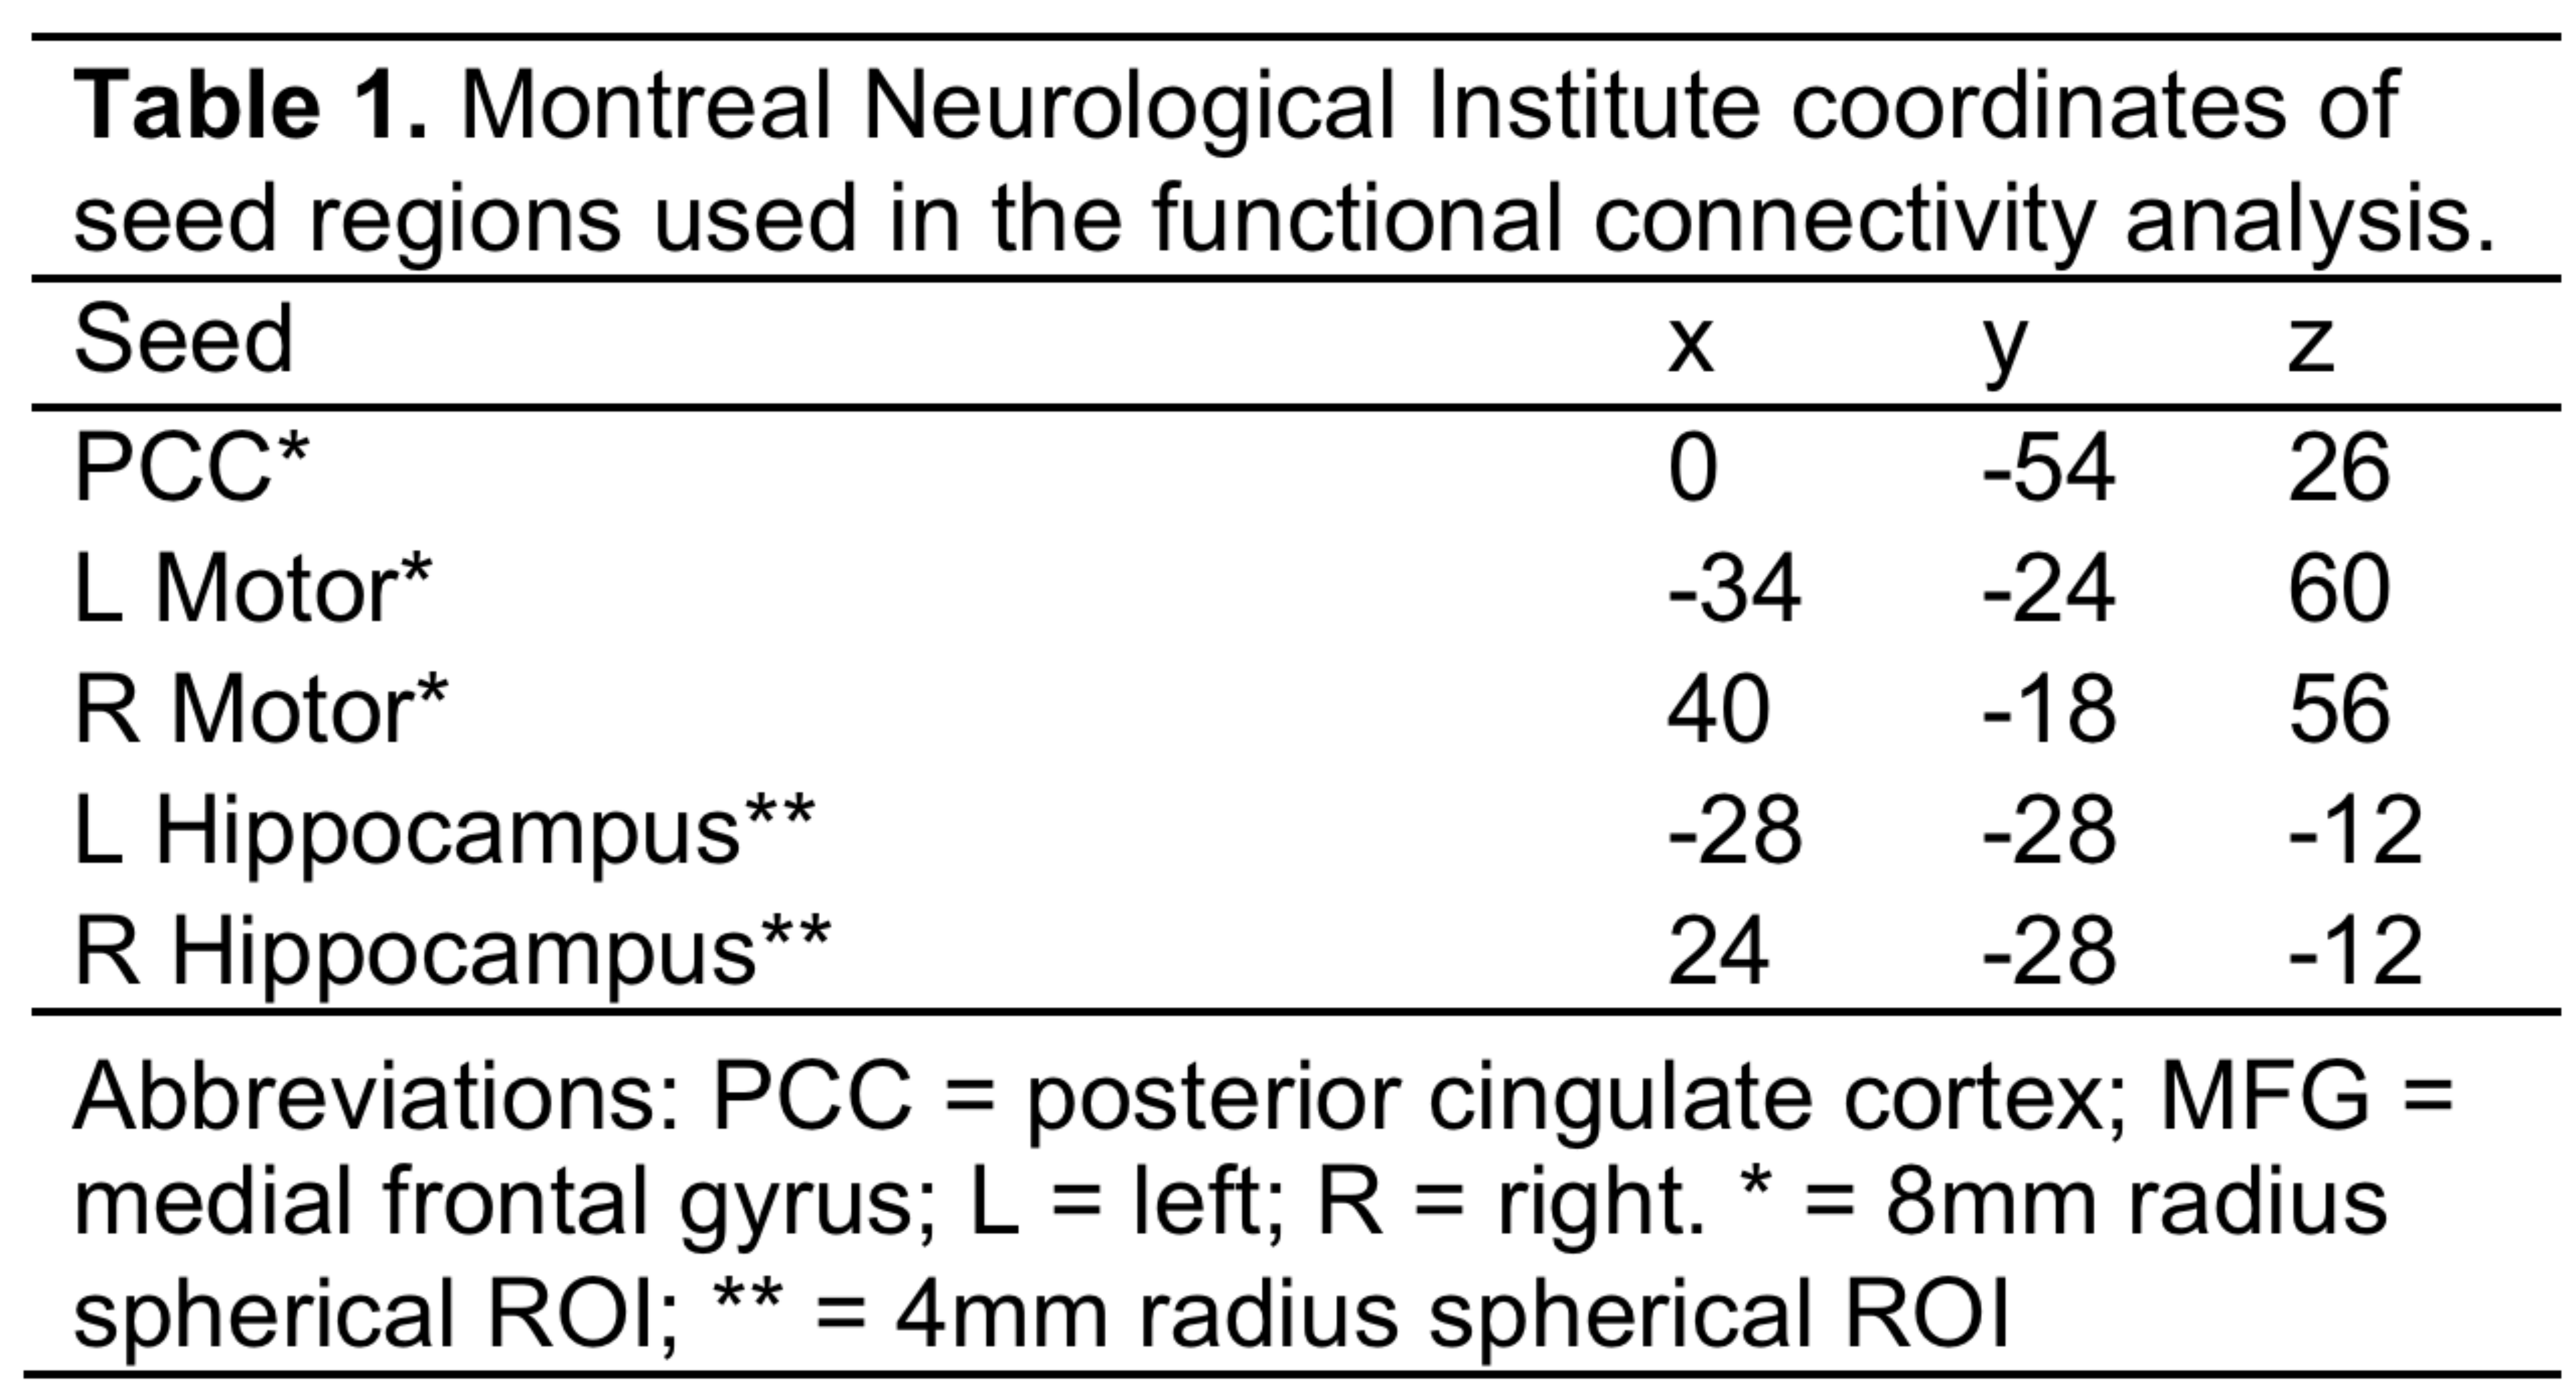
A seed-based analysis was employed for rs-fcMRI using several seeds: posterior cingulate cortex (PCC), L/R motor cortex, and L/R hippocampus (Table 1). All seeds were 8 mm radius spheres with the exception of the hippocampus seeds, which were 4 mm radius spheres according to the anatomical structure. The mean signal was extracted from each seed and correlated with each voxel in the brain using Pearson correlation. Correlation values were then transformed to z-scores using a Fisher z-transform. A group analysis was then conducted using a one-sample t-test. Voxels with corrected p<0.005 (minimum cluster size = 46, cluster corrected α = 0.05) were considered significant. Whole-brain tSNR, defined as the mean signal divided by the standard deviation across the timeseries, was also computed.
Results
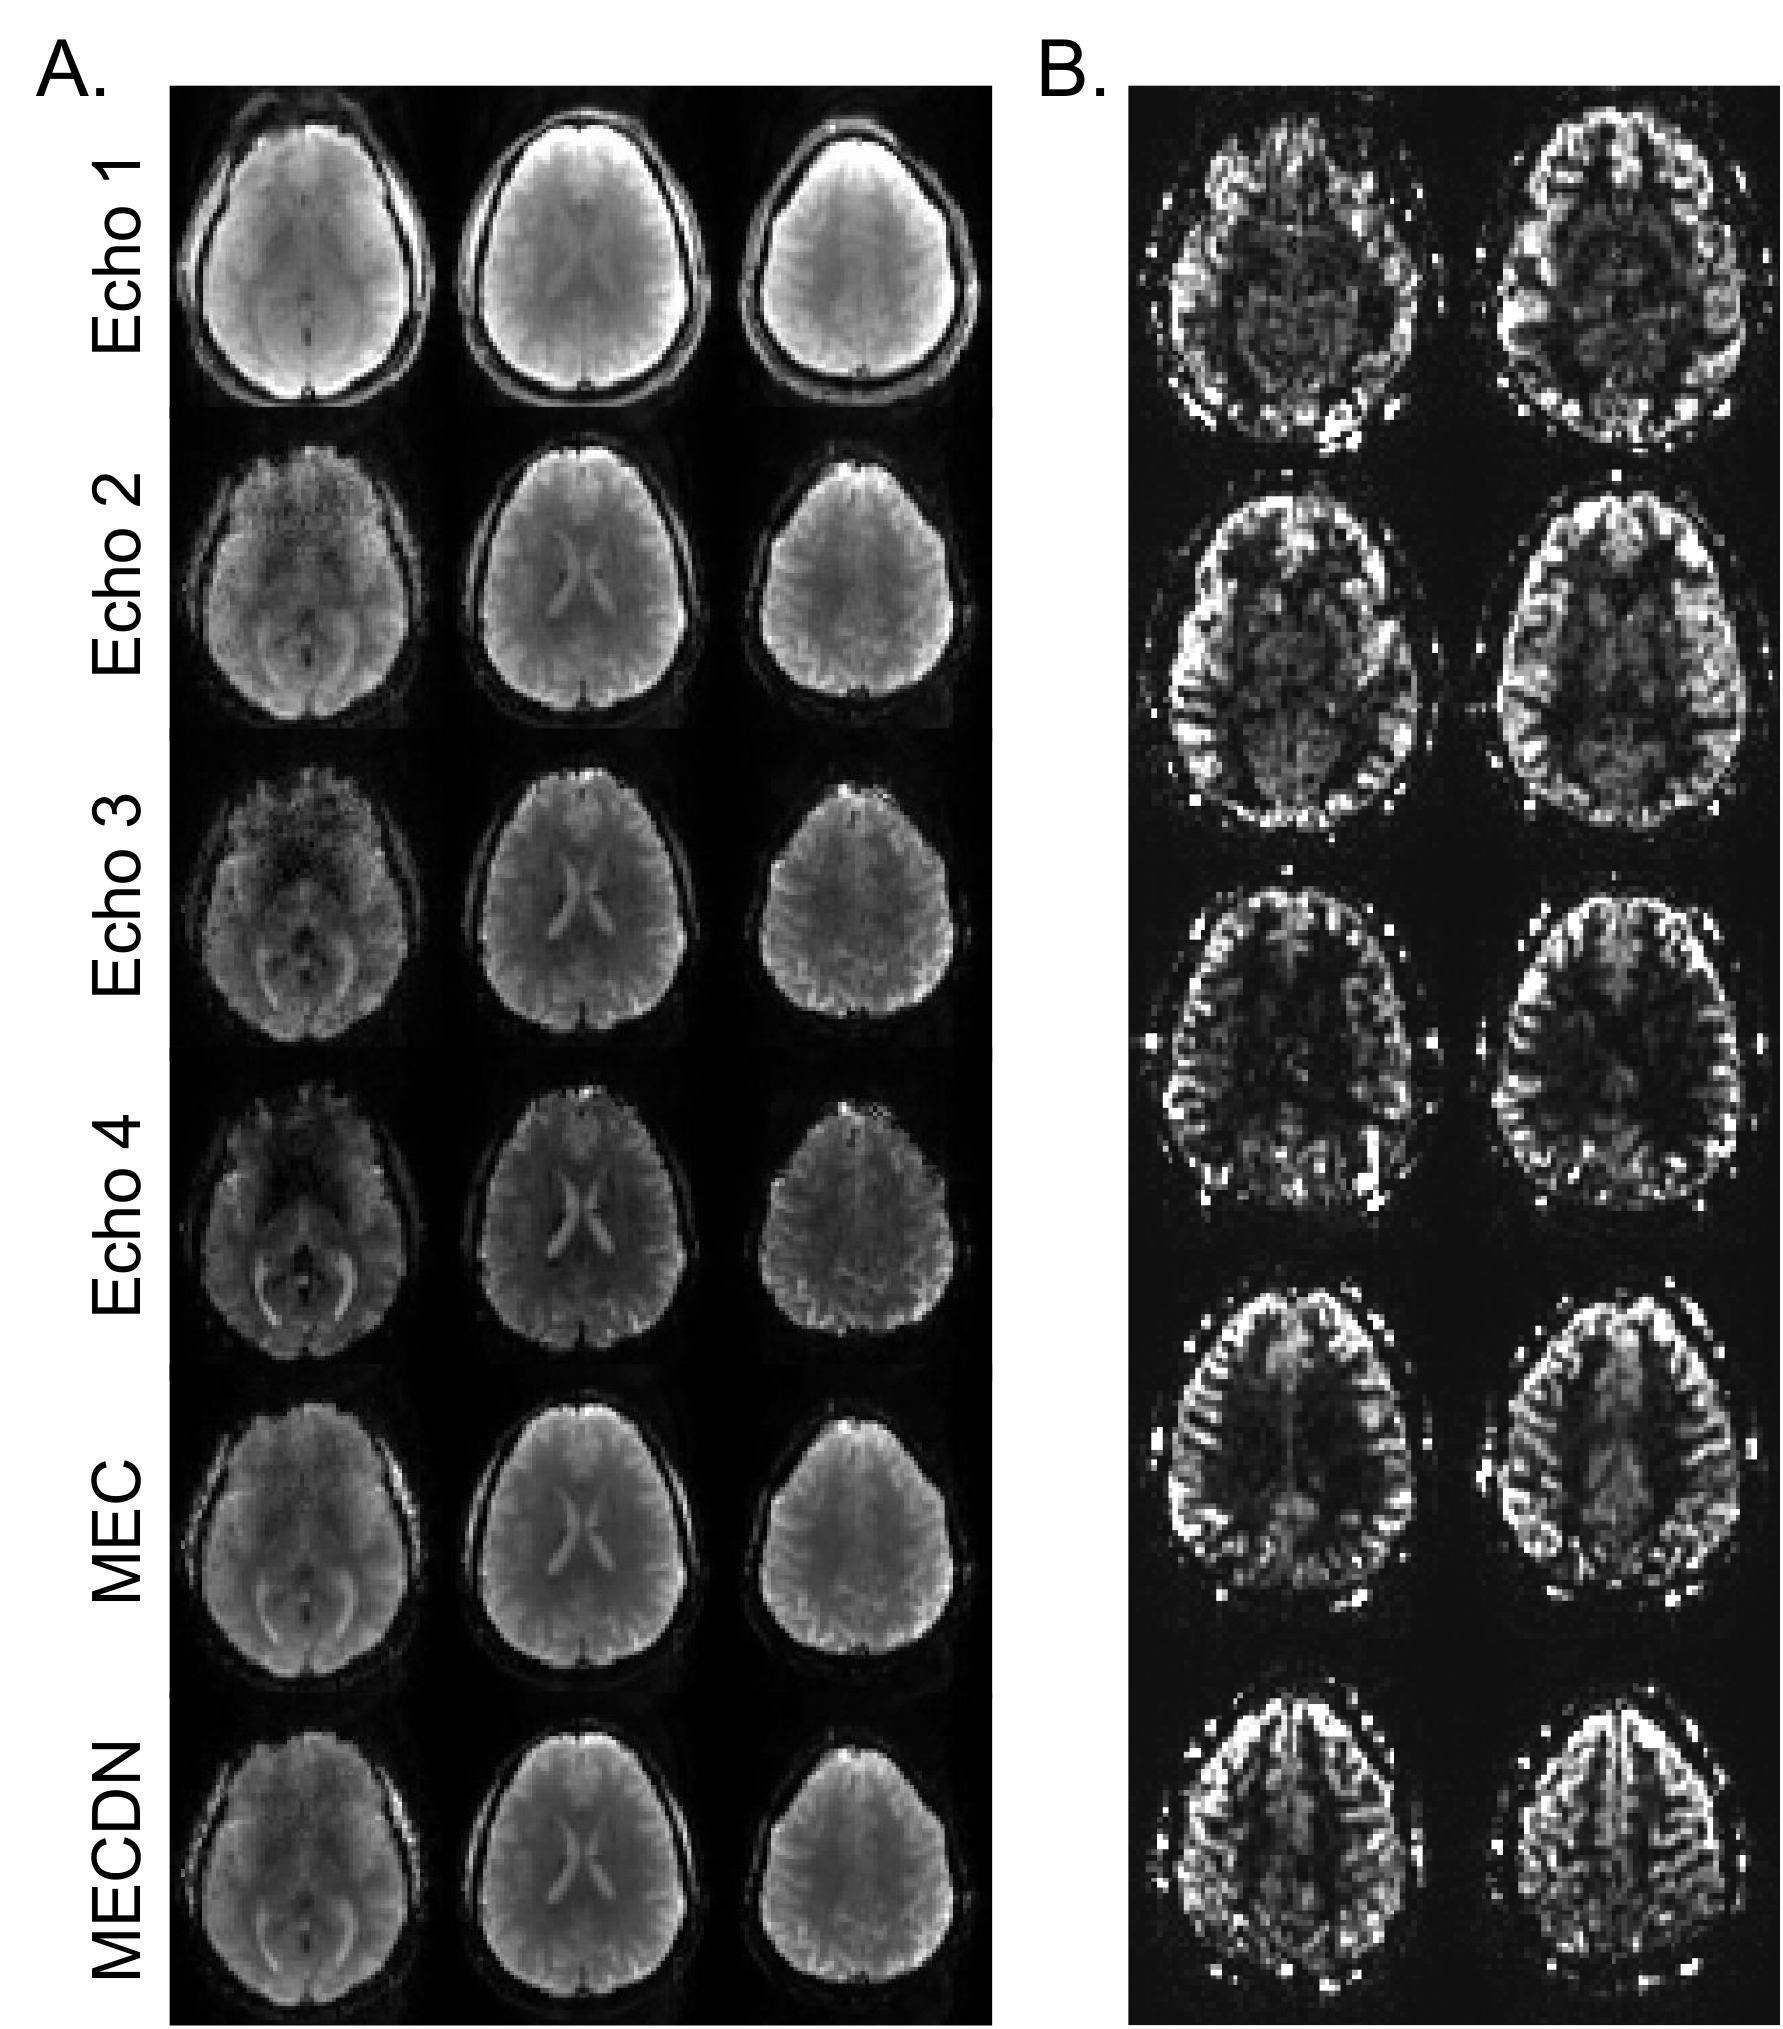
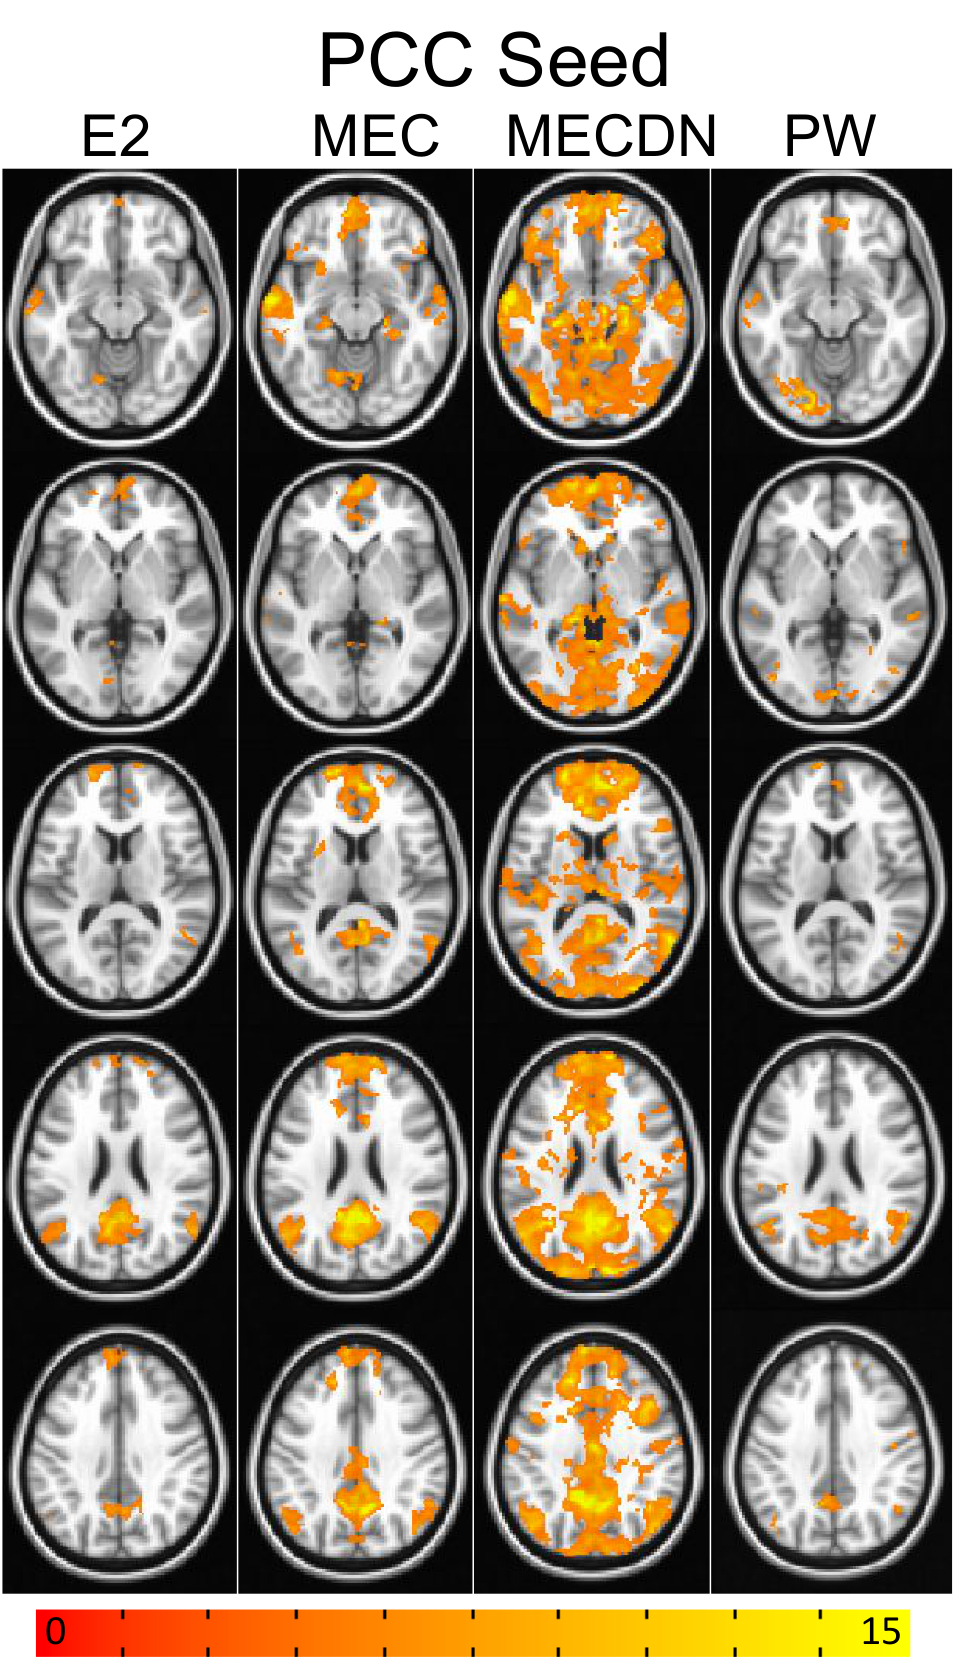
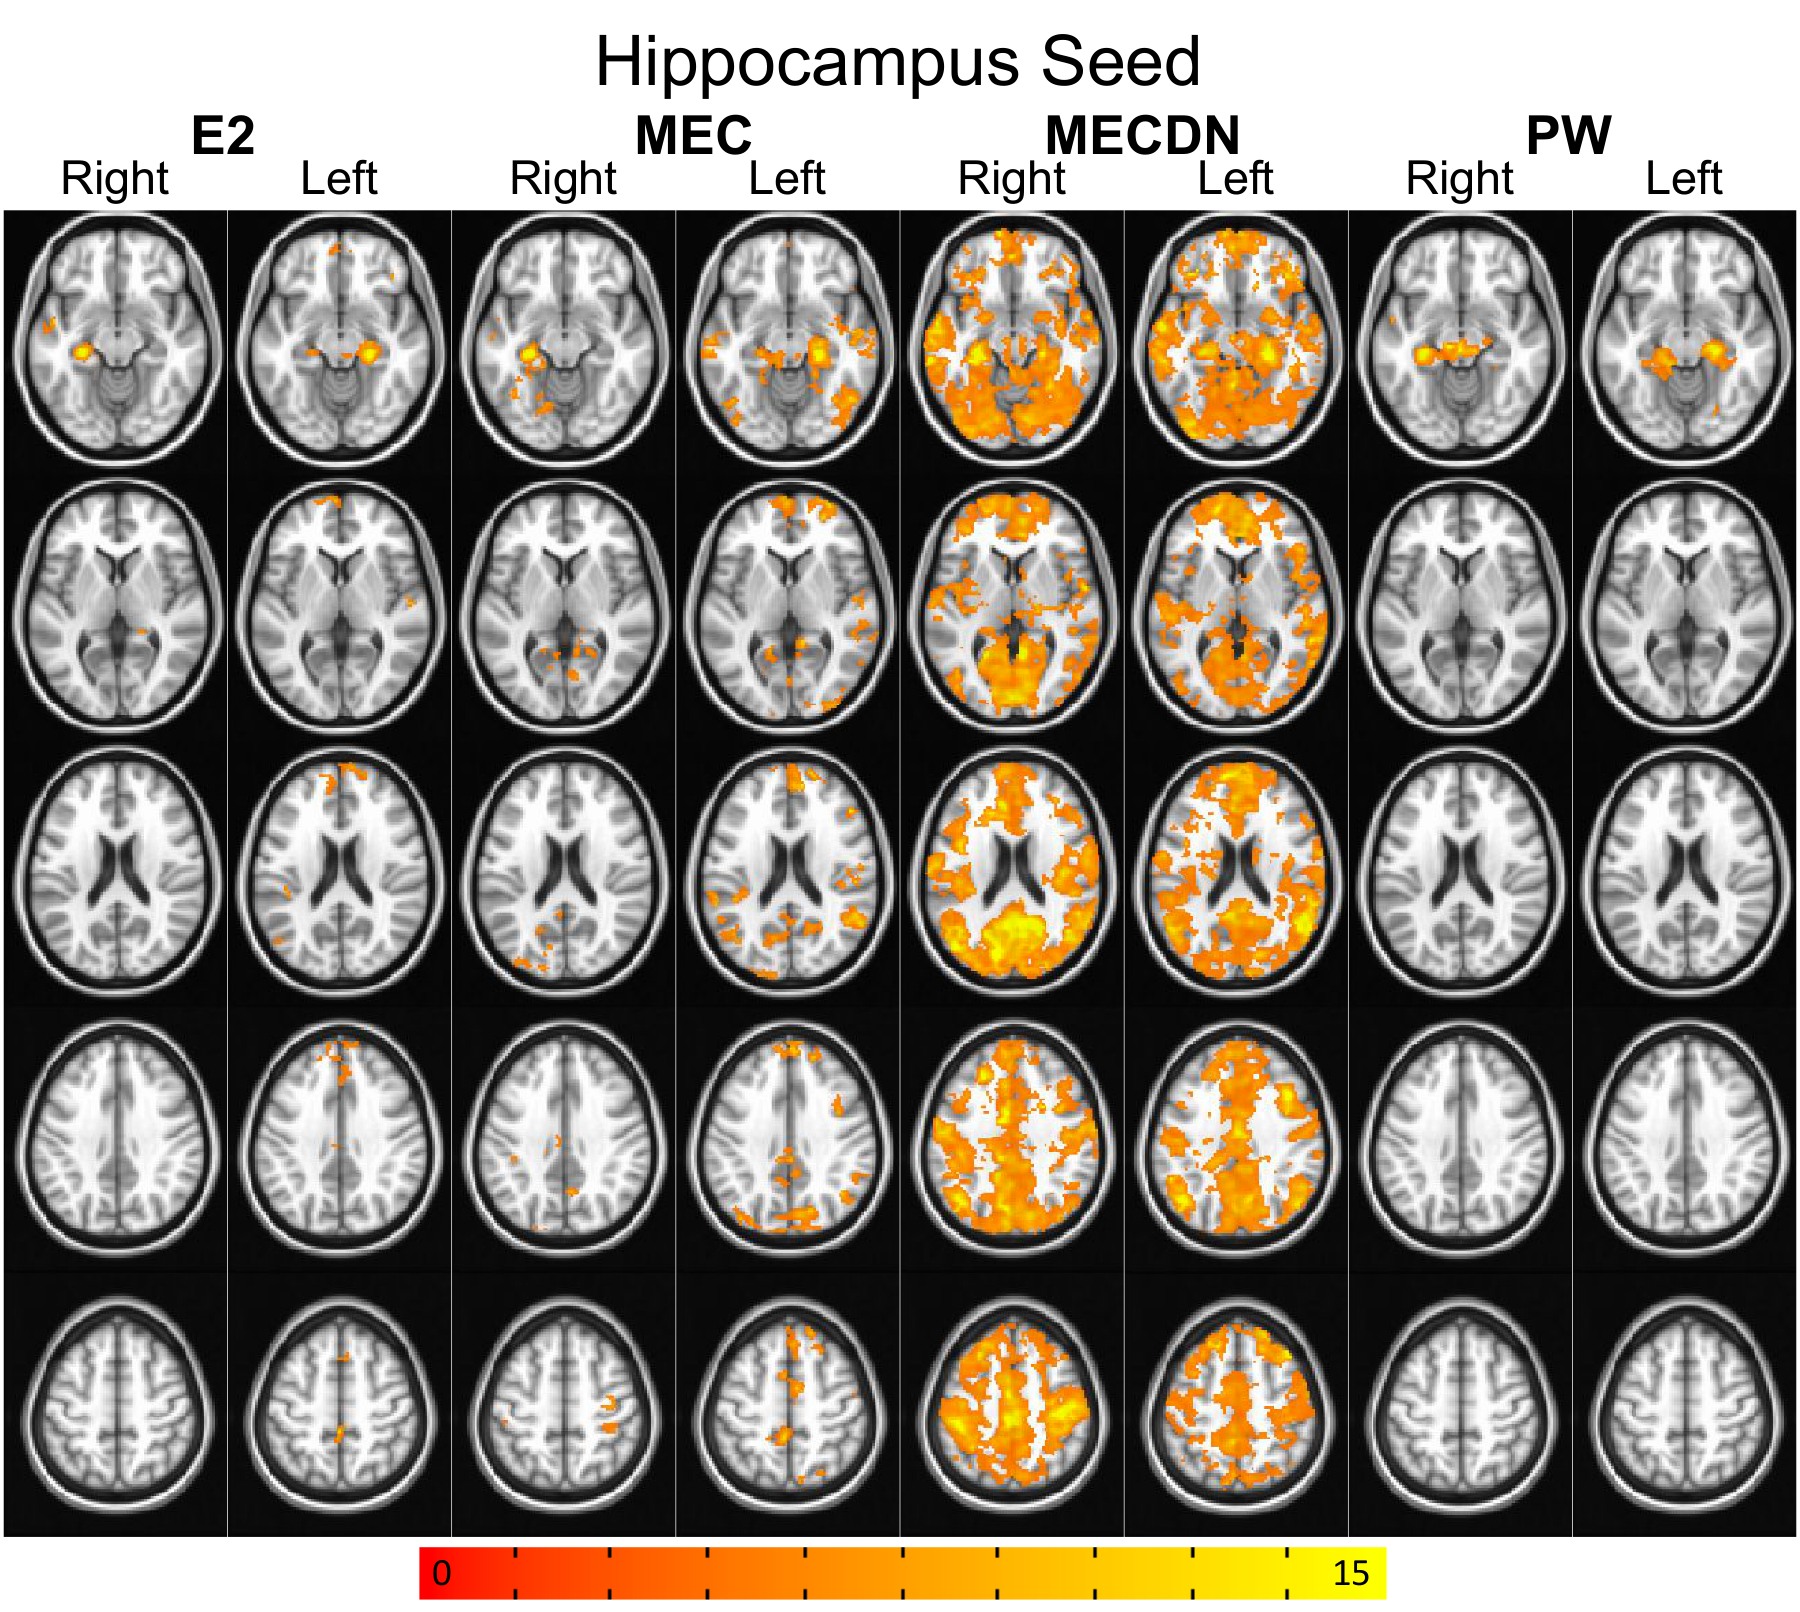
Representative individual echo, MEC, MECDN, and mean PW images are shown in Figure 1. tSNR was significantly higher for the MECDN data (106+/-11) compared to the MEC (69+/-12) and E2 data (47+/-9) and for the MEC data compared to the E2 data (MECDN>MEC, P=0.0009; MECDN>E2, P<0.0001; MEC>E2, P=0.005). PW tSNR=1.16+/-0.22. Figures 2-4 show the group functional connectivity results. Less connectivity was seen for the E2 data. Additional clusters were observed for the MEC data. A further increase in the number of clusters, cluster size, and connectivity strength was seen for the MECDN data. Significant connectivity was observed for the hippocampus seeds for the MECDN data, which included increased bilateral and long-range connectivity. Bilateral PW data connectivity was observed for the PCC and motor cortex seeds.Discussion/Conclusions
The increase in connectivity for MECDN data is likely due to the increase in tSNR. Murphy et al. showed the relationship between tSNR and the number of time points necessary to detect activation for a certain effect size for BOLD data9. This relationship is nonlinear, and a relatively small increase in tSNR can result in a large reduction in the number of time points necessary to detect significance. This greatly increases statistical power and reduces the number of time points necessary to detect significance. Thus, the additional echoes acquired with this sequence can compensate for the long TR inherent in ASL acquisitions. This was most notable for the hippocampus seed where little connectivity was seen for the E2 case, but widespread connectivity was observed for the MECDN case, mirroring previous reports8. This sequence may also be able to improve the calculation of cerebral vascular reactivity and CBF/BOLD coupling, and calibrated fMRI.Acknowledgements
This work was partially supported by a grant from the Daniel M. Soref Charitable Trust. We thank Ajit Shankaranarayanan and Matt Middione from GE Healthcare for providing source code of the GE multiband sequence.References
1. Ghariq E, Chappell MA, Schmid S, Teeuwisse WM, van Osch MJP. Effects of background suppression on the sensitivity of dual-echo arterial spin labeling MRI for BOLD and CBF signal changes. NeuroImage 2014;103:316-322.
2. Schmithorst VJ, Hernandez-Garcia L, Vannest J, Rajagopal A, Lee G, Holland SK. Optimized simultaneous ASL and BOLD functional imaging of the whole brain. Journal of magnetic resonance imaging : JMRI 2014;39(5):1104-1117.
3. Tak S, Wang DJJ, Polimeni JR, Yan L, Chen JJ. Dynamic and static contributions of the cerebrovasculature to the resting-state BOLD signal. NeuroImage 2014;84:672-680.
4. Wong EC, Buxton RB, Frank LR. Implementation of quantitative perfusion imaging techniques for functional brain mapping using pulsed arterial spin labeling. NMR Biomed 1997;10(4-5):237-249.
5. Poser BA, Versluis MJ, Hoogduin JM, Norris DG. BOLD contrast sensitivity enhancement and artifact reduction with multiecho EPI: parallel-acquired inhomogeneity-desensitized fMRI. Magn Reson Med 2006;55(6):1227-1235.
6. Posse S, Wiese S, Gembris D, Mathiak K, Kessler C, Grosse-Ruyken ML, Elghahwagi B, Richards T, Dager SR, Kiselev VG. Enhancement of BOLD-contrast sensitivity by single-shot multi-echo functional MR imaging. Magn Reson Med 1999;42(1):87-97.
7. Kundu P, Brenowitz ND, Voon V, Worbe Y, Vertes PE, Inati SJ, Saad ZS, Bandettini PA, Bullmore ET. Integrated strategy for improving functional connectivity mapping using multiecho fMRI. Proc Natl Acad Sci U S A 2013;110(40):16187-16192.
8. Kundu P, Inati SJ, Evans JW, Luh WM, Bandettini PA. Differentiating BOLD and non-BOLD signals in fMRI time series using multi-echo EPI. Neuroimage 2012;60(3):1759-1770.
9. Murphy K, Bodurka J, Bandettini PA. How long to scan? The relationship between fMRI temporal signal to noise ratio and necessary scan duration. Neuroimage 2007;34(2):565-574.
Figures