0243
Fully Automated Learning based Method for resting state fMRI Connectomics Analysis1GE Global Research, Bangalore, India, 2Hospital for Special Surgery, New York, NY, United States, 3University of California, San Francisco, San Francisco, CA, United States, 4Houston Methodist, Houston, TX, Houston, TX, United States, 5GE Global Research, Niskayuna, NY, United States
Synopsis
Machine learning approaches are increasingly being used to identify discriminative features derived from functional connectome data that best separate a diseased group from healthy cohorts. Here, we propose a novel framework for longitudinal prediction of disease outcome, using a combination of unsupervised and supervised learning approaches. Using this framework, we achieve 81% accuracy for prediction of mild traumatic brain injury outcome at 3-months by learning features from functional connectomes at the acute stage of injury (<1 week).
Purpose
Functional connectivity metrics derived from resting state functional MRI (rs-fMRI) have been shown to be associated with behavior and disease. Recently, machine learning and deep learning techniques have proven to be useful in various classification and prediction problems. However, in resting state connectomics, the number of metrics (features) from the connectivity matrix are typically much greater than the number of subjects (data points) which causes an over-fitting problem. We present a framework to meaningfully analyze connectomics from rs-fMRI using Restricted Boltzmann machine (RBM)1 and Random Forests (RF)2 methods. We validate the method in mild traumatic brain injury patients to predict 3-month patient outcome from initial (3-day) rs-fMRI scan. We achieve 81% prediction accuracy for recovery from mild traumatic brain injury (mTBI) using this framework.Methods
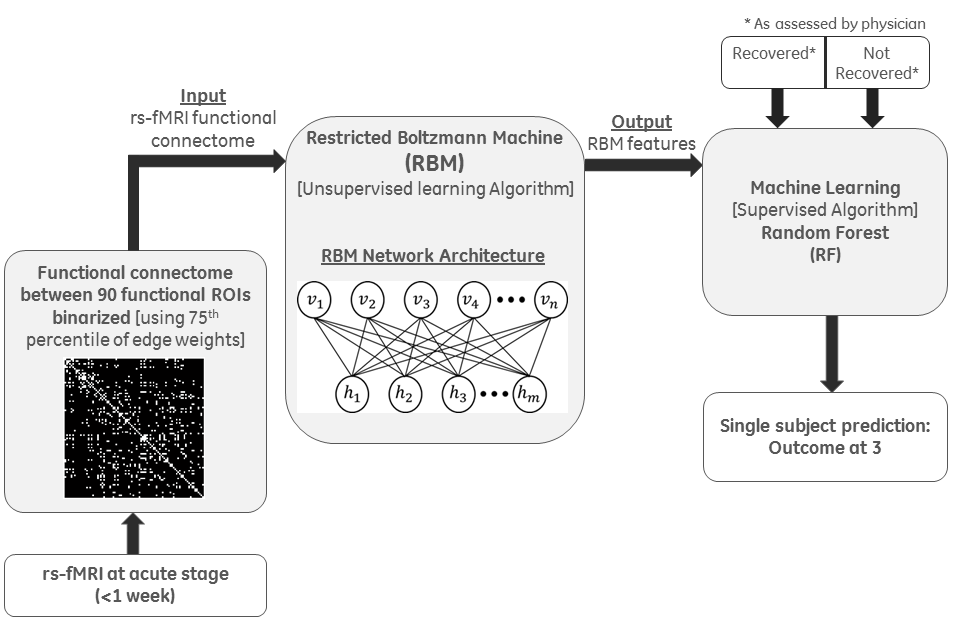
MRI Data: After obtaining informed consent, rs-fMRI was recorded from 55 patients at four time points (3 days, 7 days, 3 weeks, and 3 months) post mTBI. Using GE 3T MRI scanner, multi-band (acceleration factor 3) 2D-EPI, TR/TE = 900/30 ms was acquired for 6 minutes (395 volumes), with 1.875mm isotropic in-plane resolution and 3mm slice thickness to cover the whole brain. T1-weighted scan (1mm resolution) was acquired at each time point. rs-fMRI data were motion corrected, (rigid) registered to corresponding T1-weighted image, (non-rigid) registered to MNI atlas, nuisance removed using aCompCor3, spatially smoothed using Gaussian filter (FWHM 4mm) and temporally band-pass filtered (0.01- 0.1 Hz) using custom-built software. Mean time-courses using all voxels within each of the 90 functional ROIs4 were computed. Correlation coefficients were computed between every pair of mean time courses, producing a 90x90 functional connectome matrix. The correlation matrix was binarized using a threshold of 75th percentile of edge weights. Based on the symptom component of the SCAT2 exam and physician assessment at 3-months, each patient was labelled as recovered (R) or not-recovered (NR). For classification and prediction, rs-fMRI data from only the acute time points (<7 days) were used in this study.
Classification and Prediction: The framework consists of two steps: (1) Unsupervised dimensionality reduction, using generative deep learning algorithm RBM1 that performs a nonlinear compression of the input features followed by (2) Supervised machine learning method, using RF2 for classification of the disease (Fig. 1). RBM provides an energy-compact and de-noised mapping of the feature matrix to a lower dimensional space, overcoming the issue of overfitting. RBM network architecture (Fig.1) consists of a bipartite graphical model where the input layer does a probabilistic activation of the output layer using a nonlinear energy function. Reconstruction of the input layer follows the same logic. Weights were optimized over several iterations of the construction and reconstruction of the two layers. The number of hidden units was always set to be lower than the number of input nodes for dimensionality reduction. The compressed features from RBM along with the class labels (R or NR) were given as inputs to the RF classifier, for predicting labels (R or NR) for a test patient cohort at 3-months post-injury.
Experiments and Results
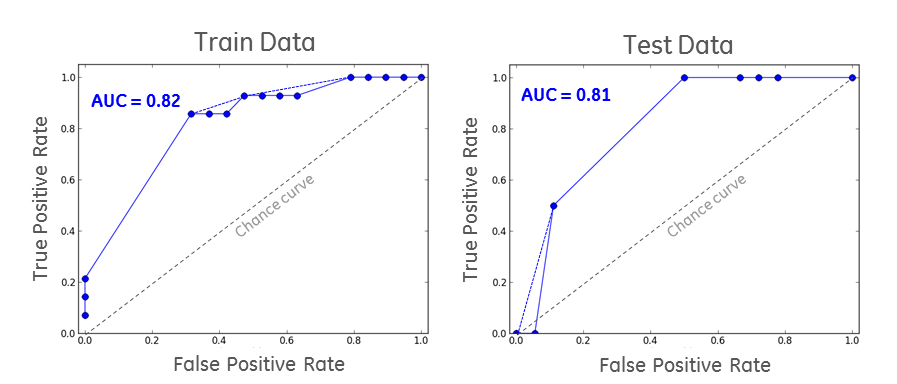
Among the 55 subjects, 33 subjects (19 R and 14 NR) are used for training and 22 subjects (18 R and 4 NR) for testing. Based on performance from multiple experiments, the hyper parameters of RBM were set as learning rate=0.15, number of hidden nodes=20, and the number of iterations=20 to obtain convergence. For RF we set the number of trees=25 and depth=4. Since the number of data sets in the two classes were not balanced, Area Under the Curve (AUC) was used as the gold standard for assessing the classification performance. We estimated goodness-of-fit of the model on the trained data and obtained an AUC of 82% (Fig.2). There was no overlap between train and test data, and the AUC for test data was 81% (Fig.2). All the NR cases in testing were correctly classified. The training and testing AUCs were comparable, which showed that there was no overfitting.Conclusions
Here, we propose a novel framework for classification (or prediction) from rs-fMRI connectomics using a combination of unsupervised deep learning method and supervised learning methods. The framework solves the number of features >> number of subjects problem in learning methods while using rs-fMRI connectomics. Though we have used RBM in this study, other deep-learning dimensionality reduction techniques like auto-encoders and deep-belief networks could potentially be used for this problem. While we have applied this to mTBI, this framework could easily be extended for longitudinal disease prediction in other neurological disorders.Acknowledgements
No acknowledgement found.References
1. Hinton G. E., Osindero S., Teh Y. W. (2006). A fast learning algorithm for deep belief nets. Neural Comput. 18, 1527–1554 10.1162/neco.2006.18.7.1527
2. Criminisi A. and Shotton J., Med. Comp. Vis. Recog. Tech. Appl. In Med. Imag., pp. 106 –117, 2011
3. Behzadi, Y., Restom, K., Liau, J. & Liu, T. T. A component based noise correction method (CompCor) for BOLD and perfusion based fMRI. NeuroImage 37, 90-101, (2007).
4. Shirer, W. R., Ryali, S., Rykhlevskaia, E., Menon, V. & Greicius, M. D. Decoding subject-driven cognitive states with whole-brain connectivity patterns. Cerebral cortex 22, 158-165, doi:10.1093/cercor/bhr099 (2012).
Figures