0242
Functional Neuroimaging in the Brain using Magnetic Resonance Elastography1Radiology, Brigham & Women's Hospital, Boston, MA, United States, 2Harvard Medical School, Boston, MA, United States, 3Biomedical Engineering, Boston University, Boston, MA, United States, 4Mechanical Engineering, Boston University, Boston, MA, United States, 5Physics, University of Erlangen-Nuremberg, Erlangen, Germany, 6Biomedical Engineering, Kings College London, London, United Kingdom
Synopsis
Using electrical stimulation of the hind limb, Magnetic Resonance Elastography (MRE) was used to observe localized changes in the complex shear modulus G=G’ + iG’’ of the mouse brain cortex. “Stimulation” and “no stimulation” paradigms were alternated every 10s to avoid habituation. An average increase of ~14% in G’ was observed whereas no significant change was seen for G’’. The effect was observed in six of seven mice studied. The mechanism responsible for this effect is hypothesized to be due to calcium influx into the neuronal cells.
Introduction and Purpose
The purpose is to determine if activation of a localized region of the mouse cortex by remote stimulus produces changes in that tissue’s shear modulus. It was motivated by two earlier observations, one in mouse1 and one in human2. Both prior observations included only a single study and neither accounted for potential neuronal habituation, an issue BOLD fMRI studies has shown to be critical. The current study overcomes these limitations by demonstrating a repeatable localized functional MRE (fMRE) response using a protocol that minimizes habituation.Methods
A spin-echo MRE sequence3 was modified to allow interleaved paradigms: P1/P2 for stimulation/no stimulation. To avoid neuronal habituation, each paradigm lasts <10s. K-space acquisition was segmented with P1 and P2 applied sequentially before advancing to the next k-space segment. When switching paradigms, a dummy acquisition period of 1.8s allowed for re-establishment of hemodynamic equilibrium. Imaging parameters were: TR/TE=900/29ms; FOV=19.2mm; in-plane matrix 64x64; isotropic spatial resolution=0.3mm; 8 wave phases in x,y,z; 2 paradigms; and 9 slices; these account for 432 images with acquisition time=56min.
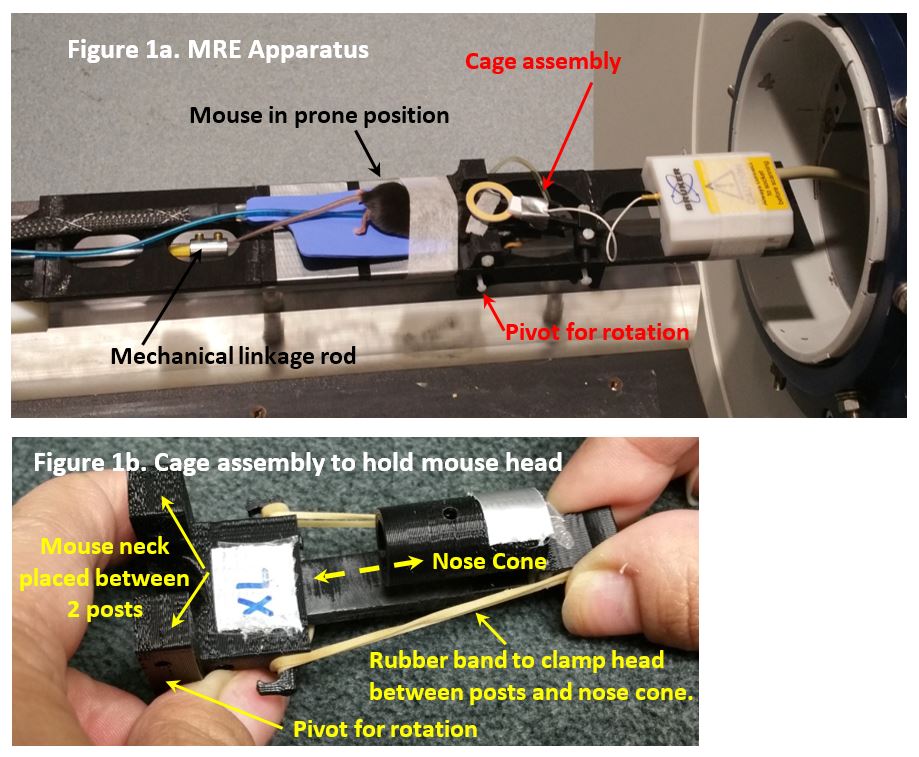
With IACUC approval, 7 wild type black mice were studied at 7T under isoflurane anesthesia. For stimulation, electric current was applied through two 30 gauge needles inserted in a hind limb: ~1mA, 3Hz, pulse width ~250ms. Two scans were serially acquired. For Scan 1, P1=stimulation and P2=no stimulation. For Scan 2, which is a control scan, P1=P2= no stimulation. The MRE apparatus, modified from an earlier version4, is described in Figure 1. Vibration frequency was 1kHz.
Two different inversions of the displacement fields to obtain elasticity maps were performed. The first method requires 3rd order derivatives. It uses the curl of the wave equation followed by algebraic inversion with a locally homogeneous approximation5. The second method assumes local stiffness homogeneity but uses a FEM to reduce the order of the derivatives taken of the noisy displacement field. FEM test functions are chosen to remove boundary conditions and the pressure term.
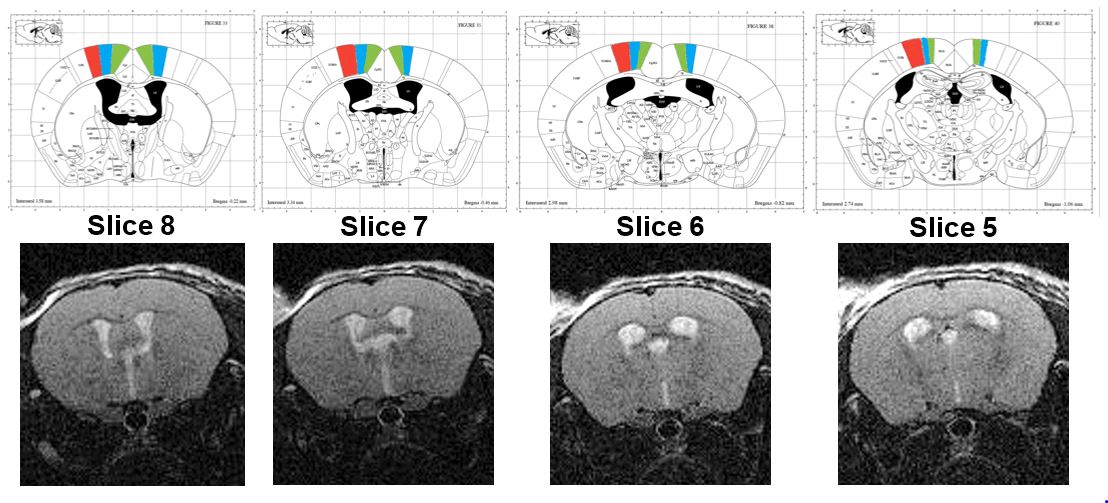
RARE images were also acquired and compared with a mouse atlas6. The shape and location of the ventricles allowed identification of anatomical regions on the RARE images that could be directly transferred to the MRE maps (Figure 2).
Results
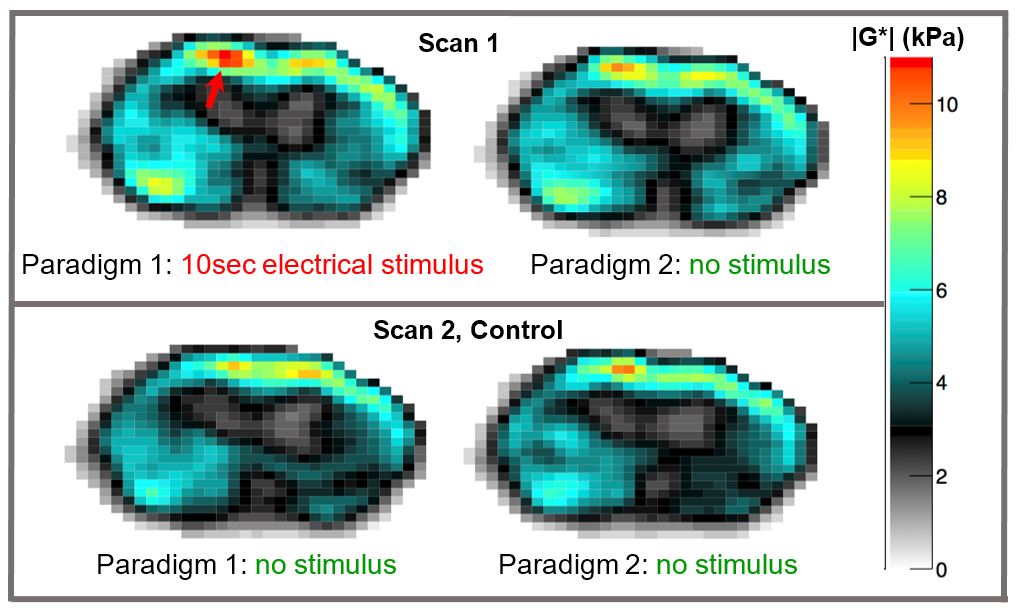
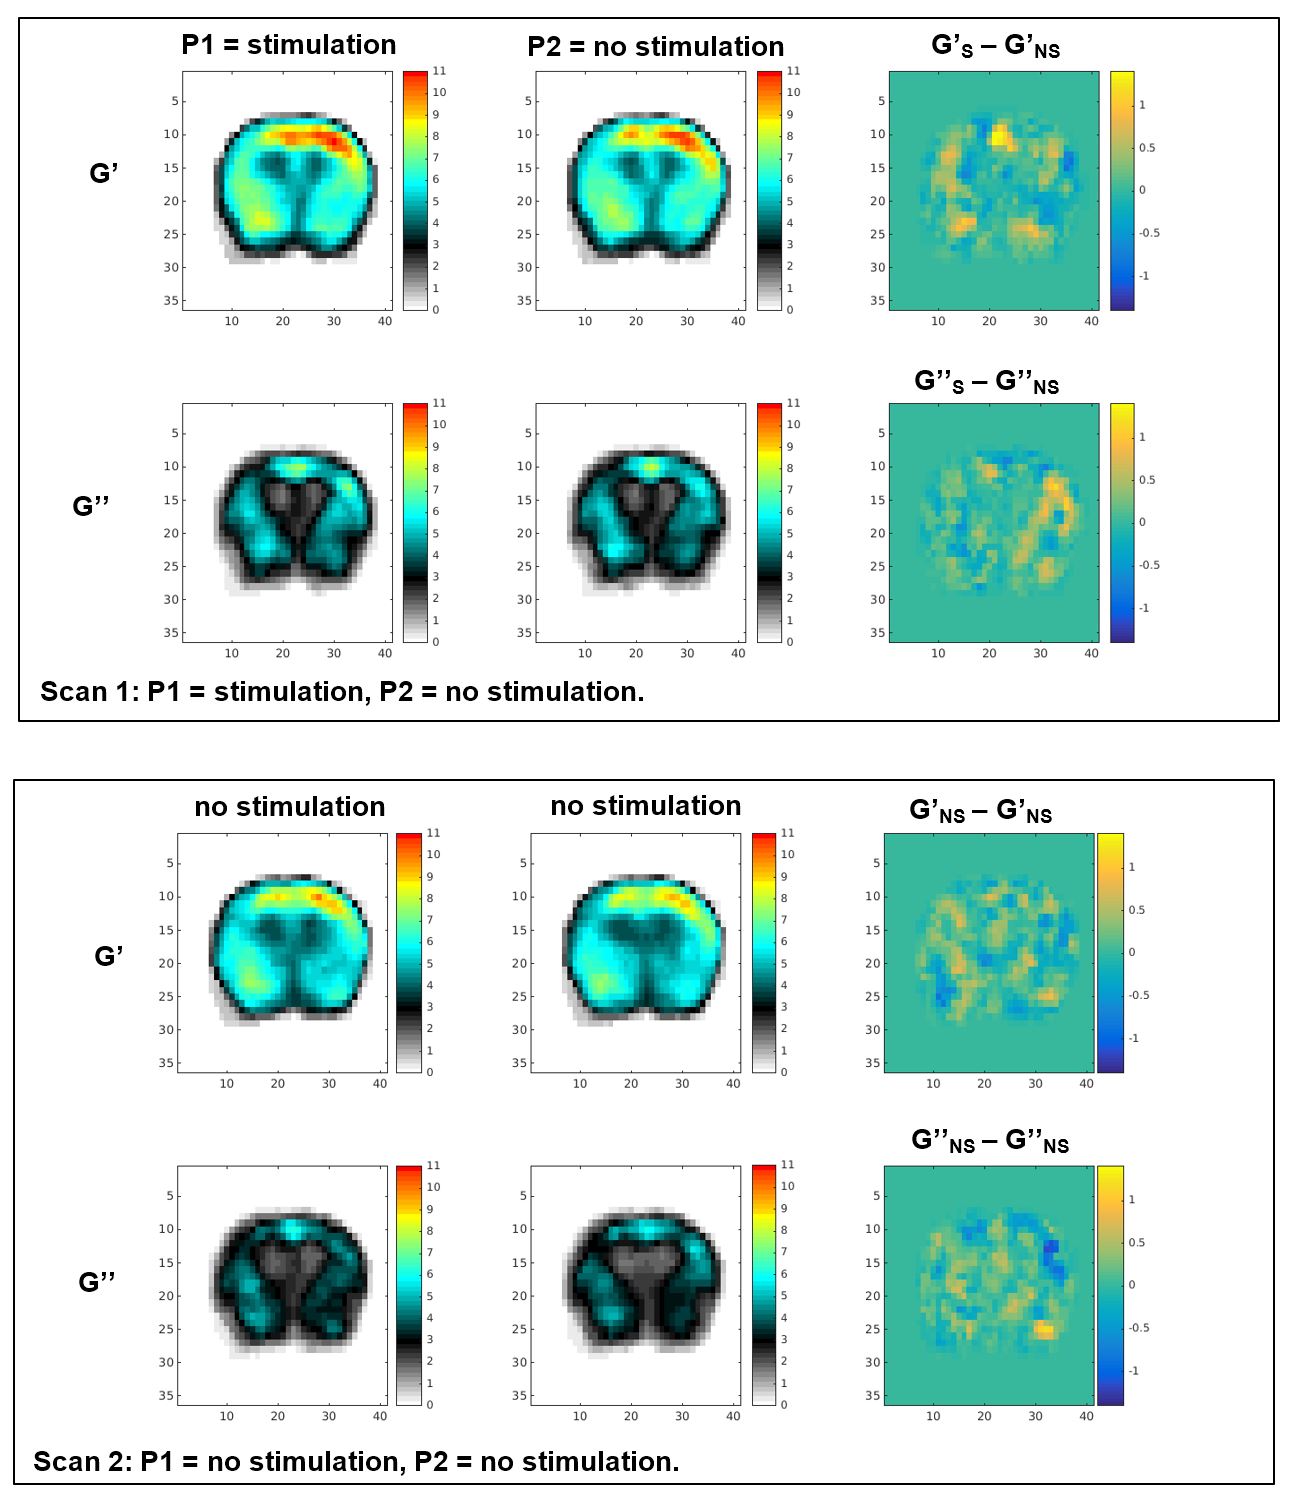
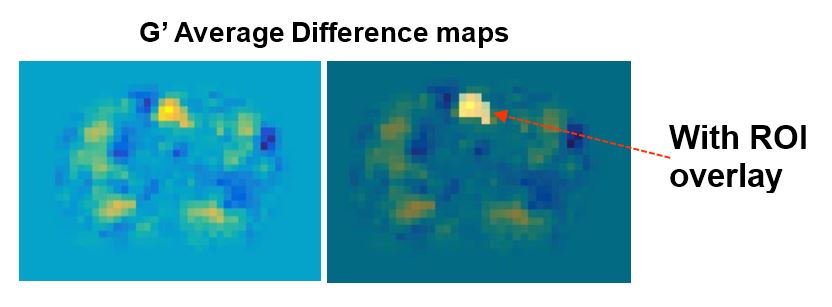
Figure 3 shows example elasticity maps. Scan 1, top row, shows a significant increase in |G| in a localized region (red arrow). Scan 2, bottom row, shows no significant difference between P1 and P2. Similar results were observed in 6 of 7 mice studied. In the 6 mice where an effect was observed, the elasticity maps were registered to a common base image and averaged (Figure 4). A 12 voxel ROI (Figure 5) was used to outline the area of increased G. Using “S” and “NS” to denote stimulation and no stimulation, the mean and SEM for the ROI in the registered images is as follows. Scan 1: interleaved S/NS: GS’=9.17 ± 0.22 kPa / GNS’=8.06 ± 0.20 kPa; GS’’=6.47 ± 0.22 kPa / GNS’’=6.55 ± 0.20 kPa corresponding to a mean difference of 13.7% in G’ and an insignificant difference in G’’. For the control Scan 2: interleaved NS/NS, GNS’=7.60 ± 0.16 kPa / GNS’=7.34 ± 0.14 kPa; GNS’’=5.30 ± 0.16 kPa / GNS’’=5.03 ± 0.14 kPa corresponding to insignificant differences for both storage and loss moduli.
Both the curl and FEM methods produced similar results showing a stiffening with stimulation. The statistics stated here used the FEM data, which produced slightly sharper images.
Discussion and Conclusion
Our results show a strong, statistically significant, highly localized increase in cortical stiffness with hind limb stimulation. This suggests MR elastography may be an exquisitely sensitive tool for functional neuroimaging. Reduction of acquisition time, however, will be essential for fMRE to become a useful tool.
To explain our results, consider two mechanisms in the neuronal cascade, Ca++ influx and CBF increase. Regarding Ca++, AFM data shows activation of NMDA receptors in cortical neurons, which opens Ca++ channels and “caused an abrupt increase in G' due to elevated hydrostatic pressure inside neurons”.7 This is an effective repartitioning of intra-vs-extra-cellular water. Another study in kidney cells shows a large increase in stiffness due to acto-myosin activation after after opening Ca++ channels8. Both studies support Ca++ influx as a mechanism to increase neuronal stiffness. From the fMRI literature, increased CBF is known to occur with functional stimulation9. Recent ex vivo placenta data shows a marked stiffness increase after vasoconstrictor administration10. This has the opposite sign to explain an increase in stiffness with increased flow. We thus hypothesize Ca++ influx is the mechanism behind our observations. Future work will explore this mechanism.
Acknowledgements
NIH R21 EB030757, European Commission H2020, Brigham & Women's Hospital - Boston University Training Grant.References
1. Patz S, Schregel K, Muradyan I, Kyriazis A, Wuerfel J, Mukundan S, Sinkus S. Observation of Functional Magnetic Resonance Elastography (fMRE) in Mouse Brain, ISMRM 2015.
2. Holub O, Lambert O, Schregel K, Bilston L, Patz S, Sinkus R. Finger tapping experiment observed by brain Magnetic Resonance Elastography, ISMRM 2015.
3. Garteiser P, Sahebjavaher RS, Ter Beek LC, Salcudean S, Vilgrain V, Van Beers BE, Sinkus R. Rapid acquisition of multifrequency, multislice and multidirectional MR elastography data with a fractionally encoded gradient echo sequence. NMR Biomed 2013, 26:1326-1335. DOI: 10.1002/nmm.2958.
4. Schregel K, Wuerfel E, Garteiser P, Gemeinhardt I, Prozorovski T, Aktas O, Merz H, Petersen D, Wuerfel J, Sinkus R. Denyelination reduces brain parenchymal stiffness quantified in vivo by magnetic resonance elastography. Proc Natl Acad Sci USA, 2012,109:17,6650-6655.
5. Sinkus R, Siegmann K, Xydeas T, Tanter M, Claussen C, Fink M. MR elastography of breast lesions: understanding the solid/liquid duality can improve the specificity of contrast-enhanced MR mammography. Magn Reson Med. 2007 Dec;58(6):1135-44.
6. Paxinos G and Franklin KBJ. The Mouse Brain in Stereotaxic Coordinates. 2001: Academic Press, San Diego, CA.
7. Fang Y, Iu CYY, Lui CNP, Zou Y, Fung CKM, Li HW, Xi N, Yung KKL, Lai KWC. Investigating dynamical structural and mechanical changes of neuroblastoma cells associated with glutamate-mediated neurodegeneration. 2014, Scientific Reports 4:7074, DOI: 10.1038/srep07074.
8. Fabry B, Freitag D, Raupach C, Zierk J, Nau C. Rapid contractile activation of cells mediated by the capsaicin receptor TRPV1. American Society of Cell Biology 2007, Program 1011.
9. Brown GG, Zorilla LTE, Georgy B, Kindermann SS, Wong EC, Buxton RB. BOLD and Perfusion Response to Finger-Thumb Apposition After Acetazolamide Administration: Differential Relationship to Global Perfusion. J Cerebral Blood Flow & Metabolism 23:829-873(2003). DOI: 10.1097/01.WCB.0000071887.63724.B2.
10. Parker KJ, Ormachea J, McAleavey SA, Wood RW, Carroll-Nellenback JJ, Miller RK. Shear wave dispersion behaviors of soft, vascularized tissues from the microchannel flow model. Phys. Med. Biol. 61(2016)4890-4903.
Figures