0241
What is the neurophysiological bases of resting state functional connectivity?1National Institute on Drug Abuse, NIH, Baltimore, MD, United States, 2University of Texas Health Science Center at San Antonio, TX, United States
Synopsis
Despite wide application of resting state functional connectivity (rsFC) in systems neuroscience, fundamental aspects of rsFC remain poorly understood. Concurrent multi-channel electrophysiological recording and fMRI were performed in rat striatum along with pharmacological manipulation of VTA dopamine neuronal activity. Results suggest that LFPs of different frequency bands contribute distinctively and differentially to the observed BOLD fluctuations, and that cross-frequency phase-amplitude coupling (PAC) is the organizing mechanism through which low frequency LFPs orchestrate neural activity that underlies the BOLD rsFC. Our data imply that where there is a synchronized low frequency LFP signal, there is also resting state BOLD functional connectivity. rsFC does not necessarily reflect structural connectivity.
Purpose: Despite wide application of resting state functional connectivity (rsFC) in systems neuroscience, fundamental aspects of rsFC remain poorly understood. For example, some of the networks, such as the default mode network (DMN), have relatively widespread spatial localization, which does not center on known specific, fine anatomical structures as often observed in the evoked fMRI response (1,2). Furthermore, although most rsFC networks appear to be grounded by known anatomical connections, some prominent networks, such as the visual network covering bilateral primary visual cortex, have very weak monosynaptic connections (3,4). What is the neuronal mechanism that binds these spatially disparate and poorly connected areas together? This study aims to address these fundamental questions in a preclinical model that takes advantage of well-known striatal physiology.
Previous studies have demonstrated that medium spiny neurons (MSNs), which constitute over 90% of striatal neurons (5), exhibit prominent UP-DOWN two-state fluctuations in membrane potential (6). Striatal MSNs fire preferentially in the UP state. We hypothesize that temporal variations in UP-DOWN two-state fluctuations and resulting variations in neuronal excitability underlie spontaneous BOLD fluctuations.
In the present study, we developed a concurrent fMRI-electrophysiological recording technique to perform chronic repetitive recordings with microelectrode arrays covering the entire striatum from its dorsal lateral to the ventral medial domains. In addition, by agonizing the AMPA receptors within the ventral tegmental area (VTA) micro-circuitry, we systematically modulated dopamine release and neuronal activity in the striatum. Data suggest that LFPs of different frequency bands contribute distinctively and differentially to the observed BOLD fluctuations, and that cross-frequency phase-amplitude coupling (PAC) is the organizing mechanism through which low frequency LFPs orchestrate neural activity that underlies the BOLD rsFC.
Methods: Nineteen of which was used to characterize rsFC networks in the striatum; another ten animals were implanted with 16-channel electrode arrays (Neuronexus) with the microelectrode contacts covering the dorsolateral and medioventral domains of the striatum, along with guide cannula for microinjection of AMPA (1μl, 100μM) into the VTA. Animals were anesthetized with low dose of isoflurane and dexmedetomidine (7). LFP were recorded with a Plexon System. fMRI data were acquired on a Bruker 9.4T system using single-shot EPI sequence (TR=1.5s, TE=13ms, FOV = 3×3cm2, matrix=64×64). We developed an algorithm to correct for MRI-induced artifacts in LFP recordings. PAC effects were quantified by calculating “Envelope-to-Signal” coupling (8). LFP signal was divided into 6 classical frequency bands (δ:1-4Hz; θ:5-8 Hz; α:9-14Hz; β:15-30; γ:30-50; high γ:70-100Hz). Band-limited power time courses were used as the reference functions to correlate with fMRI signal on a voxel-wise basis. To study the temporal AMPA modulation effects on functional connectivity, we divided pre-AMPA baseline and post-AMPA LFP-fMRI data into 5 time windows (7.5 min each). Statistical program 3dLME in AFNI was applied to analyze AMPA modulation effects across time. A p<0.05 were considered significant after corrections for multiple comparisons based on 3dClustSim program in AFNI.
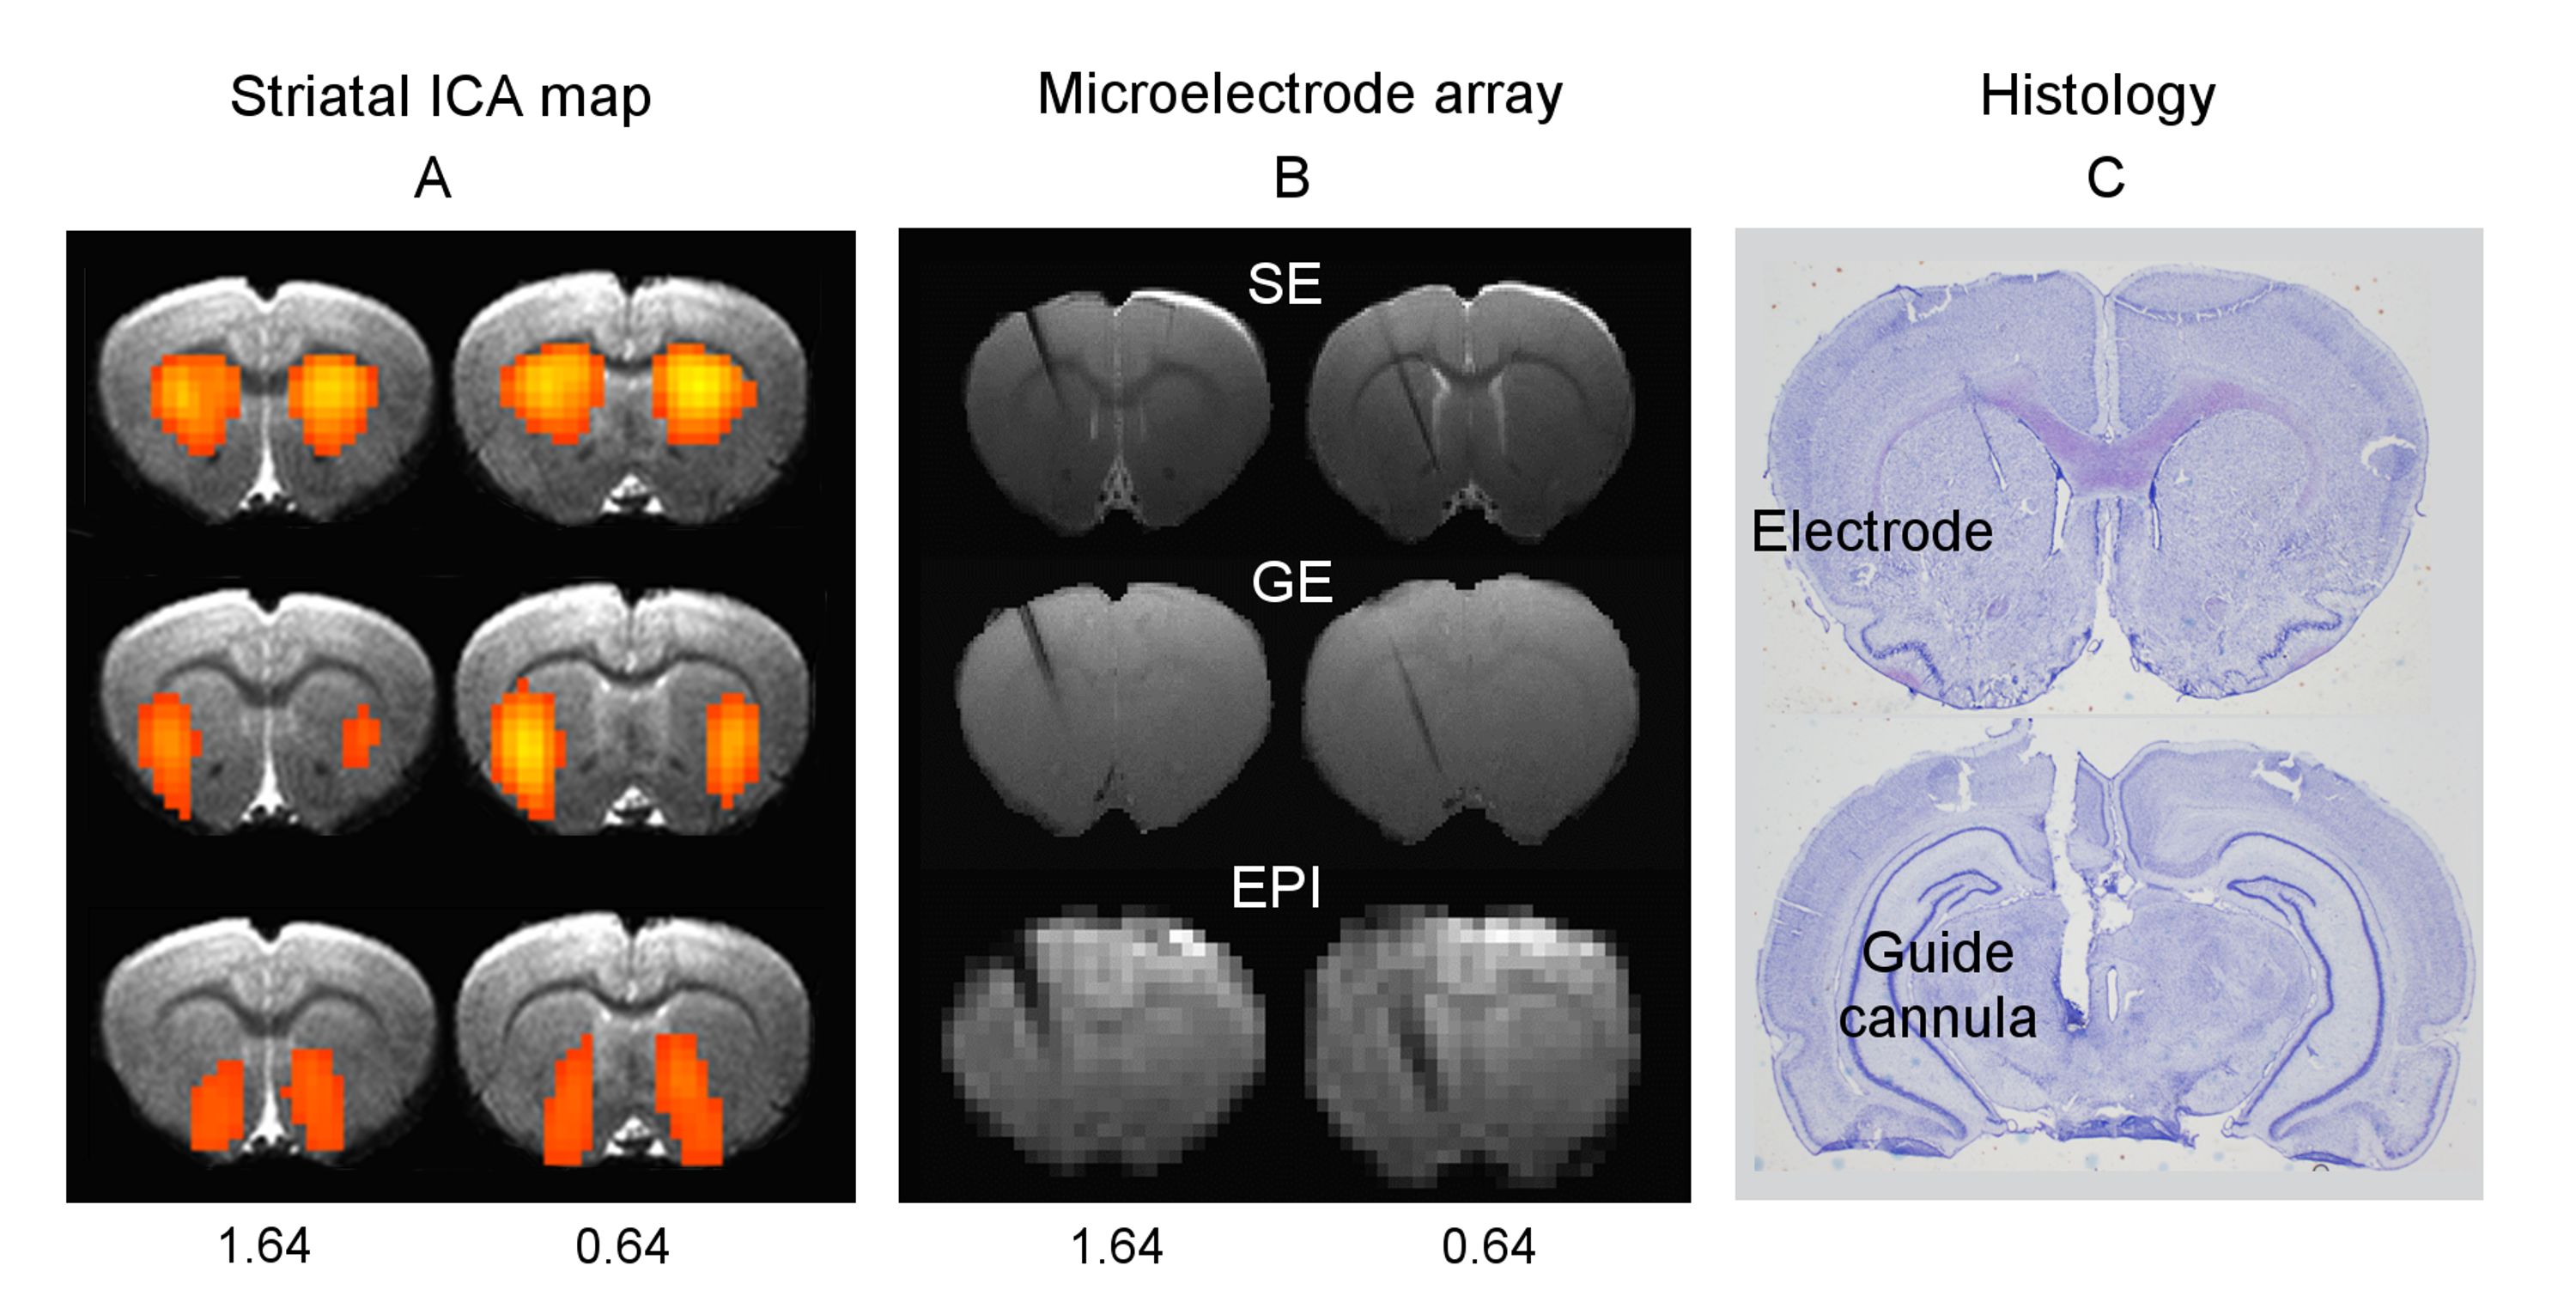
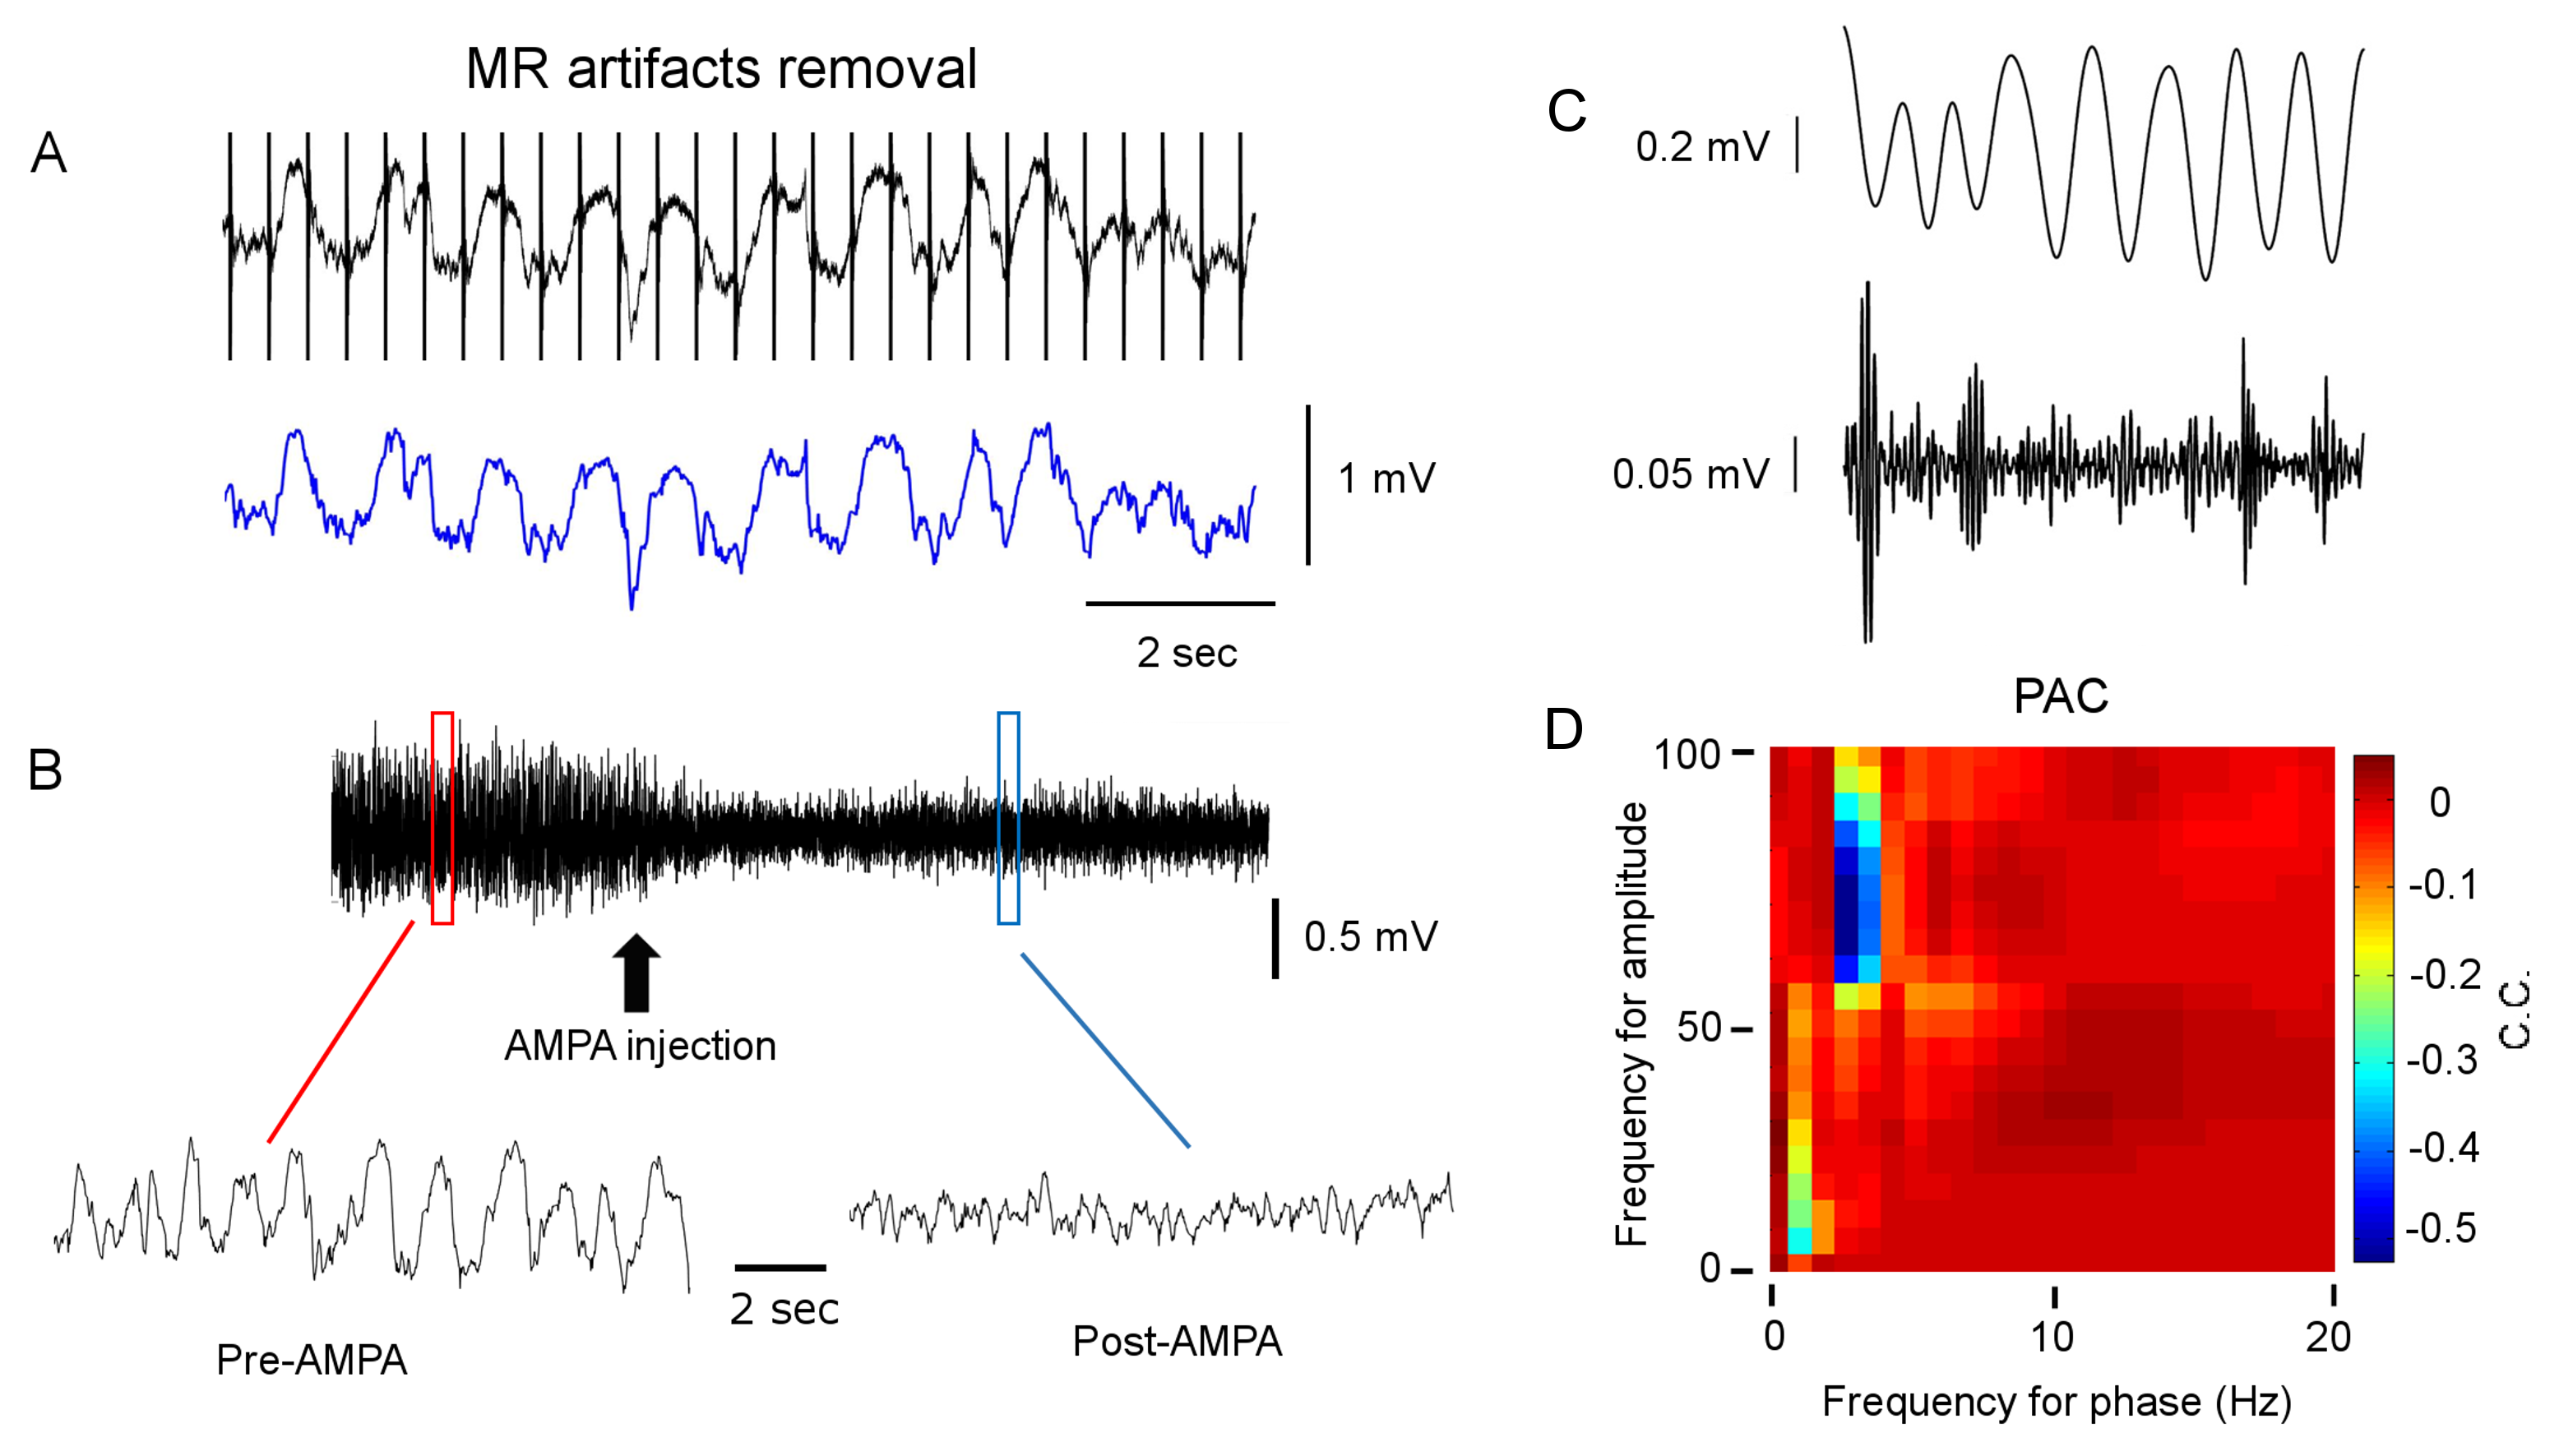
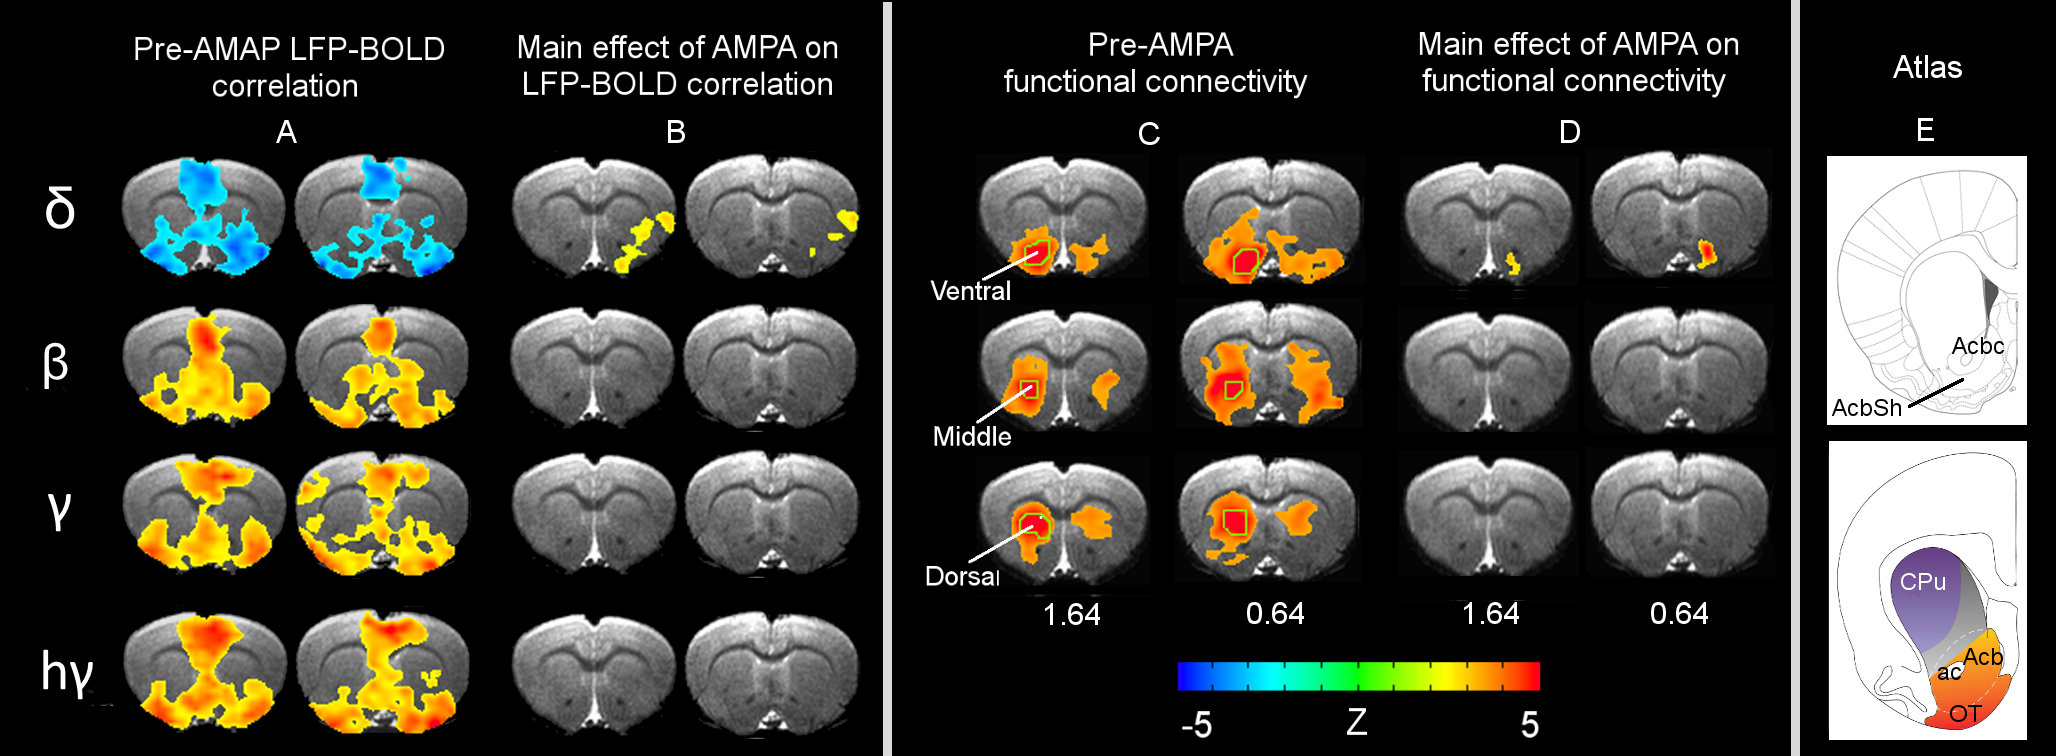
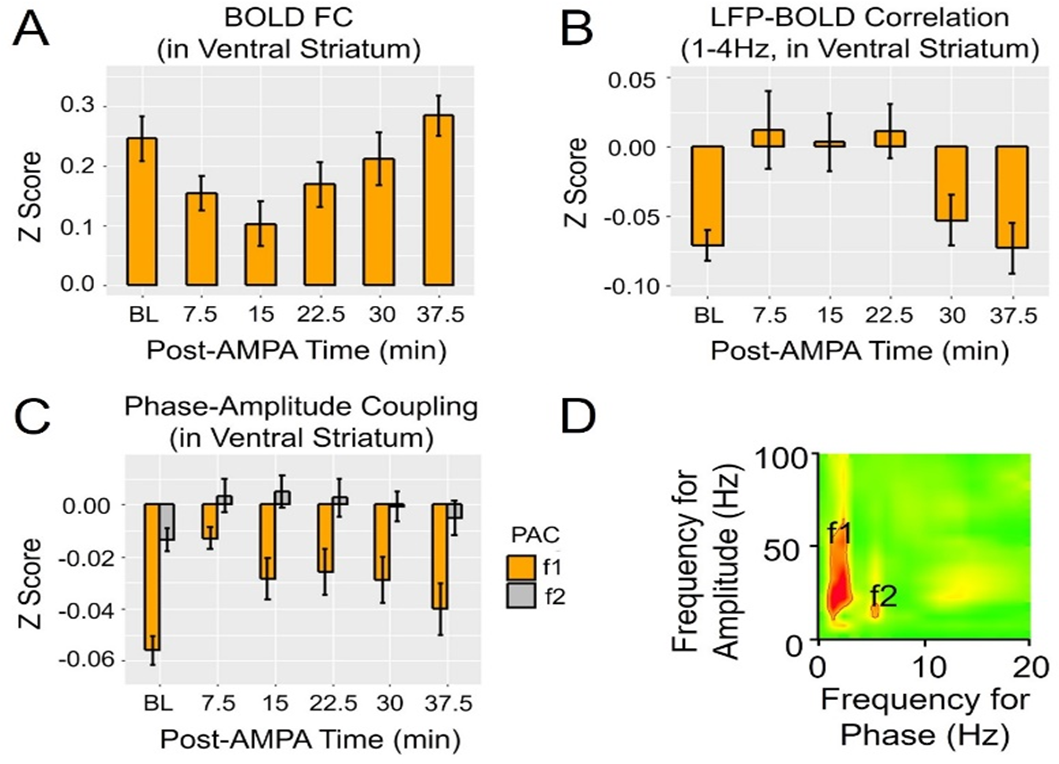
Results: Figure 1A shows striatal functional connectivity derived from group ICA (N=19 rats, 58 scan sessions). The three components roughly overlap with the three striatal domains previously depicted (9). They are also very similar to that previously identified in awake marmosets by our lab (10), suggesting that these functional connectivity patterns are conserved across species, and are not significantly affected by the anesthesia regimen. Intriguingly, there is virtually no monosynaptic connections between the bilateral striatum (11). Figure 1B shows MRI images following microelectrode implantation, along with histological confirmation (Fig. 1C).Figures 2A-B illustrate MRI artifacts removal and the effects of VTA AMPA microinjection on striatal LFP signal. There was a robust PAC effect with the phase of δ LFP modulating the amplitude of higher frequency signal (C-D). Figure 3A shows pre-AMPA LFP-BOLD correlation maps in the δ (1-4Hz), β (15-30Hz), γ (30-50Hz) and high γ (>70Hz) frequency range. Although all bands display similar spatial correlation patterns, the δ LFP-BOLD correlation was negative, while a positive correlation was seen between the other 3 frequency bands. θ and α band LFP-BOLD correlation was marginal and is not shown. AMPA microinjections modulated the LFP-BOLD correlation only in the δ LFP-BOLD (B). Brain areas significantly modulated include the NAcc, ventral lateral striatum, and insular region.Figure 4 shows the temporal evolution of functional connectivity in the ventral striatum (A), δ LFP-BOLD (B), PAC effect (C-D).
Conclusion: Delta LFP orchestrates the LFP of other frequency bands via a PAC mechanism. Where there is a synchronized low frequency LFP signal, there is also resting state BOLD functional connectivity. Thus, rsFC does not necessarily reflect structural connectivity.
Acknowledgements
This work was supported by the Intramural Research Program at NIDA, NIH.References
1. Lu H, Patel S, Luo F, Li SJ, Hillard CJ, Ward BD, Hyde JS. Spatial correlations of laminar BOLD and CBV responses to rat whisker stimulation with neuronal activity localized by Fos expression. Magn Reson Med 2004;52(5):1060-1068.
2. Fukuda M, Moon CH, Wang P, Kim SG. Mapping iso-orientation columns by contrast agent-enhanced functional magnetic resonance imaging: Reproducibility, specificity, and evaluation by optical imaging of intrinsic signal. Journal of Neuroscience 2006;26(46):11821-11832.
3. Van Essen DC, Newsome WT, Bixby JL. The pattern of interhemispheric connections and its relationship to extrastriate visual areas in the macaque monkey. J Neurosci 1982;2(3):265-283.
4. Vincent J, Patel G, Fox M, Snyder A, Baker J, Van Essen D, Zempel J, Snyder L, Corbetta M, Raichle M. Intrinsic functional architecture in the anaesthetized monkey brain. Nature 2007;447(7140):83-86.
5. Gerfen CR. Synaptic organization of the striatum. J Electron Microsc Tech 1988;10(3):265-281. 6. Stern EA, Jaeger D, Wilson CJ. Membrane potential synchrony of simultaneously recorded striatal spiny neurons in vivo. Nature 1998;394(6692):475-478.
7. Lu H, Zou Q, Gu H, Raichle ME, Stein EA, Yang Y. Rat brains also have a default mode network. Proc Natl Acad Sci U S A 2012;109(10):3979-3984.
8. Onslow AC, Bogacz R, Jones MW. Quantifying phase-amplitude coupling in neuronal network oscillations. Prog Biophys Mol Biol 2011;105(1-2):49-57.
9. Voorn P, Vanderschuren LJ, Groenewegen HJ, Robbins TW, Pennartz CM. Putting a spin on the dorsal-ventral divide of the striatum. Trends Neurosci 2004;27(8):468-474.
10. Belcher AM, Yen CC, Stepp H, Gu H, Lu H, Yang Y, Silva AC, Stein EA. Large-scale brain networks in the awake, truly resting marmoset monkey. J Neurosci 2013;33(42):16796-16804.
11. McKenzie JS, Kemm RE, Wilcock LN. The Basal Ganglia: Structure and Function: Springer science & business media; 2013. 670 p.
Figures