0239
Optogenetic resting-state fMRI reveals thalamic modulation of long-range sensory networks1Laboratory of Biomedical Imaging and Signal Processing, The University of Hong Kong, Hong Kong, Hong Kong, 2Department of Electrical and Electronic Engineering, The University of Hong Kong, Hong Kong, Hong Kong
Synopsis
One grand challenge in contemporary neuroscience is to achieve an integrated understanding of large-scale brain-wide networks. Resting-state functional MRI (rsfMRI) has helped reveal such brain-wide networks, yet, the neural
Purpose
The brain is a highly complex, interconnected structure with parallel and hierarchical networks distributed within and between neural systems1,2. Functional connectivity mapping using resting-state functional MRI (rsfMRI) enables non-invasive visualization of brain-wide networks in humans3 and animals4 through coherent infra-slow (<0.1Hz) hemodynamic/BOLD activity. However, the exact underlying neural bases and functional significance remain unclear. Previous studies integrating large-scale electrical recordings, voltage-sensitive-dye (VSD) and Ca2+ imaging techniques5-7 imply that slow, oscillating neural activity (<1Hz) constrains and elicits these rsfMRI BOLD activity. This indicate that interrogating the brain’s underlying electrical activity can provide mechanistic insights into brain-wide rsfMRI connectivity. Numerous long-range networks exist, subserving the functions of particular systems and their interactions. One classical example is the thalamo-cortical-thalamic network, which interconnects the thalamus and neocortex via thalamo-cortical and cortico-thalamic projections8. In this study, we optogenetically stimulate ventral posteromedial thalamus (VPM) thalamocortical excitatory neurons and pharmacologically inactivate VPM thalamocortical neurons, to investigate whether modulating and/or disrupting the neural activity of such an integral brain network could uncover the neural bases of rsfMRI.Methods
Animal Preparation: AAV5-CaMKIIα::ChR2(H134R)-mCherry was injected to VPM of adult rats (n=8, 200-250g, male, SD strain). Four weeks after injection, an opaqued optical fiber cannula (d=450μm) was implanted at the injection site. In a separate group of rats (n=10, 400-450g, male, SD strain), a glass capillary tube (d=300μm) was implanted in VPM. All experiments were performed under 1.0% isoflurane.
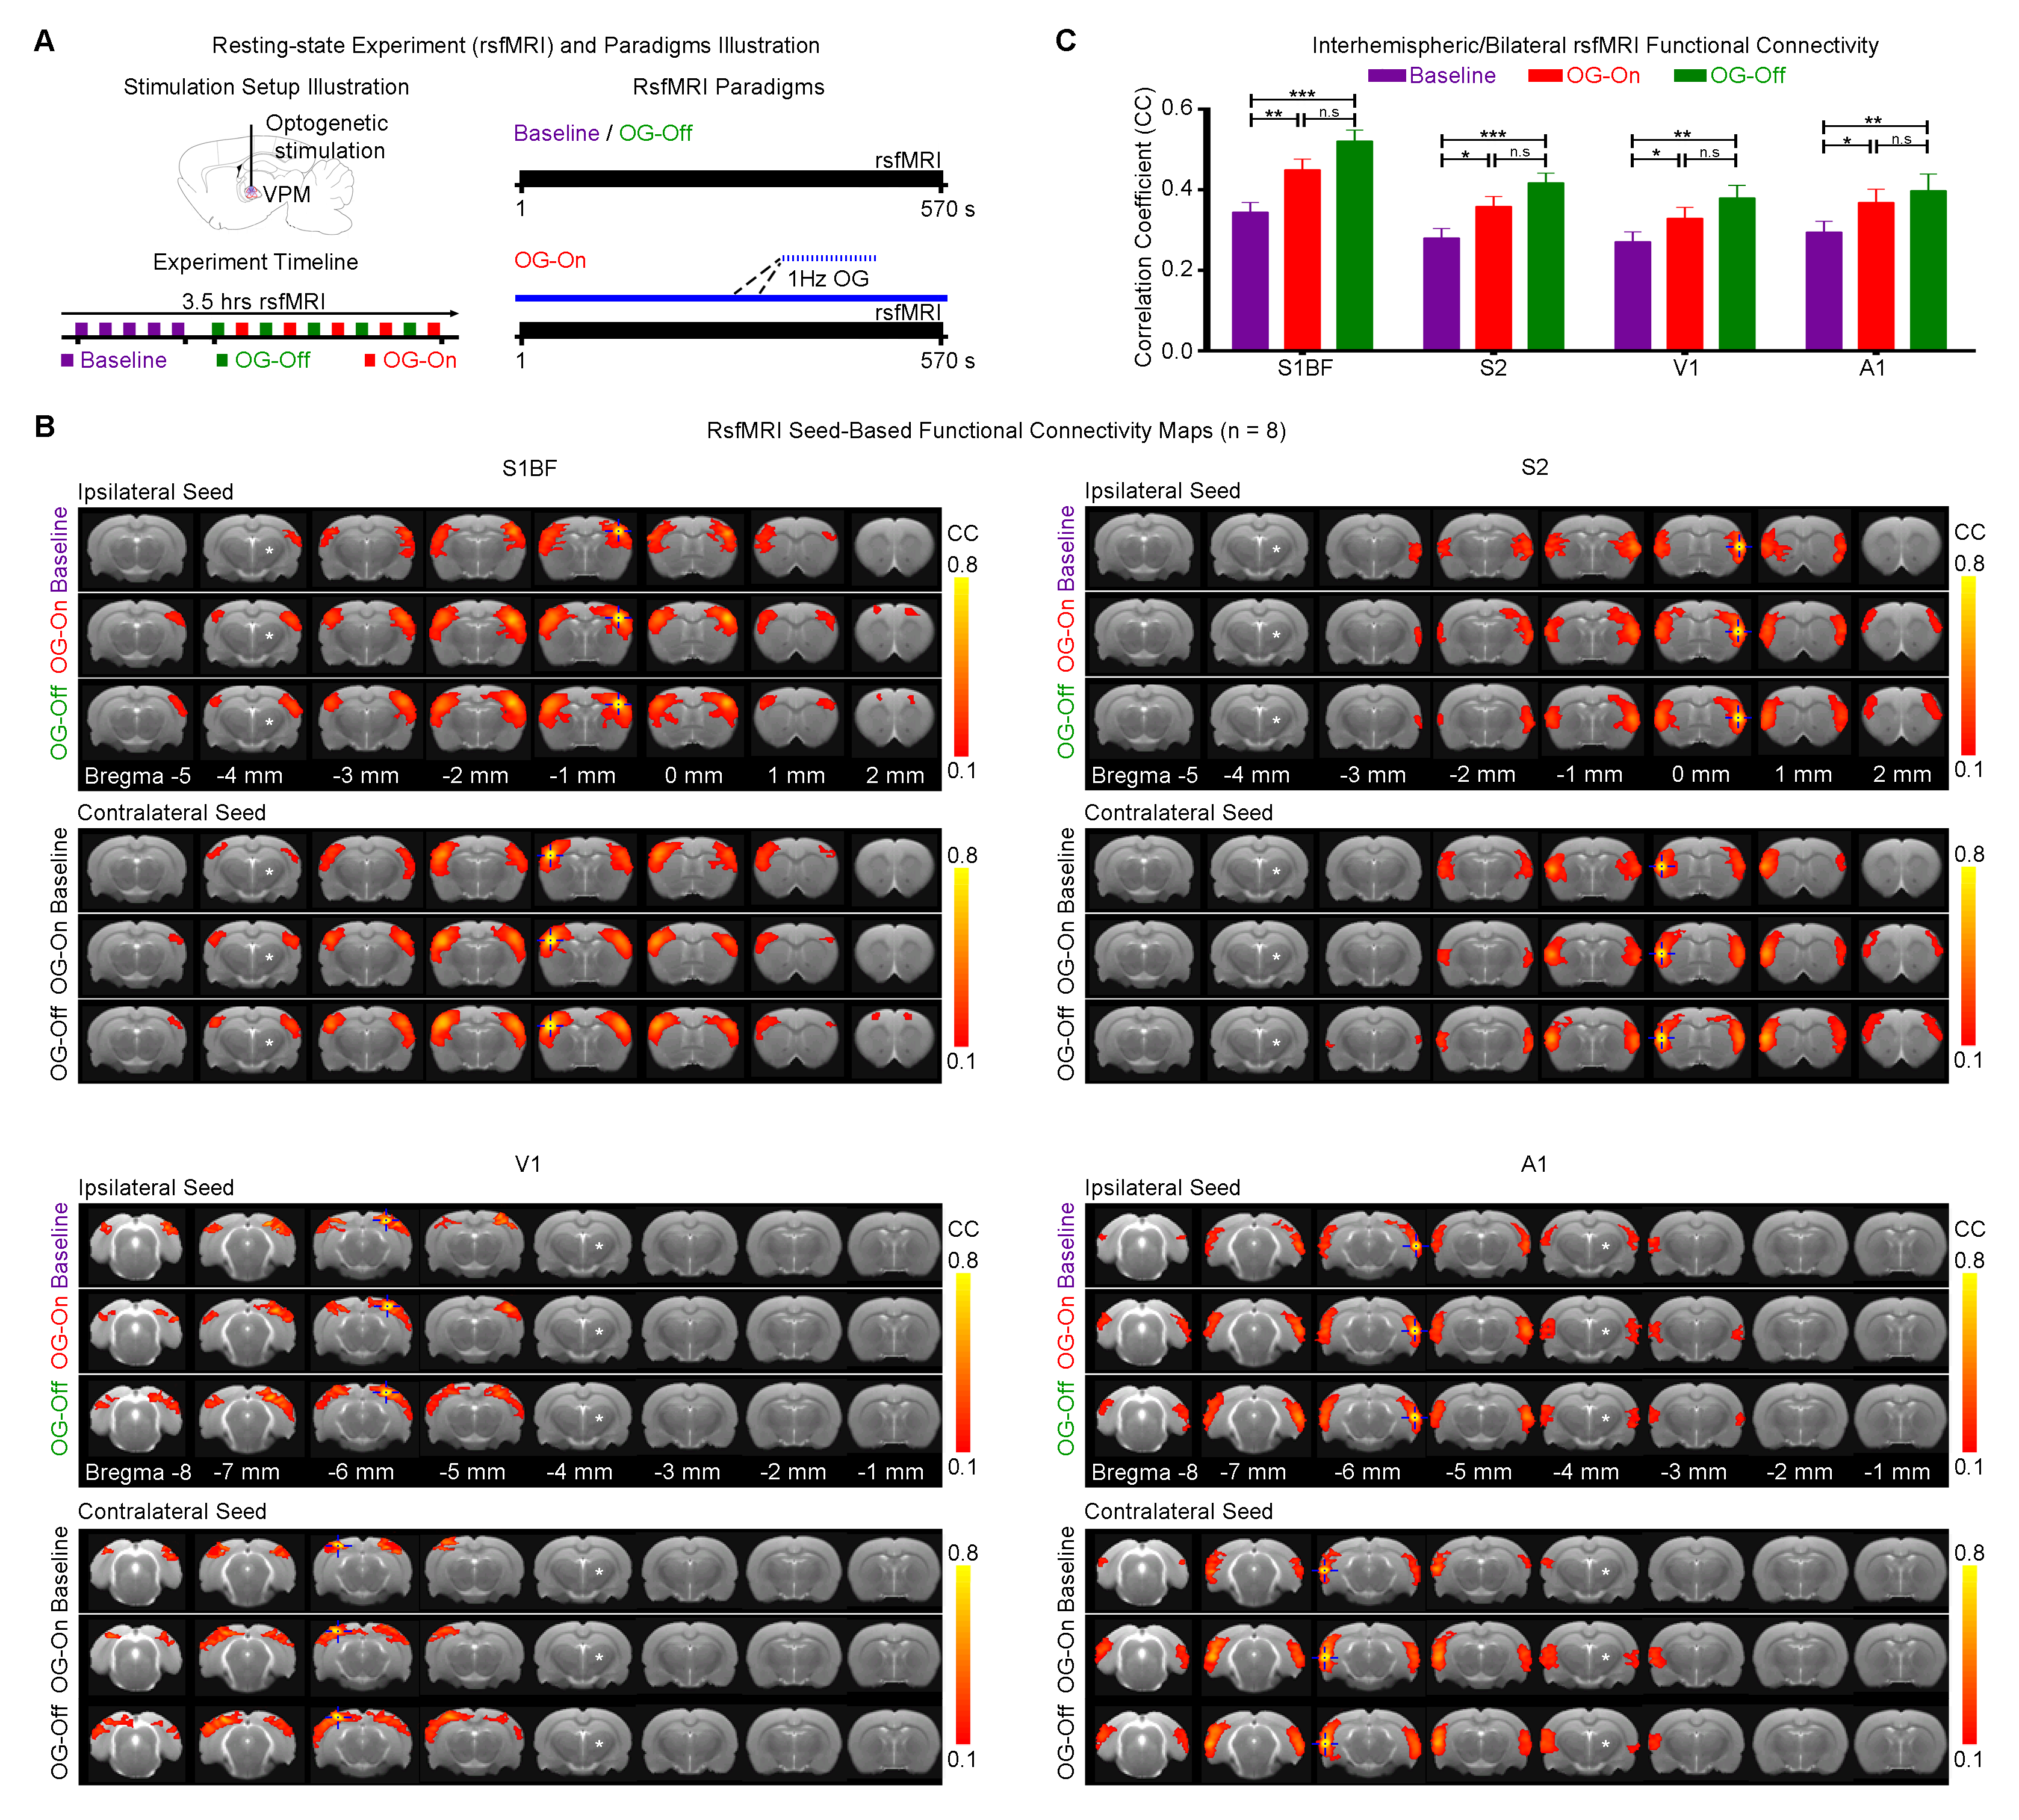
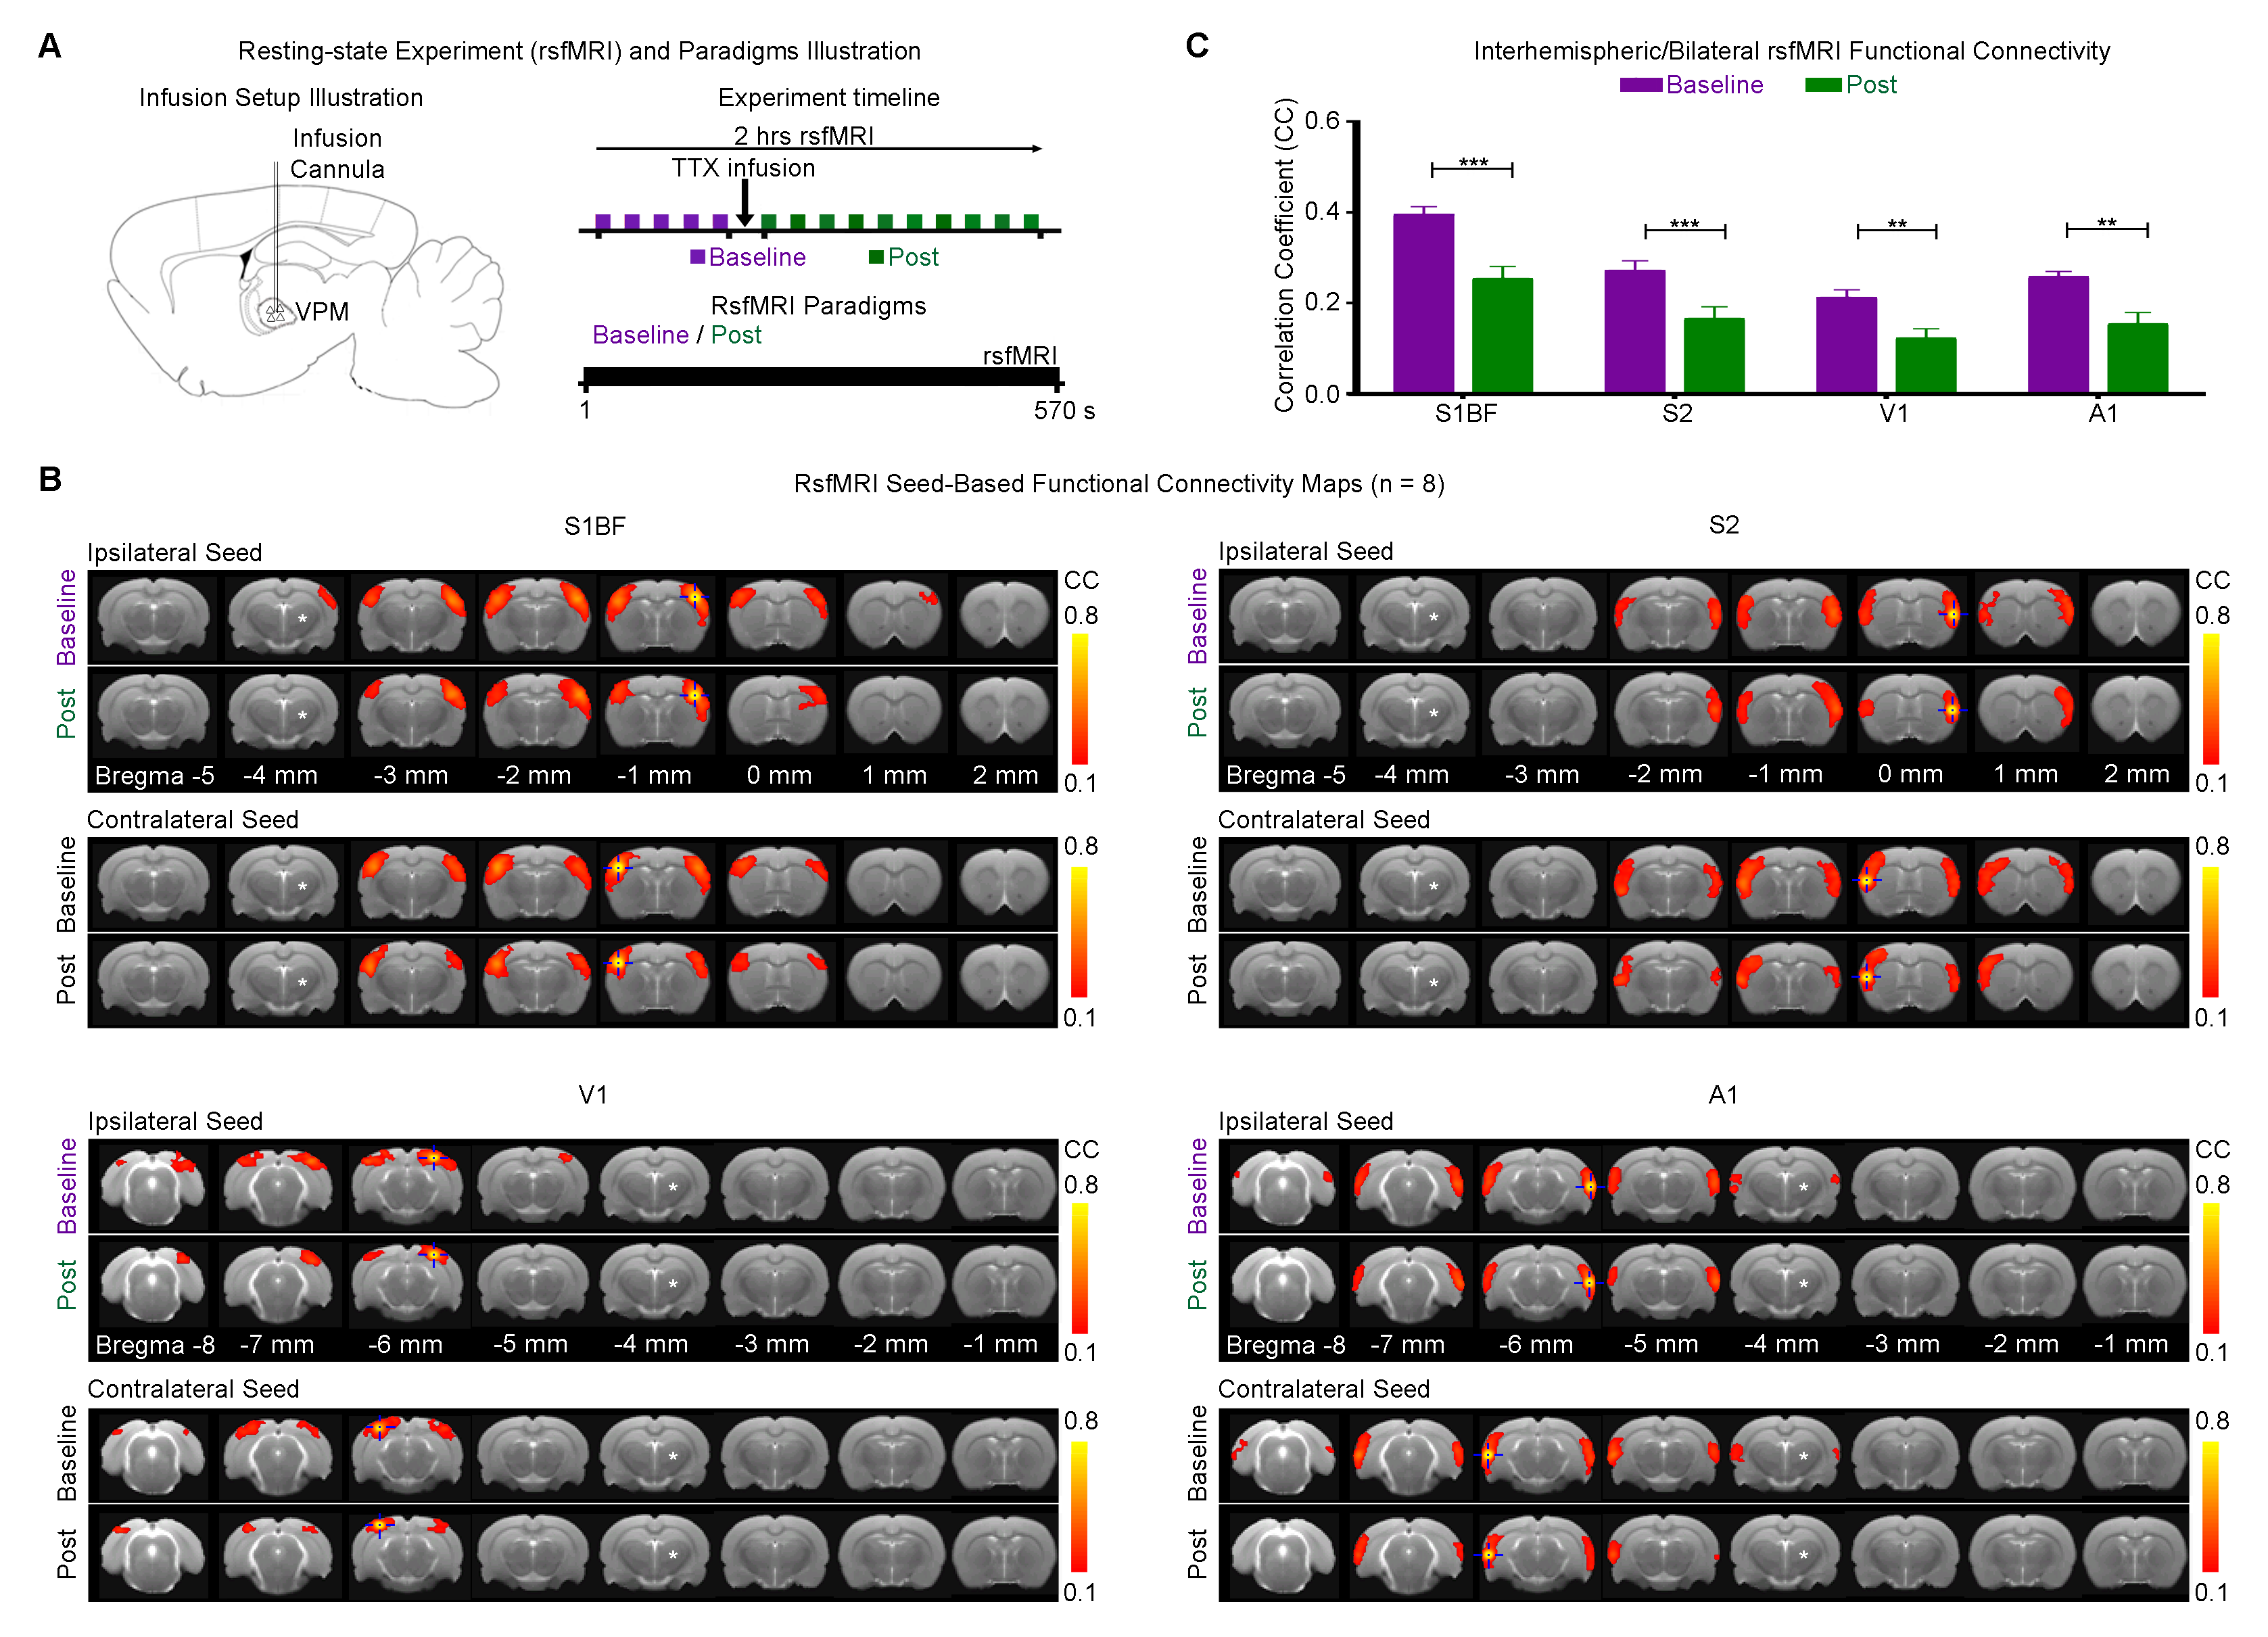
Optogenetic and Tetrodotoxin (TTX) rsfMRI Experiment: For optogenetic stimulation (OG-On), blue (473nm) light was presented continuously at 1Hz (10% duty cycle, 40mW/mm2; Figure 1A). RsfMRI scans were performed before (baseline), during (OG-On) and after (OG-Off) optogenetic stimulation. Typically, five baseline rsfMRI scans were acquired before five OG-On scans were interleaved with five OG-Off scans. For TTX infusion, 5μL (5ng/μL) was used. Typically, five rsfMRI scans were acquired before (baseline) TTX infusion and five after (Post). TTX is a neurotoxin that blocks neuronal action potentials.
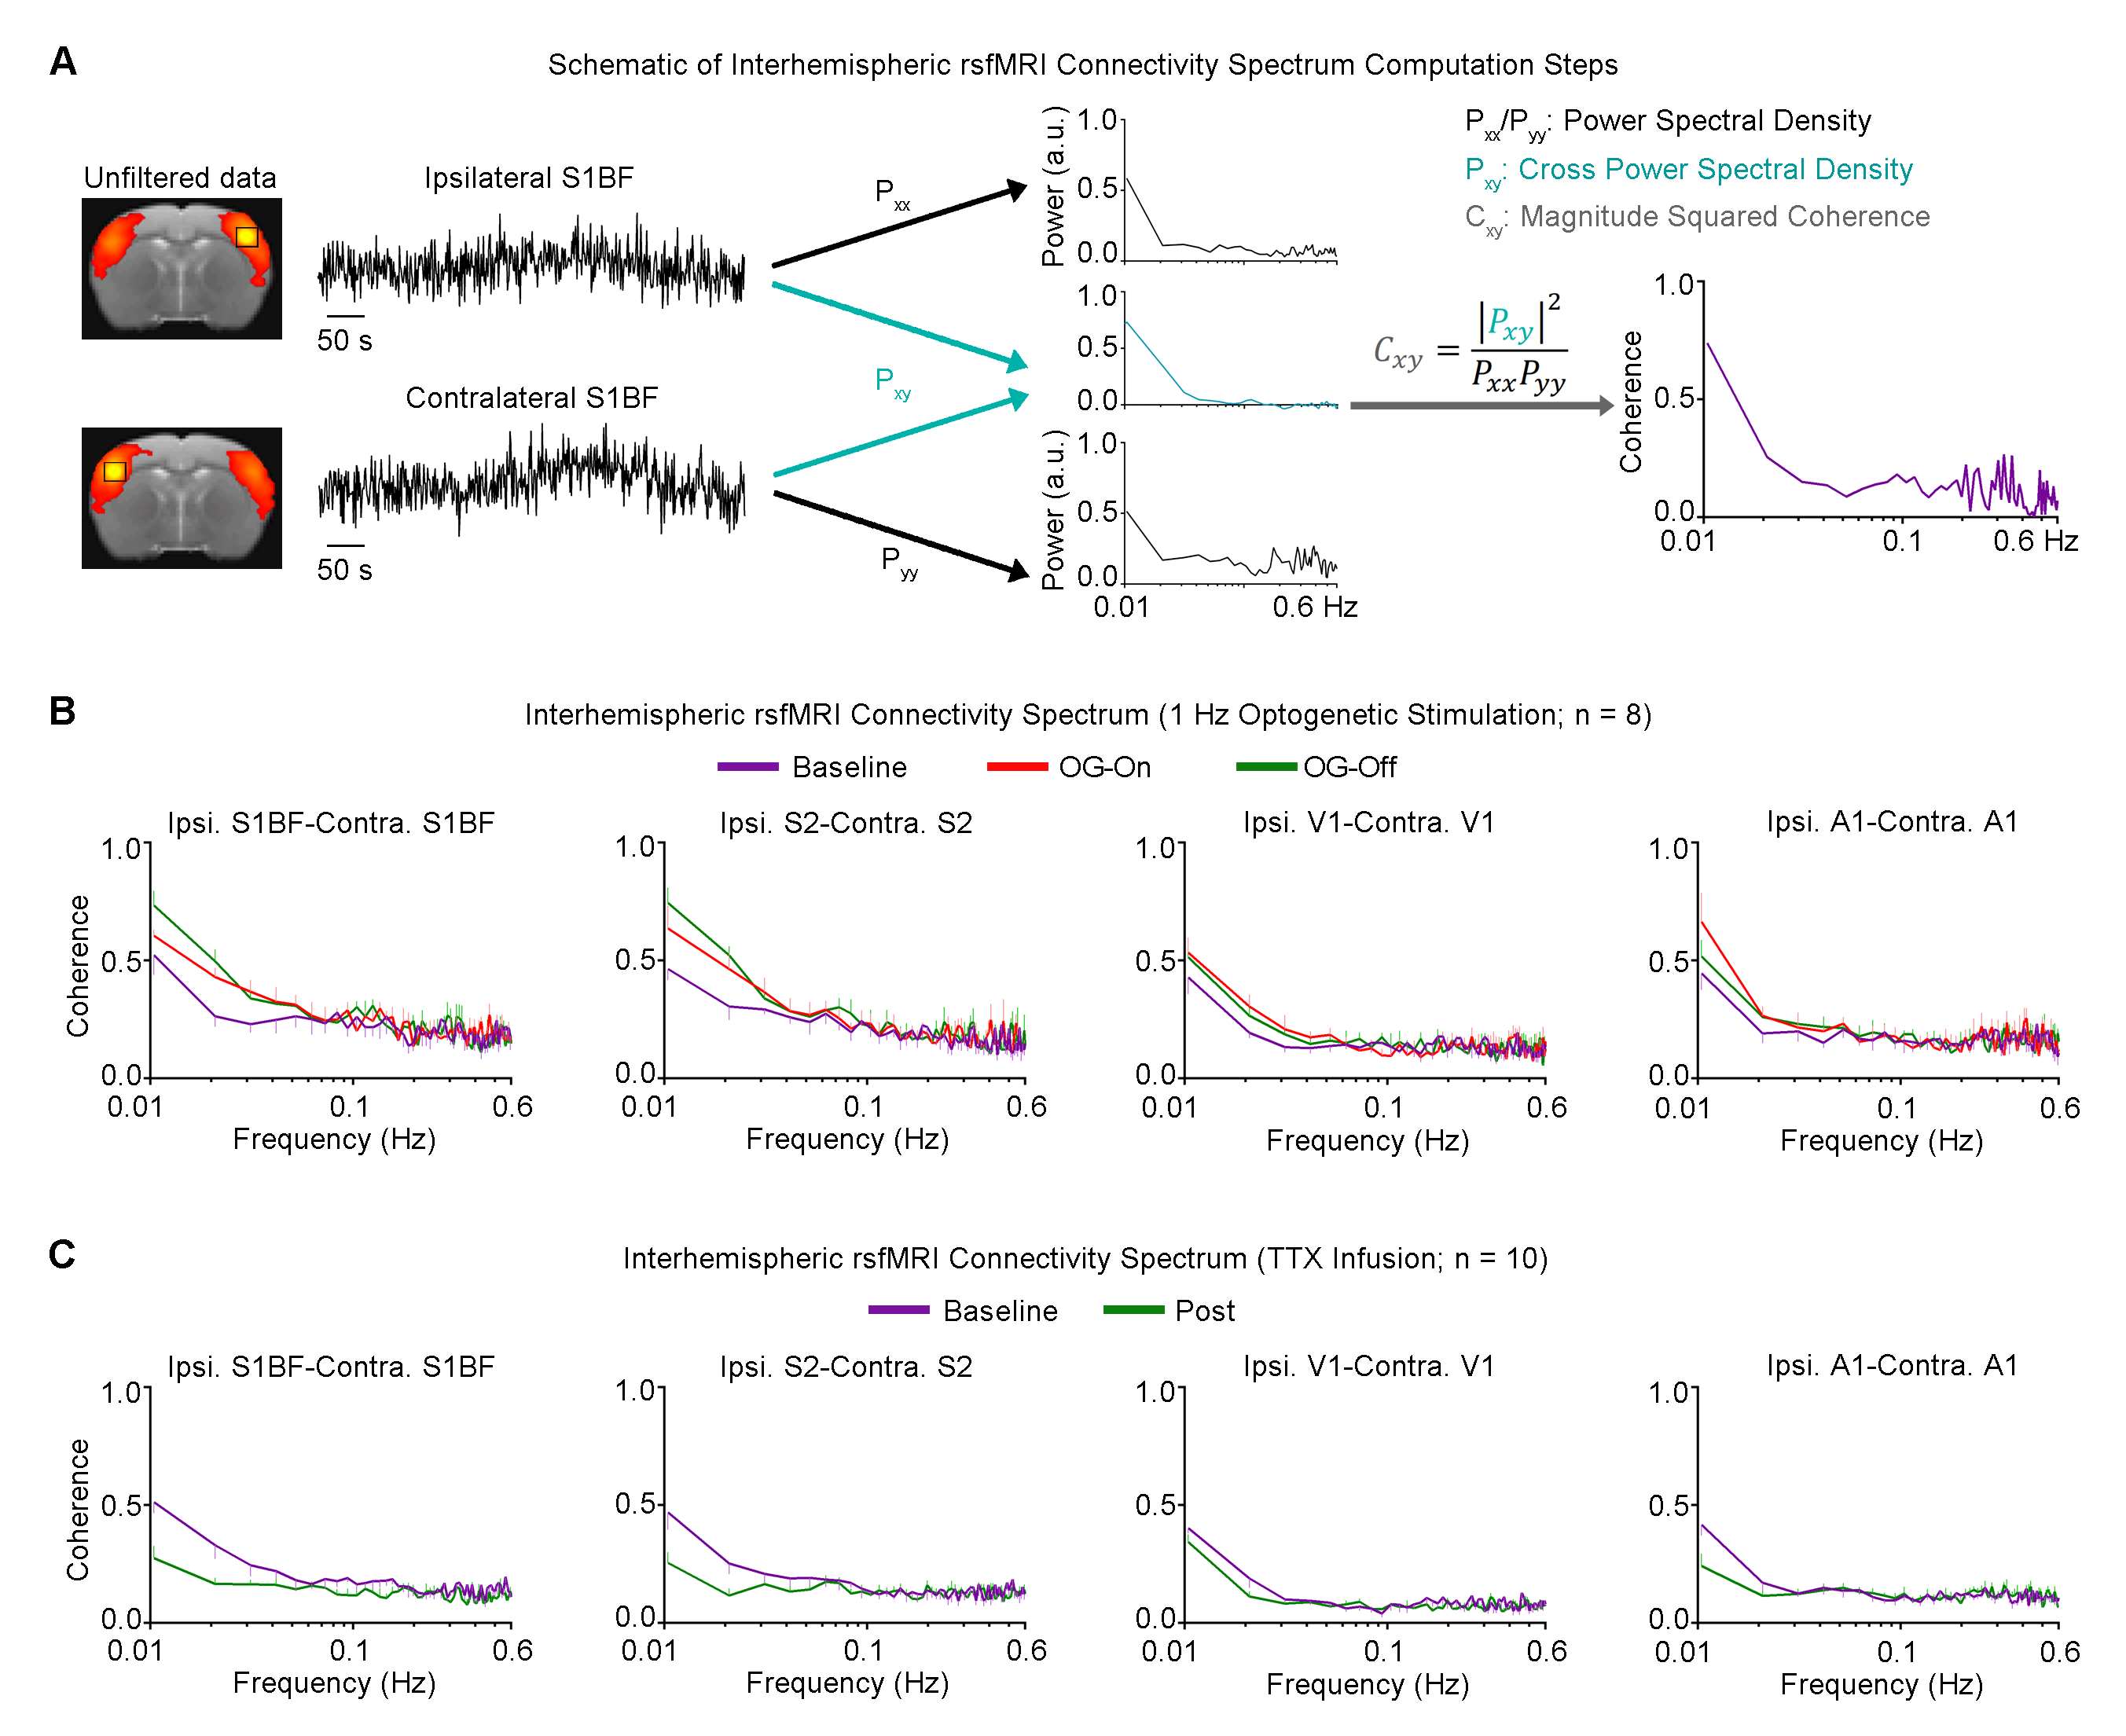
rsfMRI Acquisition and Analysis: RsfMRI data was acquired at 7T using GE-EPI (FOV=32×32mm2, matrix=64×64, α=56°, TE/TR=20/750ms, 16 contiguous slices with 1mm thickness). Standard preprocessing followed by seed-based correlation analysis was applied to map and quantify interhemispheric/bilateral rsfMRI functional connectivity of primary somatosensory barrel field (S1BF), secondary somatosensory (S2), primary visual (V1) and auditory (A1) cortices. Interhemispheric rsfMRI connectivity spectra and intrahemispheric power spectra were then computed.
Results
Figure 1 demonstrates that interhemispheric S1BF, S2, V1 and A1 functional connectivities were strengthened significantly during OG-On period, which remained elevated during OG-Off period.
Figure 2 shows the significant decreased interhemispheric S1BF, S2, V1 and A1 functional connectivities after pharmacological blockade of VPM thalamocortical neurons by TTX.
Figure 3 presents the interhemispheric rsfMRI connectivity spectrum of S1BF, S2, V1 and A1. Coherent bilateral infra-slow (<0.1Hz) rsfMRI BOLD activity were increased and remained elevated following 1Hz optogenetic VPM stimulation, and decreased after TTX infusion.
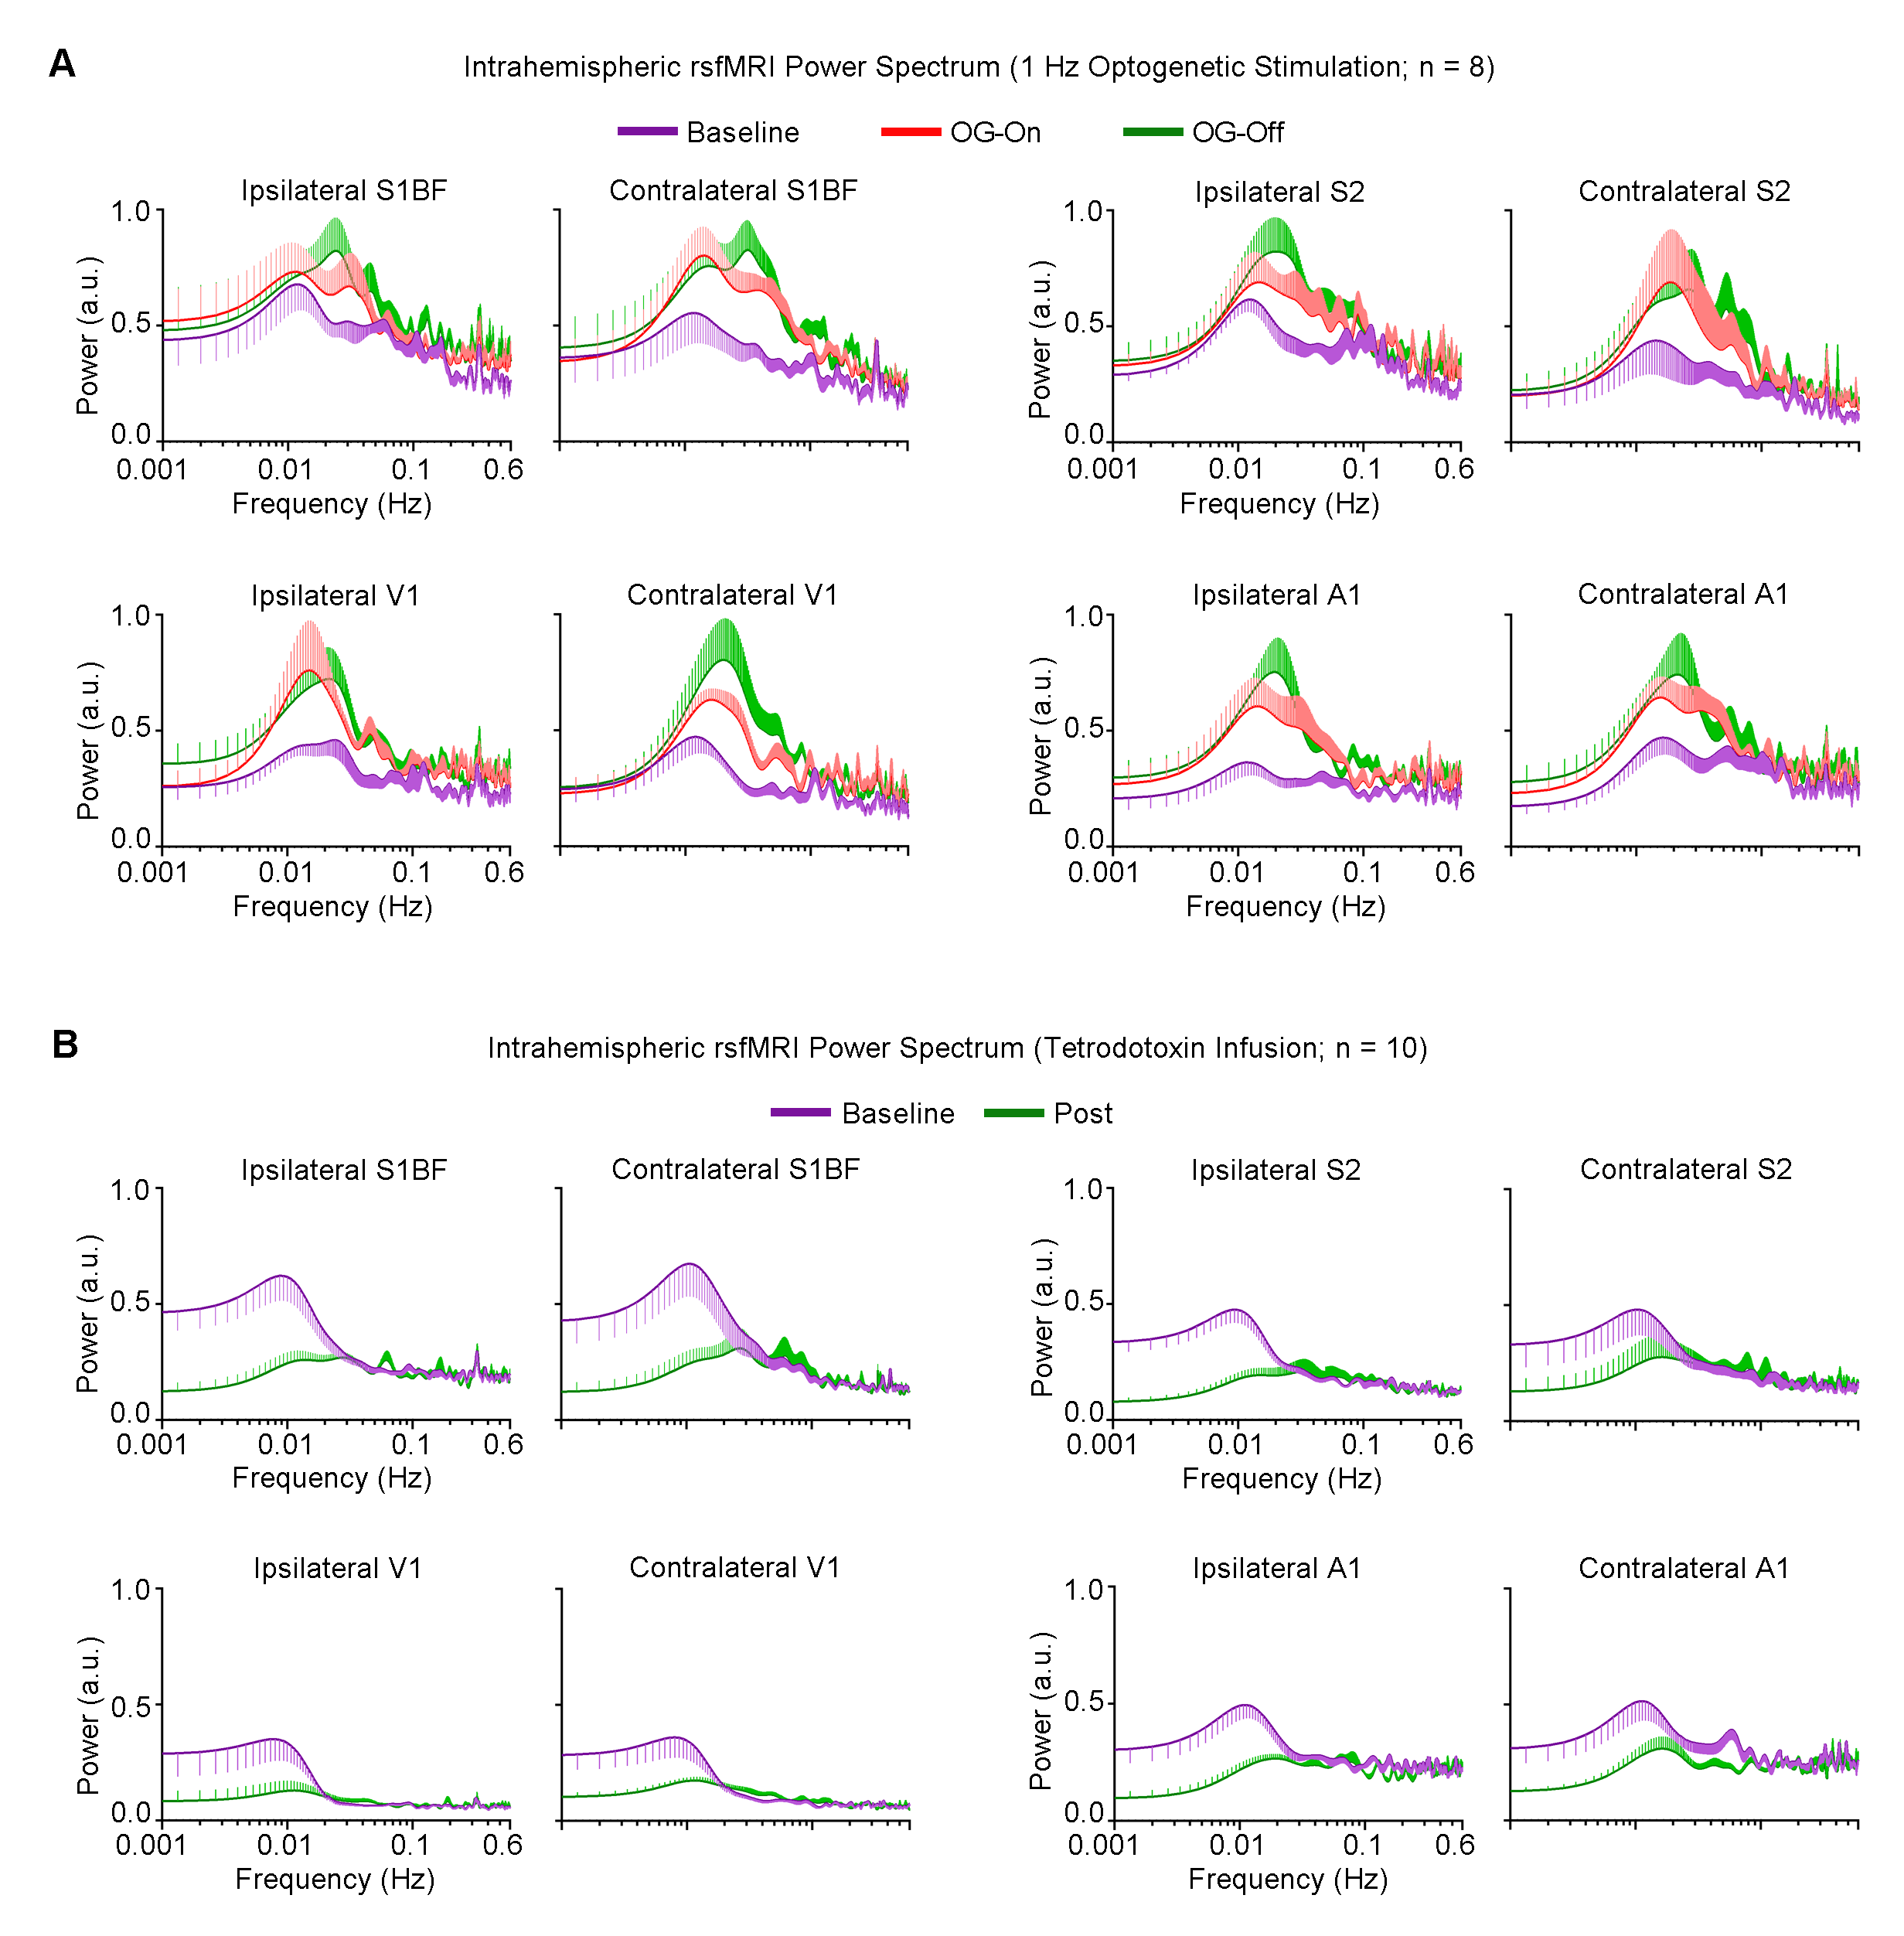
Figure 4 shows the increased local infra-slow (<0.1Hz) rsfMRI BOLD activity of S1BF, S2, V1 and A1, which remained elevated following 1Hz VPM stimulation. TTX infusion at VPM led to a decrease in such activity.
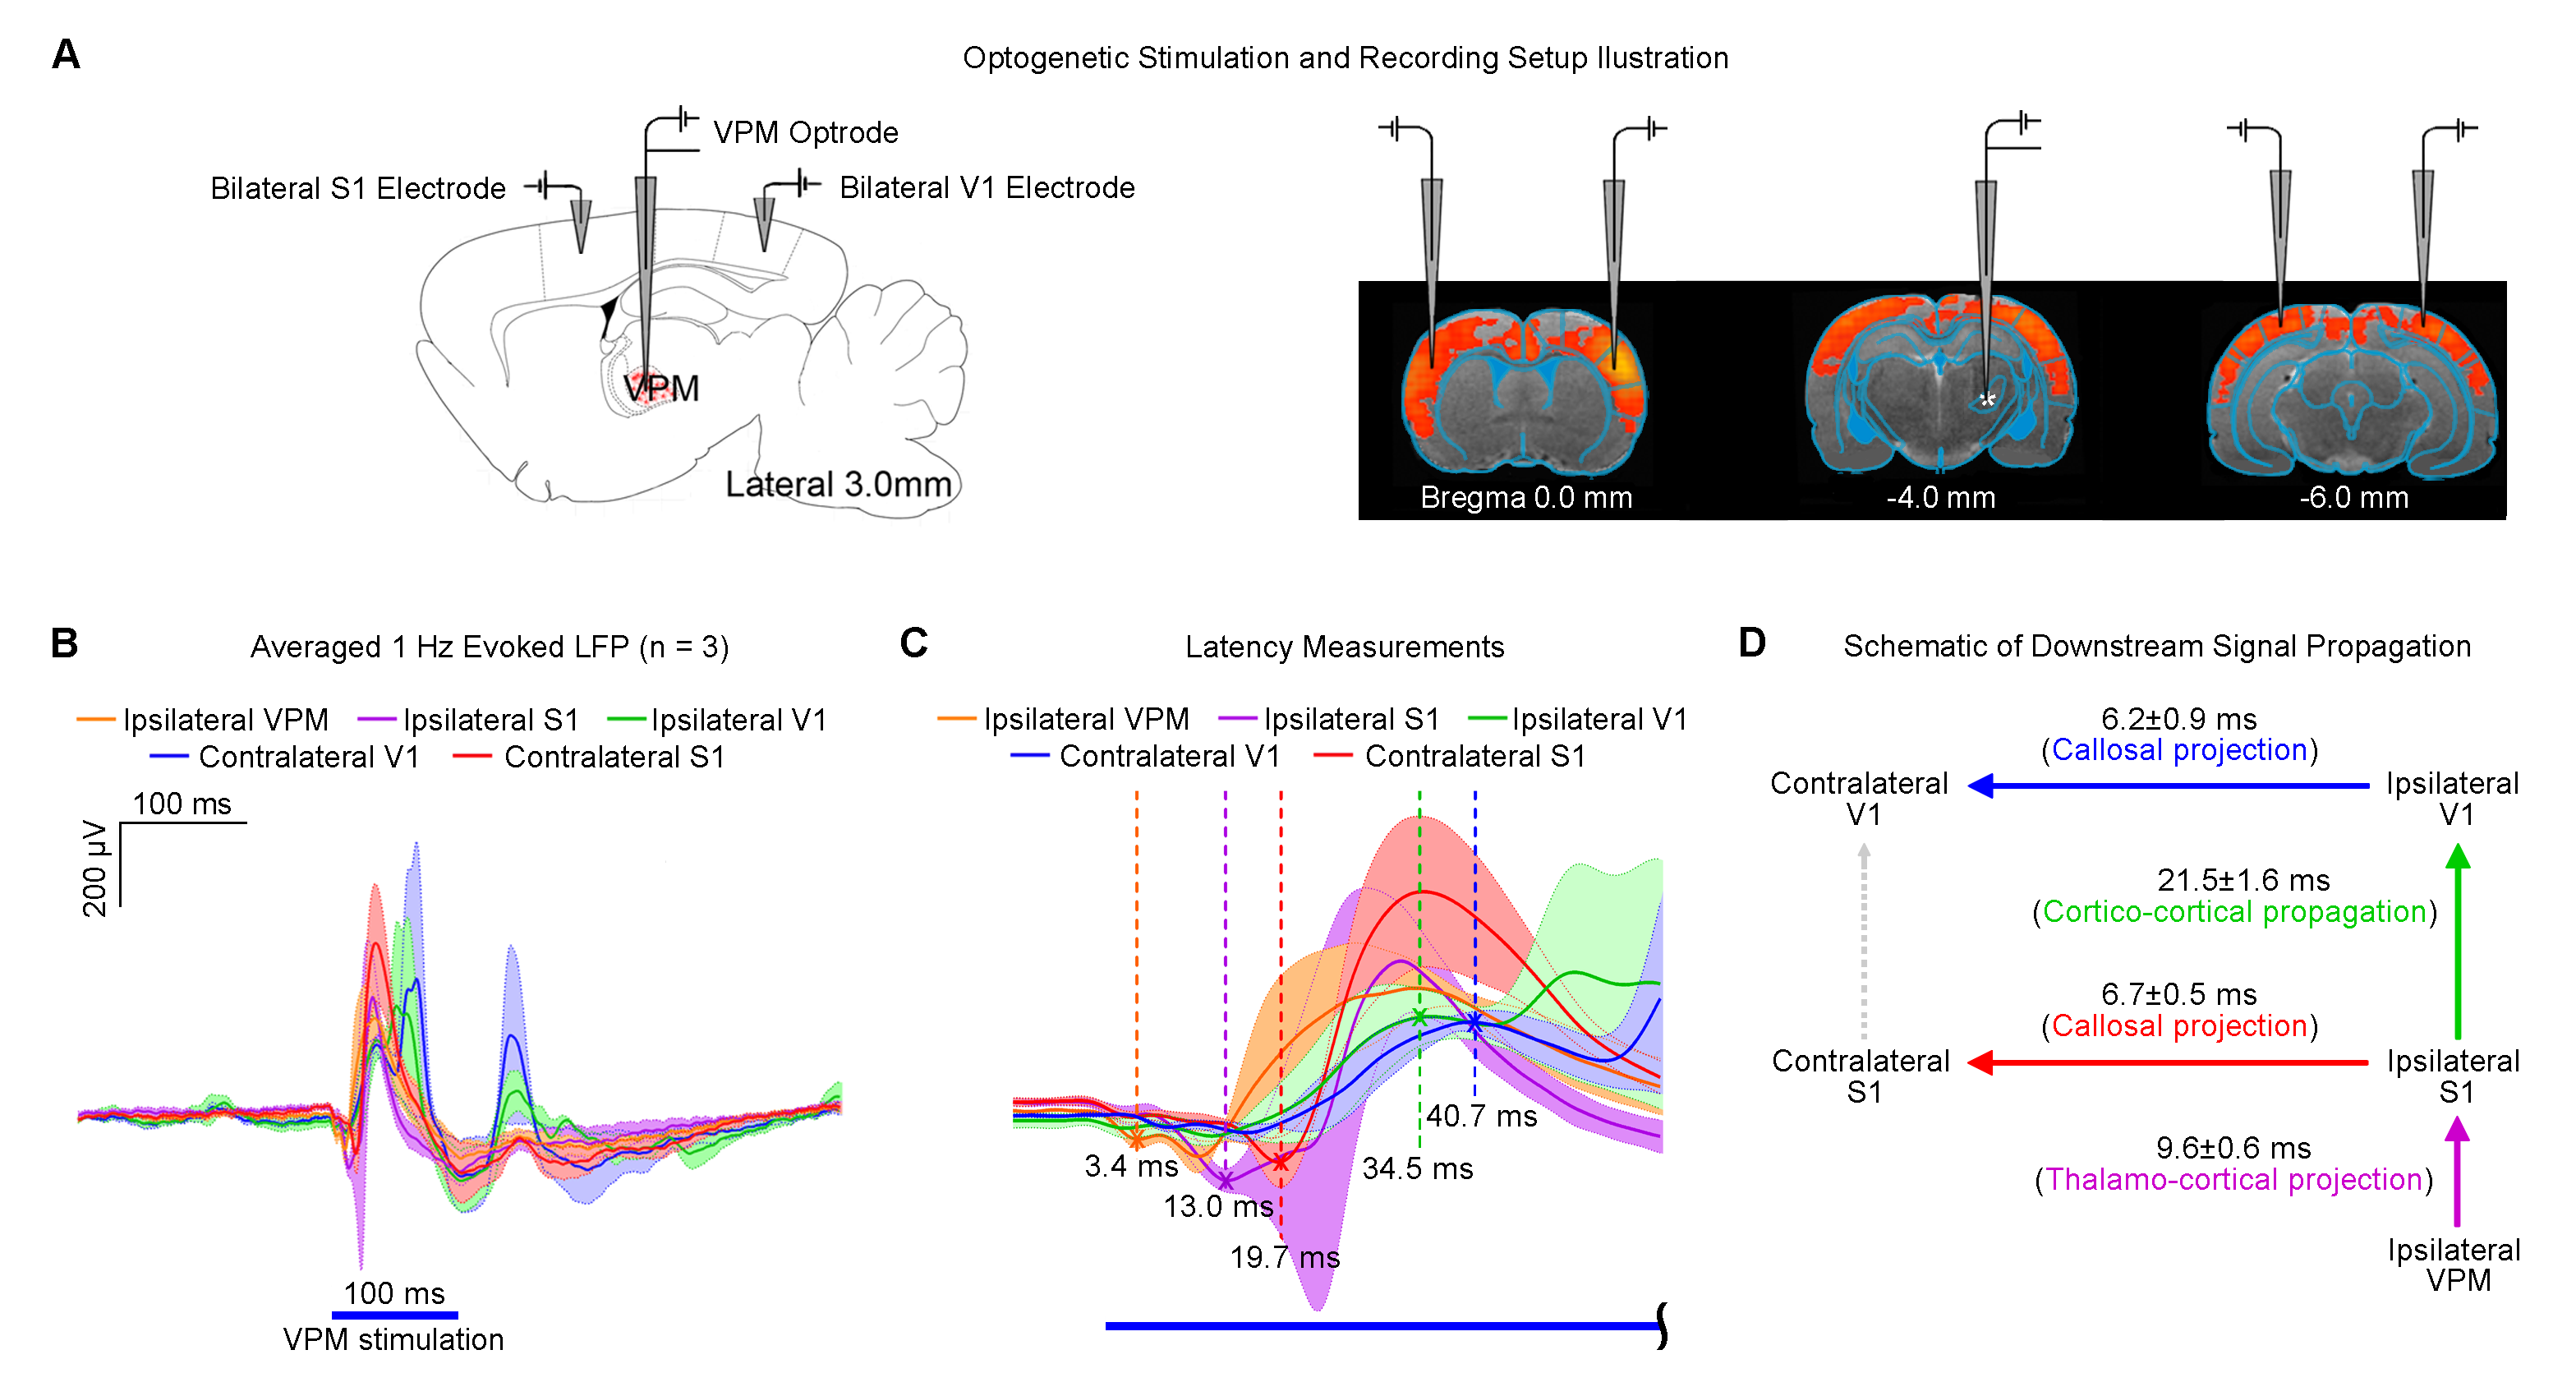
Figure 5 demonstrates the downstream propagation of low frequency neuronal activity as measured by LFP, initiated by optogenetic excitation of VPM thalamocortical excitatory neurons at 1Hz.
Discussion and Conclusion
Our results demonstrated that optogenetic excitation of the VPM thalamocortical excitatory neurons at 1Hz enhanced brain-wide rsfMRI functional connectivity. On the other hand, TTX inactivation of thalamocortical neurons decreased rsfMRI connectivity. Spectral analysis (Figure 3) indicated that such changes were underpinned by neuromodulatory effects on the infra-slow rsfMRI BOLD activity, suggesting that propagation of low frequency activity in the thalamo-cortical circuit facilitate certain neuromodulatory mechanisms. The thalamo-cortical-thalamic network has been shown to play a pivotal role in setting the global brain state and controlling the flow of sensory information8. Indeed, its importance has been echoed in our recent optogenetic fMRI investigation, showing that low frequency stimulation of VPM thalamocortical excitatory neurons initiates brain-wide propagation of low frequency activities9 (Figure 5). Low frequency activities such as slow (<1Hz) and infra-slow (<0.1Hz) oscillations are spontaneously initiated in10,11 or triggered by stimulation of the thalamus and cortex7,12. Moreover, numerous evidence indicate that slow oscillations are capable of modulating neuronal excitability brain-wide13. These studies by others suggest that our 1Hz optogenetic stimulation of VPM initiates slow oscillations that may couple with infra-slow oscillations14,15, leading to enhanced rsfMRI connectivity. Whereas, TTX inactivation of VPM thalamocortical neurons disrupts the initiation or propagation of these oscillations, decreasing rsfMRI connectivity. By manipulating the specific activities within the thalamo-cortical-thalamic network, optogenetic rsfMRI presents a powerful approach to dissect the neural bases of rsfMRI connectivity.Acknowledgements
No acknowledgement found.References
1. Stern, P. Connection, Connection, Connection…. Science (New York, N.Y.) 342, 577 (2013).
2. Oh, S.W., Harris, J.A., Ng, L., Winslow, B., Cain, N., Mihalas, S., Wang, Q., Lau, C., Kuan, L., Henry, A.M., Mortrud, M.T., Ouellette, B., Nguyen, T.N., Sorensen, S.A., Slaughterbeck, C.R., Wakeman, W., Li, Y., Feng, D., Ho, A., Nicholas, E., Hirokawa, K.E., Bohn, P., Joines, K.M., Peng, H., Hawrylycz, M.J., Phillips, J.W., Hohmann, J.G., Wohnoutka, P., Gerfen, C.R., Koch, C., Bernard, A., Dang, C., Jones, A.R. & Zeng, H. A mesoscale connectome of the mouse brain. Nature 508, 207-214 (2014).
3. Smith, S.M., Beckmann, C.F., Andersson, J., Auerbach, E.J., Bijsterbosch, J., Douaud, G., Duff, E., Feinberg, D.A., Griffanti, L., Harms, M.P., Kelly, M., Laumann, T., Miller, K.L., Moeller, S., Petersen, S., Power, J., Salimi-Khorshidi, G., Snyder, A.Z., Vu, A.T., Woolrich, M.W., Xu, J., Yacoub, E., Ugurbil, K., Van Essen, D.C., Glasser, M.F. & Consortium, W.U.-M.H. Resting-state fMRI in the Human Connectome Project. NeuroImage 80, 144-168 (2013).
4. Zhou, I.Y., Liang, Y.X., Chan, R.W., Gao, P.P., Cheng, J.S., Hu, Y., So, K.F. & Wu, E.X. Brain resting-state functional MRI connectivity: morphological foundation and plasticity. NeuroImage 84, 1-10 (2014).
5. Sheroziya, M. & Timofeev, I. Global intracellular slow-wave dynamics of the thalamocortical system. The Journal of neuroscience : the official journal of the Society for Neuroscience 34, 8875-8893 (2014).
6. Mohajerani, M.H., Chan, A.W., Mohsenvand, M., LeDue, J., Liu, R., McVea, D.A., Boyd, J.D., Wang, Y.T., Reimers, M. & Murphy, T.H. Spontaneous cortical activity alternates between motifs defined by regional axonal projections. Nature neuroscience 16, 1426-1435 (2013).
7. Stroh, A., Adelsberger, H., Groh, A., Ruhlmann, C., Fischer, S., Schierloh, A., Deisseroth, K. & Konnerth, A. Making waves: initiation and propagation of corticothalamic Ca2+ waves in vivo. Neuron 77, 1136-1150 (2013).
8. Castro-Alamancos, M.A. Dynamics of sensory thalamocortical synaptic networks during information processing states. Progress in neurobiology 74, 213-247 (2004).
9. Leong, A.T.L., Chan, R.W., Gao, P.P., Chan, Y.S., Tsia, K.K., Yung, W.H. & Wu, E.X. Long-range projections coordinate distributed brain-wide neural activity with a specific spatiotemporal profile. Proceedings of the National Academy of Sciences of the United States of America (2016 (in press)).
10. Lorincz, M.L., Geall, F., Bao, Y., Crunelli, V. & Hughes, S.W. ATP-dependent infra-slow (<0.1 Hz) oscillations in thalamic networks. PLoS One 4, e4447 (2009).
11. Hughes, S.W., Lorincz, M.L., Parri, H.R. & Crunelli, V. Infraslow (<0.1 Hz) oscillations in thalamic relay nuclei basic mechanisms and significance to health and disease states. Prog Brain Res 193, 145-162 (2011).
12. Rigas, P. & Castro-Alamancos, M.A. Thalamocortical Up states: differential effects of intrinsic and extrinsic cortical inputs on persistent activity. The Journal of neuroscience : the official journal of the Society for Neuroscience 27, 4261-4272 (2007).
13. Neske, G.T. The Slow Oscillation in Cortical and Thalamic Networks: Mechanisms and Functions. Front Neural Circuits 9, 88 (2015).
14. Hyafil, A., Giraud, A.L., Fontolan, L. & Gutkin, B. Neural Cross-Frequency Coupling: Connecting Architectures, Mechanisms, and Functions. Trends Neurosci 38, 725-740 (2015).
15. Canolty, R.T. & Knight, R.T. The functional role of cross-frequency coupling. Trends in cognitive sciences 14, 506-515 (2010).
Figures