0237
Cortical depth-dependent fMRI: heterogeneity across tasks, across participants, across days and along the cortical ribbon1SFIM, NIMH, Bethesda, MD, United States, 2NIMH, United States, 3Max Planck Institute for human cognitive and Brain science, Leipzig, Germany, 4MBIC, Maastricht University, Netherlands
Synopsis
Measurements of depth-dependent cortical activity provide insights on directional activity between brain areas. While previous studies demonstrated the feasibility of human depth-dependent fMRI, the stability and reliability of depth-dependent results are less studied. In this work, we investigate sources of inconsistencies in depth-dependent activity profiles. We find that depth-dependent activity profiles are highly reproducible across different scanning sessions. They are, however, quite variable within cortical areas across different cross sections along the cortical ribbon. Only when depth-dependent profiles are considered with respect to their location along the cortical ribbon, task-driven modulations of input-output activity become consistent across participants.
Purpose
Measurements of layer-dependent cortical activity provide insight on how feedforward/feedback functional connectivity affects a given cortical area. A few promising studies looking at differently modulated feedback activity [1,2,3], show that depth-dependent fMRI can capture depth-dependent activity modulations. However, individual studies come to contradictory conclusions (feedback in supragranular vs. infragranular layers) [1,2]. In this study, we sought to investigate the reproducibility, consistency, and heterogeneity of cortical depth-dependent fMRI results. We focus on differences of depth-dependent activity A) across different sensory-motor tasks, B) across scan sessions within participants on different days; C) across different cross sections within the cortical ribbon that we call ‘cortical distances’; D) across different participants with different anatomical features and folding patterns.Methods
Experiments in 14 volunteers were performed on a 7T Siemens scanner with a 32-channel NOVA Medical head coil. Data acquisition procedures were used as previously presented in [4]. In short: We used a multi-contrast VASO-BOLD sequence with slices positioned to be approximately perpendicular to the M1 cortex. (Nominal resolution = 0.75×0.75×1.5 mm3, TI1/TI2/TR = 1.1/2.6/3.0 s, 12 slices with FLASH GRAPPA-2 [5], matrix 44x132, 3D-EPI readout [6]. Five 12-min functional scans were collected per participant: (1) right-hand tapping with touch, (2) left-hand tapping with touch, (3) right-hand tapping without touch, (4) no tapping while being touched with an abrasive cushion, (5) resting state. Segmentation and cortical layering algorithms (based on the equi-volume approach [7]) were applied directly on the EPI images from the functional scans.
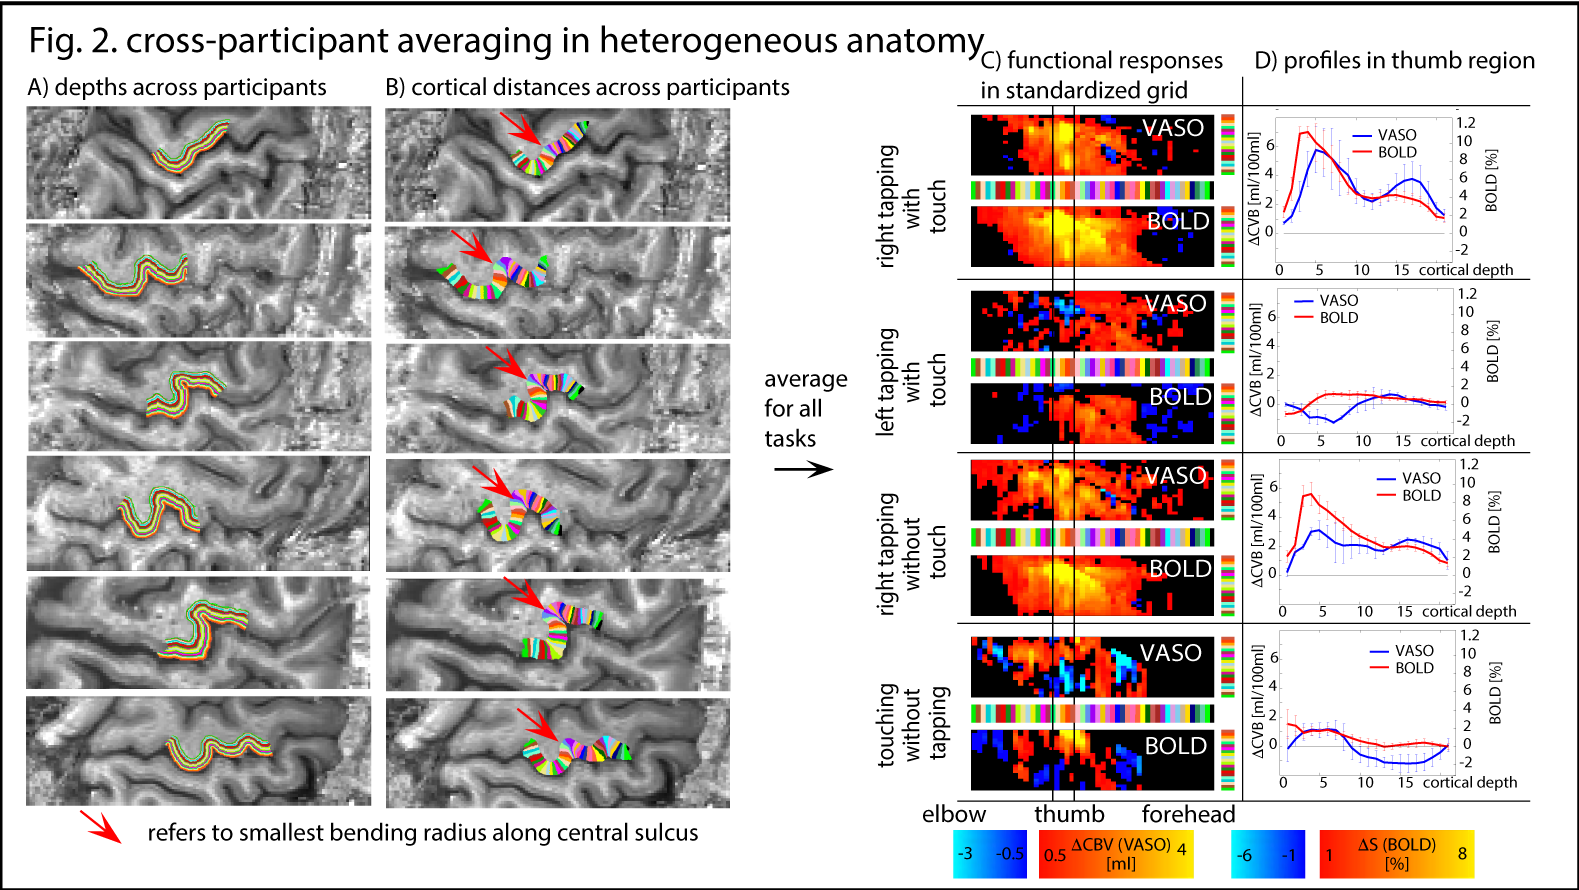
For cross-participant comparison and cross-participant averaging, we developed a sub-sampling method across cortical depths and cortical distances: depths are normalized based on GM/CSF and GM/WM borders. Cortical distances are normalized based on the bending radius (red arrows in Fig. 2A) and hand knob templates described in [8]. Task-specific responses are then averaged in this 2D-grid.
Results
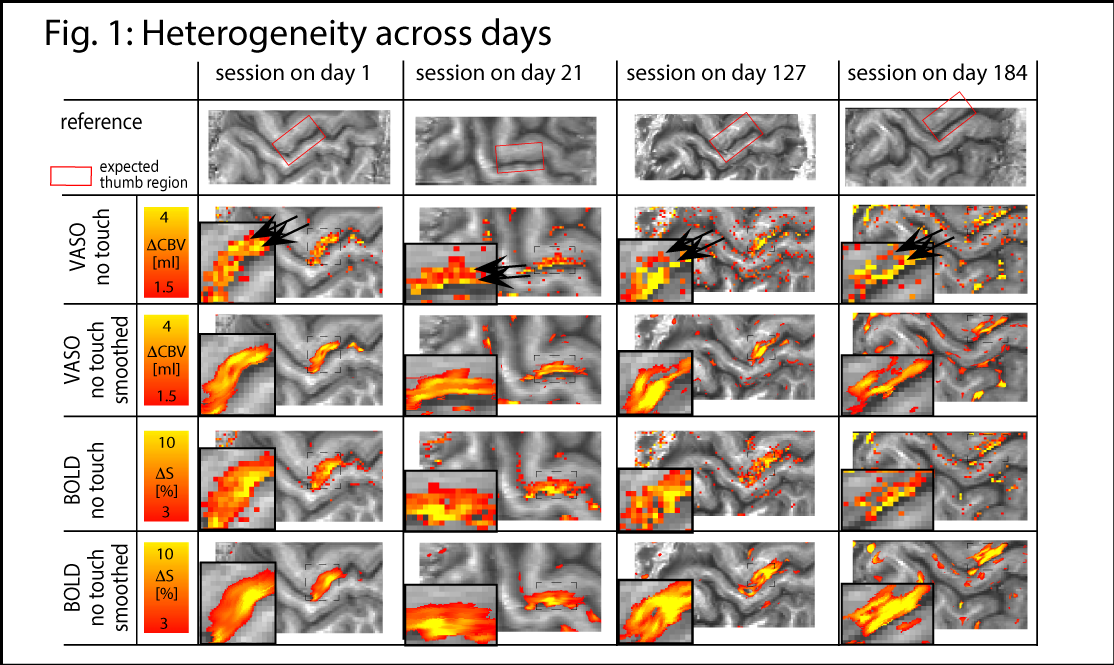
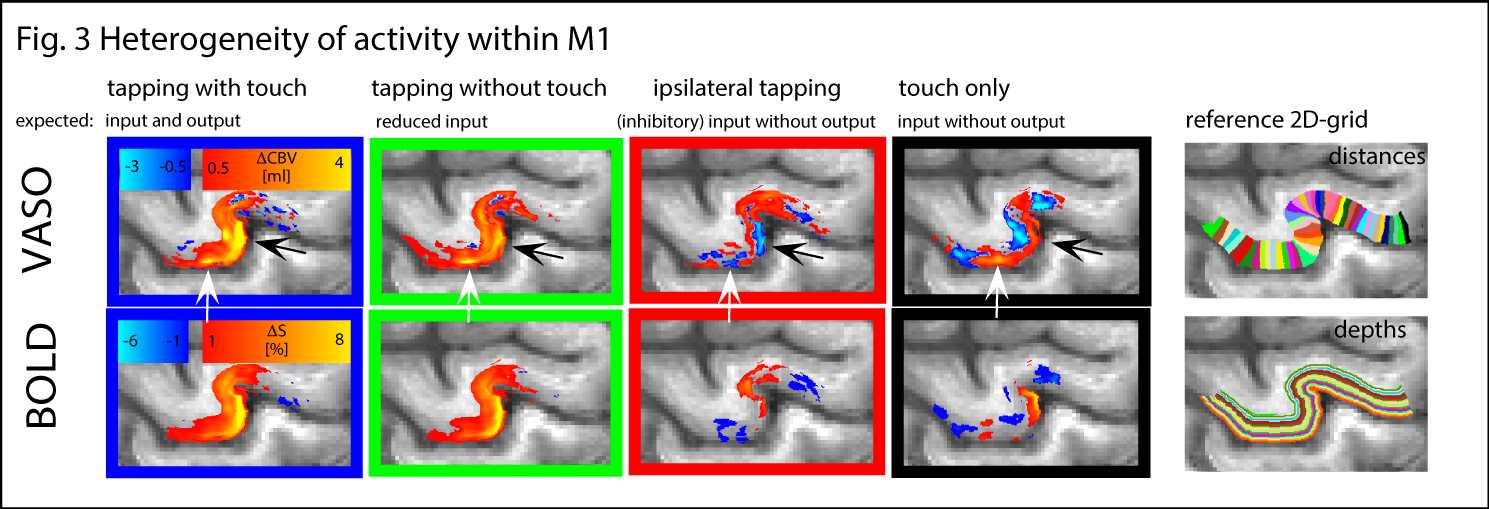
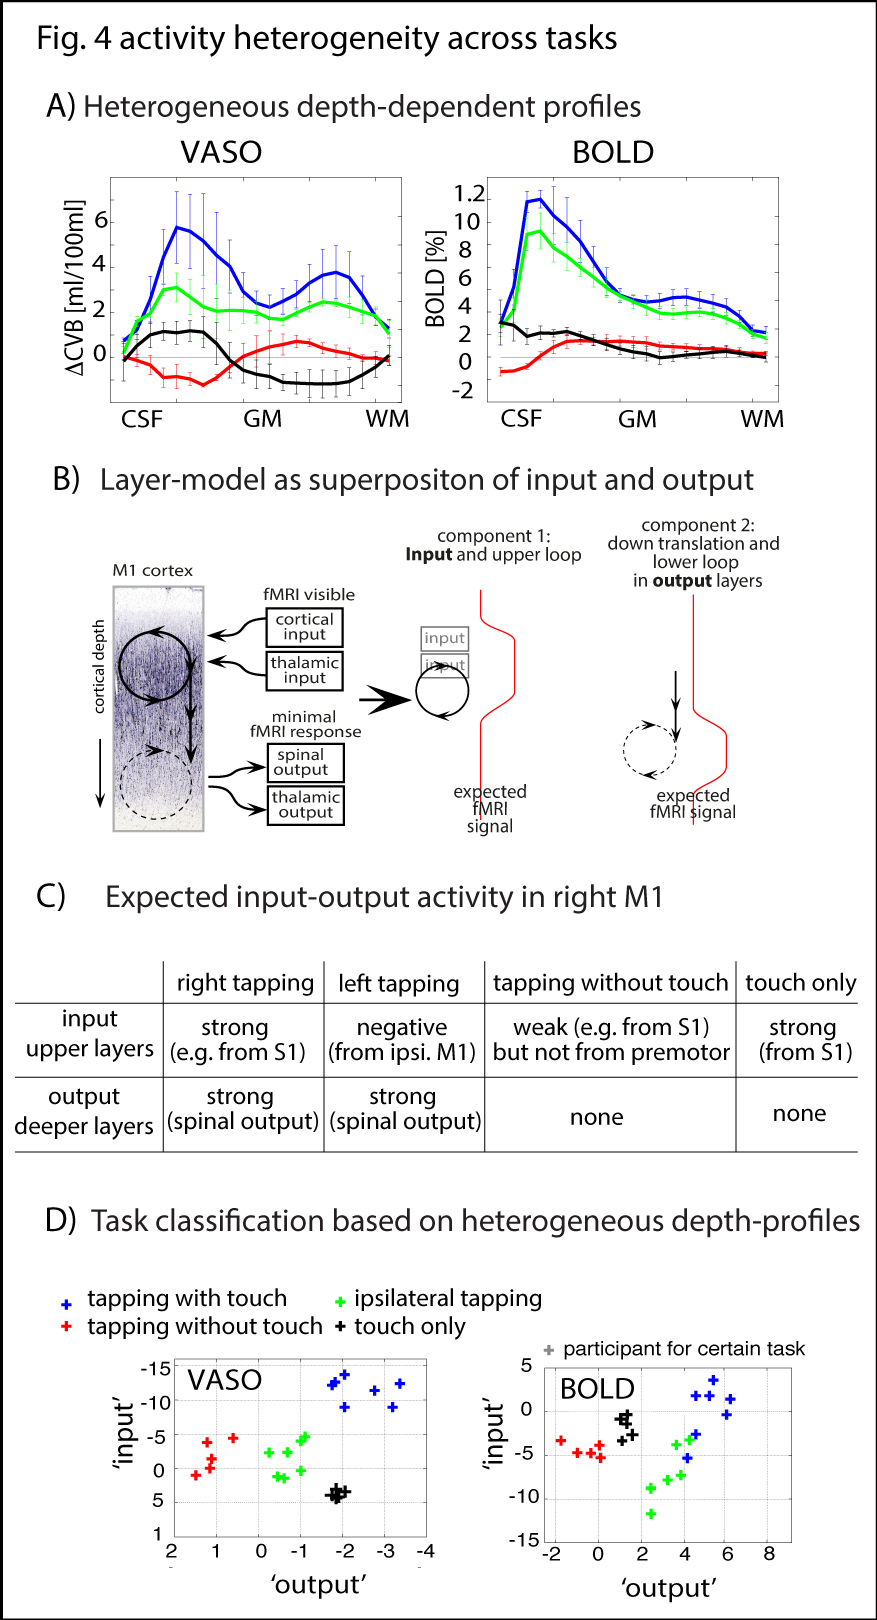
The method provides sufficient sensitivity and specificity to identify depth-dependent activity features (Fig. 1) as shown earlier [4]. Depth-dependent activity features, like a double-layer response, can be reproduced across multiple scan sessions up to 6 months apart. Activity maps acquired across different days look very similar; two distinct active depths can be identified across all scanning sessions (black arrows in Fig. 1). Fig. 2A/B depicts how a standardized 2D grid that is seeded in the hand knob can be used to average the depth-dependent fMRI responses for multiple tasks across cortical distances (Fig. 2C) and cortical depths (Fig. 2D). These averaged 2D grids are transformed back into the EPI space of one representative participant in Fig. 3 to investigate the heterogeneous fMRI responses across cortical distances. Cortical distances within M1 have different responses (for instance, white and black arrows in Fig. 3) [9]. For the response heterogeneity across tasks, average depth-dependent profiles are replotted on top of each other in Fig. 4A. Using a depth-dependent model assuming superposition of input and output across M1 layers [10] (Fig. 4B), cross-participant results can be investigated for task-specific heterogeneity in a scatter plot (Fig. 4D).Discussion
The result that CBV-fMRI seems to be more distinct across cortical depths compared to BOLD-fMRI (Figs. 1/2D/4A) is consistent with previous single-participant analysis [4]. The reproducibility of depth-specific activity patterns across scans (Fig. 1) provides confidence that the patterns are indicative of layer-dependent, neurally driven activity and not only session-specific artifacts. Accounting for cross-participant variability of anatomical folding patterns, consistent depth-dependent profiles could be obtained for 4 different stimuli with different input-output characteristics. These depth-dependent results are consistent with the animal literature: the modulation of sensory input (e.g., tapping with vs. without touch) modulates the activity in upper layers. Modulation of the output (e.g., tapping with touch vs. touch only) modulates deeper layers.Conclusion
Depth-dependent results are reproducible across days. Depth-dependent results can be compared across participants with a new approach using a standardized 2D grid. Depth-dependent profiles are highly variable within cortical areas. This suggests that depth-dependent fMRI will be a useful tool to investigate directional activity in neuroscientific application.Acknowledgements
We thank Kâmil Uludag for the suggestion to introduce the more precise descriptive terminology of cortical ‘depths’ and ‘distances’ instead of ‘layers’ and ‘columns’. Initial single-participant results of this study have been presented at last year’s ISMRM in Singapore #948. This research is supported by the American NIMH Intramural Research Program.References
[1] Muckli et al., Current Biology, 2015, 20:232690-2695;
[2] Kok et al., Current Biology, 2016, 26: 371-376;
[3] Huber et al., NeuroImage, 2015, 107:23-33;
[4] Huber et al., ISMRM, 2016, #948;
[5] Talagala et al., MRM, 2015, 75:2362-2371;
[6] Poser et al., NeuroImage, 2010, 51:261-266;
[7] Waehnert et al., NeuroImage, 2014, 93:210-220;
[8] Caulo et al., Americ. J. Neuroradiology, 2007, 28:1480-1485;
[9] Havlicek et al., OHBM, 2016, #7273
[10] Weiler et al., Nature Neuroscience, 2008, 11:360-366;
Figures