0220
High Spatial Resolution Mapping of Trans-Capillary Water Exchange in Progressive Multiple Sclerosis1Advanced Imaging Research Center, Oregon Health & Science University, Portland, OR, United States, 2Neurology, Oregon Health & Science University, Portland, OR, United States, 3Siemens Medical Solutions, Portland, OR
Synopsis
DCE-MRI data were acquired from 14 healthy control (HC) and 16 secondary progressive multiple sclerosis subjects on a 7T MRI instrument to investigate difference in brain blood vessel properties. The Shutter-Speed Paradigm was used to map blood volume fraction and trans-capillary water exchange kinetics. Our finding suggest abnormalities in brain blood vessel properties suggestive of impaired metabolism in secondary progressive MS.
Purpose
To compare brain blood vessel properties between healthy controls and progressive MS subjects.Introduction
The pathophysiological mechanisms underlying neurodegeneration in MS are not fully understood, but a growing consensus is that chronic inflammation comprised of activated microglia, macrophages and meningeal lymphoid follicles leads to oxidative stress and mitochondrial injury.1 Mitochondrial injury, in turn, leads to even more oxidative stress, furthers demyelination, impairs remyelination capacity, reduces glia-neuron metabolic support,2 potentiates oligodendrocyte apoptosis and axonal degeneration, and ultimately accelerates neuronal death. Metabolic deficits, driven by mitochondrial abnormalities, may be important determinants of brain tissue loss in MS. Brain blood vessel properties are tightly coupled to local metabolic demands, could provide early insight into MS metabolic deficits, and are amenable to mapping at high spatial resolution. Here, we apply Shutter-Speed analysis of dynamic contrast enhanced MRI (DCE-MRI) acquisitions to investigate blood volume fraction and trans-capillary water exchange kinetics in progressive MS.Methods
DCE-MRI data were acquired from 14 healthy control (HC) and 16 secondary progressive multiple sclerosis (SPMS) subjects (see Table 1) on a 7T MRI instrument (Siemens) with quadrature transmit and 24-channel phased-array receive RF coils. A single axial slice (10mm slice thickness) IR turboflash sequence (TR/TE/FA 285/1.15/6°; 128x96 image matrix; FOV 256x192 mm2) was positioned in the centrum semiovale (CSO). IR image sets (2.3 s temporal resolution, 100 image sets total) were obtained before, during, and after injection of 14 μmol/kg Gadoteridol (ProHance; Bracco Diagnostics, Cranberry, NJ) into the antecubital vein. R1 (≡1/T1) maps were calculated on a voxel-by-voxel basis for each IR image set. Pharmacokinetic parametric maps were created by voxel-by-voxel Shutter-Speed Paradigm (SSP) modeling of the DCE-MRI data as described elsewhere.3,4 Tissue segmentation was achieved via bimodal Gaussian fitting of R1exv histograms.5 Unpaired t-tests were used to test for significant differences in SSP parameters between HC and SPMS groups for each tissue class. Suspected lesions identified on R1exv maps were confirmed by comparison to T2-w FLAIR images in SPMS subjects.Results
Axial parametric maps and tissue segmentation masks from a 64 y/o M control are shown in Figure 1. Pharmacokinetic biomarkers of interest here are R1exv (the intrinsic extravascular 1H2O longitudinal relaxation rate constant), vb (blood volume fraction), and kpo (inverse of mean capillary water molecule lifetime, a putative biomarker sensitive to metabolic activity4). Eighteen lesions were identified in six SPMS subjects (3M/3F; avg 3 lesions/subject; range 1-5). Average SSP parameter values obtained within lesion regions-of-interest along with average tissue parameters for white matter (WM) and gray matter (GM) in healthy controls and SPMS subjects are given in Table 2. R1exv is decreased in both NAWM and NAGM in SPMS compared to HC, reflecting reduced macromolecular volume fraction relative to water content.5 Increases in GM vb compared to WM in both HC and SPMS groups are consistent with the highly vascularized nature of cortical GM. Most interestingly, kpo decreases globally in SPMS brain compared to HC.Discussion
We find significant abnormalities in brain blood vessels in SPMS compared to healthy controls. Specifically, increased vb and decreased kpo in normal appearing brain tissue and MS lesions. We hypothesize that water flux across the capillary endothelium is driven by the local tissue homeostatic Na+,K+-ATPase turnover,7,8 which in turn is responsive to metabolic activity behind the blood-brain barrier. The capillary blood water extravasation rate constant, kpo, may provide a sensitive measure of this cerebral metabolic activity and can be mapped at high spatial resolution. Figure 2 shows parametric maps for a 61 y/o F SPMS subject with a notable WM lesion outlined in yellow on the R1exv map. Importantly, areas of focal, markedly decreased kpo are clear on the parametric map, one with a corresponding elevated vb, that appear normal on the R1exv map and were subsequently confirmed as lesions on a T2-w FLAIR image. Because these areas are not obvious as lesions on the R1exv map, kpo as a functional biomarker is perhaps more sensitive for lesions. This case also demonstrates the importance of high-resolution parametric mapping. Note that the lesion demonstrates markedly decreased kpo compared to surrounding CSO NAWM, suggesting a hypometabolic state known to be common in chronic inactive MS lesions.2,4Acknowledgements
Funding: Conrad F Hilton Foundation Innovation Fund, NIH R01 NS040801, NIH S10OD018224, UL1 RR024140-04S1References
1. Lassmann, van Horssen, Mahad. Nature Reviews Neruology 2012;8:647-656.
2. Hauser, Chan, Oksenberg. Progressive multiple sclerosis: pathology and pathogenesis. Multiple sclerosis: Prospects and promise. Ann. Neurol. 2013; 74:317-327
3. Rooney, W. D., Yankeelov, T. E., Coyle, P. K., Telang, F. W. & Springer Jr., C. S. Regional Blood Volumes and Intravascular Water Lifetimes in Human Brain. in International Society of Magnetic Resonance in Medicine 11, 2188 (2003).
4. Rooney, W. D. et al. Mapping human brain capillary water lifetime: high-resolution metabolic neuroimaging. NMR Biomed. (2015). doi:10.1002/nbm.3294
5. Rooney, W. D. et al. Magnetic field and tissue dependencies of human brain longitudinal 1H2O relaxation in vivo. Magn Reson Med 57, 308–318 (2007).
6. Ge, Y. et al. Characterizing brain oxygen metabolism in patients with multiple sclerosis with T2-relaxation-under-spin-tagging MRI. J. Cereb. Blood Flow Metab. 32, 403–412 (2012).
7. Zeuthen, T. Water transporting proteins. Journal of Membrane Biology, 234:57-73; 2010
8. Zhang Y, Poirier-Quinot M, Springer CS Jr, Balschi JA. Active trans-plasma membrane water cycling in yeast is revealed by NMR. Biophys J. 2011 Dec 7;101(11):2833-42.
Figures
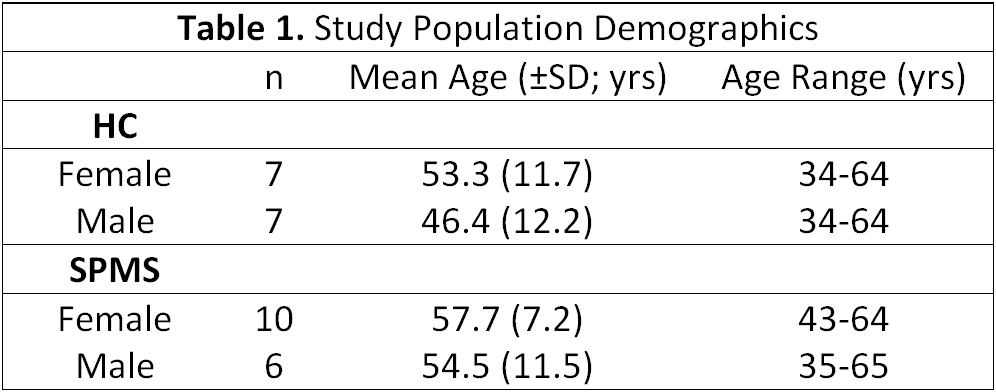
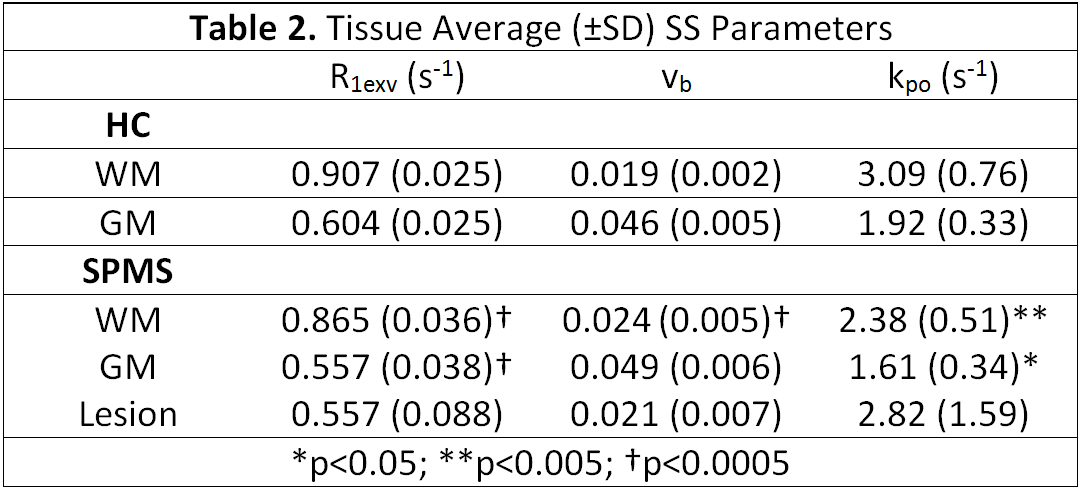
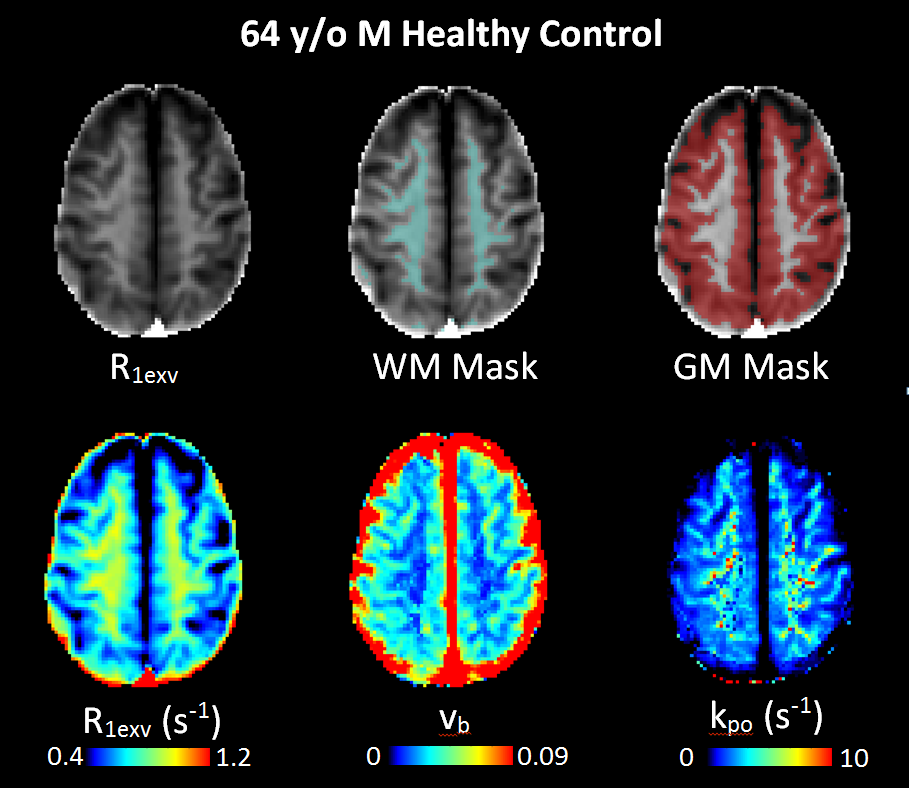
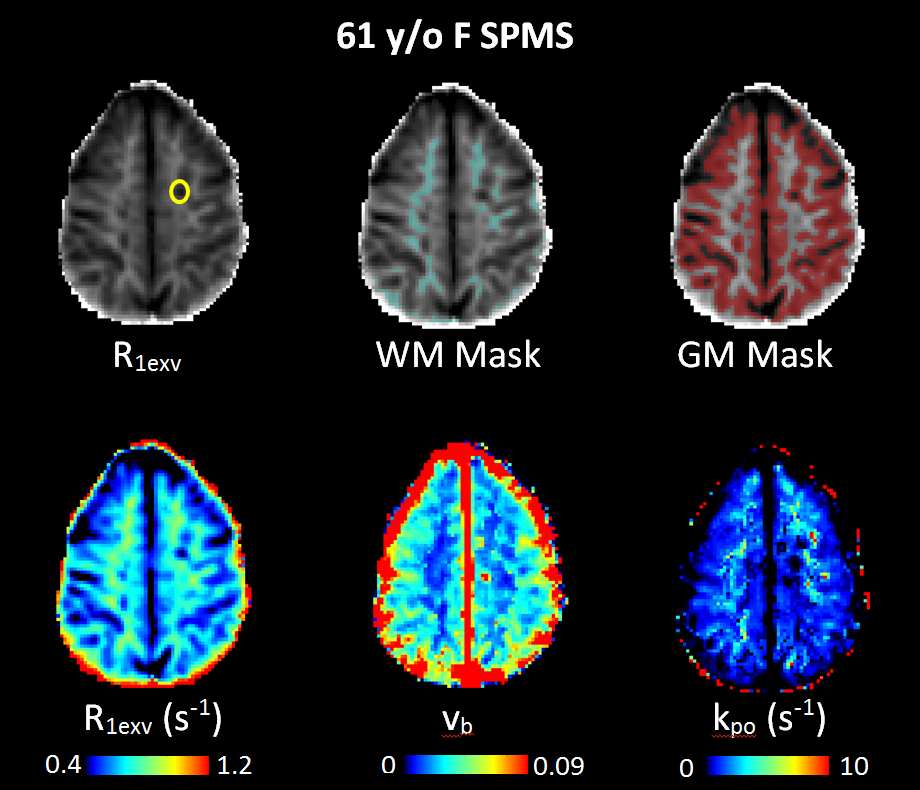
Figure 2. Tissue segmentation masks and SSP parametric maps in a 61 year old female SPMS subject. Tissue masks are overlaid on the R1exv image in false color in the top row. False-color parametric maps for R1exv, vb, and kpo are shown in the bottom row for this subject. A WM lesion is identified by the yellow circle on the R1exv map in the top row. Note the depressed kpo values in the WM areas colocalized with regions of elevated vb corresponding to WM lesions. Elevated values in subarachnoid CSF space are not meaningful.