0219
Investigation of outer and inner cerebellar MTR abnormalities in different MS clinical subtypes1UCL Institute of Neurology, Queen Square MS Centre, University College London, London, United Kingdom, 2Translational Imaging Group, Centre for Medical Image Computing, Department of Medical Physics and Biomedical Engineering, University College London, London, United Kingdom, 3Dementia Research Centre, Department of Neurodegenerative Diseases, UCL Institute of Neurology, University College London, London, United Kingdom, 4Division of Neuroscience and Experimental Psychology, University of Manchester, Manchester, United Kingdom, 5Department of Neurology, Nottingham University Hospitals, Nottingham, United Kingdom, 6Department of Neurology, University Hospital Basel, Basel, Switzerland, 7National Institute for Health Research (NIHR) University College London Hospitals Biomedical Research Centre, United Kingdom, 8Department of Brain and Behavioural Sciences, University of Pavia, Pavia, Italy, 9Brain MRI 3T Center, C. Mondino National Neurological Institute, Pavia, Italy
Synopsis
Histopathology has demonstrated extensive grey matter (GM) damage in MS, and an association with meningeal inflammatory factors has previously been suggested. We applied a method to subdivide the cerebellar GM (CGM) into inner and outer regions, and investigated for magnetization transfer ratio (CGM-MTR) abnormalities in MS subtypes compared to healthy controls (HC). Outer was lower than inner CGM-MTR in all groups including HC. Outer and inner CGM-MTR reductions were observed in progressive MS subtypes. Stronger correlations of outer than inner CGM-MTR with clinical scores were observed, suggesting that outer CGM-MTR may reflect more clinically relevant pathology, particularly in progressive MS.
Purpose
Histopathology has demonstrated extensive grey matter (GM) damage in MS1-3, and an association of subpial demyelination with meningeal inflammation has also been suggested, particularly in the cortex, and more so in progressive forms of the disease4,5. Cerebellar GM (CGM) is also often significantly affected in MS6, more so than cerebellar white matter (WM), in all stages/courses of the disease7,8, and is associated with poor disease outcome9.
A recent histopathology study demonstrated an association of increased meningeal inflammation with cerebellar demyelination9, supporting the hypothesis of the subarachnoid space as a source of CSF-mediated factors in cerebellar demyelination, in part due to the deeply folded nature of the CGM, similarly to the cortex.
We aimed to apply a method previously utilized in cortical GM in MS10 to subdivide the cerebellar GM into inner and outer regions and investigate for changes in the magnetization transfer ratio (MTR), which has been shown to be sensitive to myelin content in WM11,12, and cortical GM13,14 and as such has potential to be a biomarker of cerebellar demyelination in vivo.
Methods
Subjects: 21 HC and 51 people with MS were included in this study and subject demographics are given in Figure 1. MR acquisition: Subjects were scanned using a 3T Philips Achieva system (Philips Healthcare, Best, The Netherlands) with a 32-channel head coil and multi-transmit technology. T1-weighted (T1w) volumes and MTR data were both acquired sagittally, with field-of-view 256x256x180mm3; voxel size1x1x1mm3. Sequence acquisition parameters are given in Figure 2.
Image Analysis: Each subject’s lesion-filled16 T1w volume was segmented using the Geodesic Informational Flows algorithm17. To subdivide the cerebellar GM, a method was implemented which solves the Laplace equation between 2 regions to determine the mid-harmonic location15,18,19. MTR data for each subject were affine registered to their T1w volume using NiftyReg20,21, and a 90% threshold was applied to CGM probability maps to limit potential partial volume effects15. Inner and outer CGM masks were applied to calculated MTR maps to obtain MTR values for each band.
Statistical analysis: All statistical analyses were performed using SPSS (IBM SPSS version 22 for Windows (SPSS, Inc., Chicago, IL, USA)). Paired t-tests were used to examine differences between inner and outer cerebellar GM MTR (CGM-MTR) values. Between-group differences were tested via one-way ANCOVA tests with age, gender and CGM volume included as covariates. Associations between MTR and EDSS and components of the MSFC score (9HPT, PASAT, and TWT) were investigated using Spearman’s Rho tests. Non-parametric tests were chosen as EDSS scores are not normally distributed.
Results
MTR values in the inner and outer CGM regions for all subjects are given in Figure 3.
In all subject groups, MTR was lower in the outer compared with the inner cerebellar GM (p<0.0001).
Outer cerebellar GM: Significant correlations of outer CGM-MTR with clinical outcome measures were observed in all patients grouped together: EDSS (r=-0.438, p=0.001), TWT (r=0.302, p<0.05), 9HPT (r=0.393, p<0.01), PASAT (r=0.327, p<0.05).
Inner cerebellar GM: In all patients inner CGM-MTR correlated with EDSS (r=-0.408, p=0.003) but no other clinical measures.
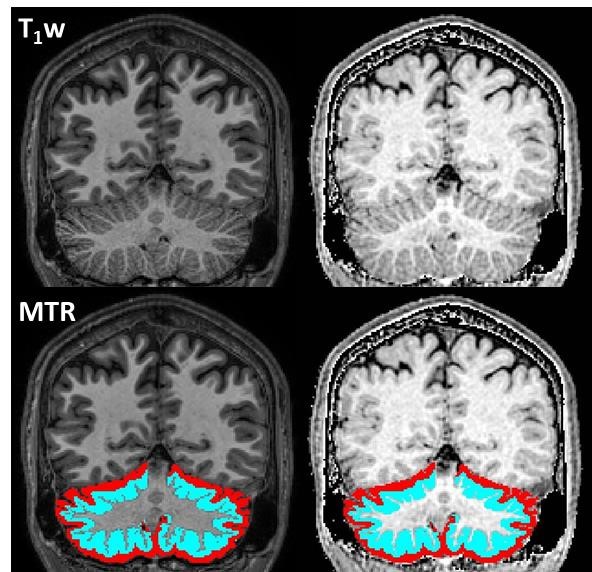
Example T1w images and MTR maps with inner and outer cerebellar regions superimposed are shown in Figure 4.
Discussion and Conclusions
In all groups, including HC, MTR was lower in the outer compared with the inner cerebellar GM (similarly to the cortex10). The outermost molecular layer (~250µm thick) is devoid of myelin, but myelin is generally present in the Purkinje cell and granule cell layers below this, but has been shown via histology to be absent in demyelinated lesions in SPMS9.
A significant decrease in both outer and inner CGM-MTR compared to HC, consistent with the presence of demyelination, was observed in SP and PPMS (p<0.01), but not in RRMS.
Stronger correlations of outer CGM-MTR with clinical scores were observed than with inner CGM-MTR, suggesting that outer may reflect clinically relevant pathology more so than the inner CGM-MTR, particularly in the progressive forms of MS. This is consistent with observations from histopathology, which have noted significant GM damage in the progressive forms of the disease, and implies that this type of analysis could prove useful for monitoring of clinical progression and treatment effects.
Future work will include investigation of the effects of partial volume, which may be important for this analysis due to the complex anatomy of the cerebellum, with a very tightly folded layer of GM with WM underneath. Future studies including larger cohorts of MS patients would also be desirable, and at higher field strengths to enable higher resolution scans. Longitudinal observations are also necessary to determine the dynamics and ongoing clinical significance of CGM-MTR abnormalities.
Acknowledgements
The authors would like to thank the UK MS Society, the EPSRC and the Department of Health’s NIHR Biomedical Research Centres funding scheme for funding (NIHR BRC UCLH/UCL High Impact Initiative-BW.mn.BRC10269). We would also like to thank all the participants of the study.References
[1] Peterson JW et al. Ann Neurol. 2001; 50(3):389-400; [2] Bo L et al. J Neuropathol Exp Neurol. 2003; 62(7):723-32; [3] Kutzelnigg A et al. Brain. 2005; 128(11):2705-12); [4] Reynolds R et al. Acta Neuropath 2011: 155-70; [5] Luchinetti CF et al. NEJM. 2011; 365(23):2188-97; [6] Gilmore CP et al JNNP 2009 80: 182-187; [7] Crespy L et al. PLOS One. 2011; 6(9); [8] Calabrese M et al. Ann Neurol. 2013; 74: 76-83; [9] Howell O et al. Neuropath & Applied Neurobiol. 2015; 41: 798-813; [10] Samson RS et al. MSJ 2014; 20(10):1322-30; [11] Schmierer K et al. Ann Neurol. 2004;56(3):407-15; [12] Schmierer K et al. J Magn Reson Imaging. 2007; 26(1):41-51); [13] Seewann, et al. Multiple Sclerosis 17, 1202-1210 (2011); [14] Chen et al., Neurology 80, 246-252 (2013); [15] Prados F et al. NeuroImage 2016; 139: 376-384; [16] Cardoso, MJ et al. IEEE Transactions on Medical Imaging 2015; 34:1976–88; [17] Yezzi A, Prince JL. Comp Vis; 2002. p. 575-89; [18] Cardoso MJ et al. IPMI, 2011. p. 159-70; [19] Modat M et al. Comp Methods Prog Biomed. 2010; 98: 278-84; [20] Ourselin S et al. Image & Vis Comp. 2001; 19: 25-31.Figures
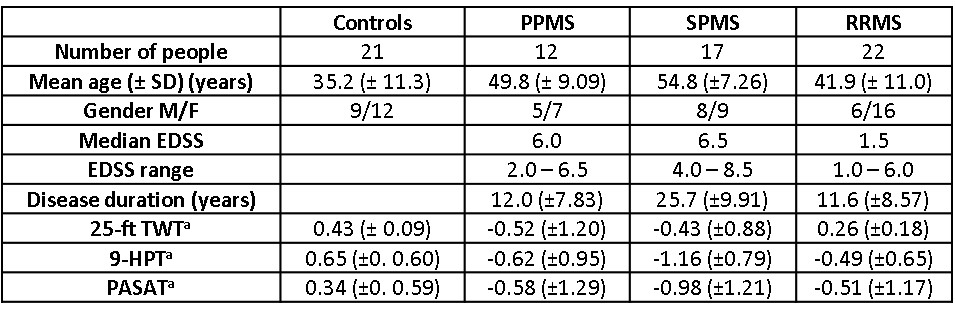
Figure 1: Subject Demographics
aComponents of the MS Functional Composite (MSFC) (nine hole peg test [9HPT], 25 foot timed walk test [TWT] and Paced Auditory Serial Addition Test [PASAT], expressed as z-scores (Fischer JS et al. Mult Scler. 1999; 5: 244-50)) were determined, calculated using published normative data.
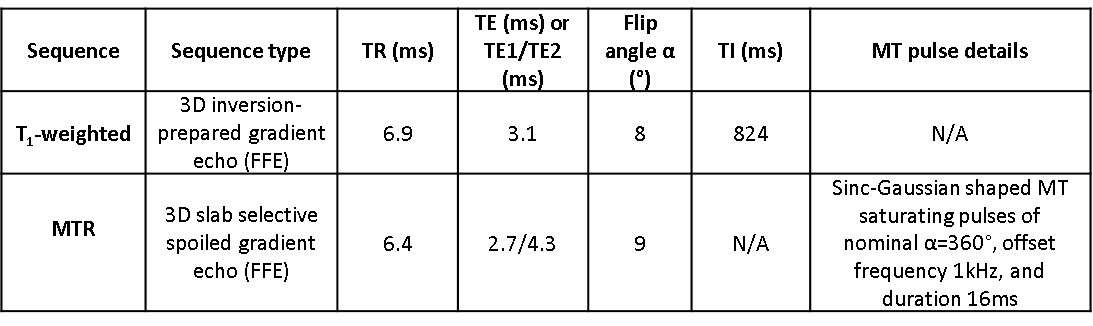
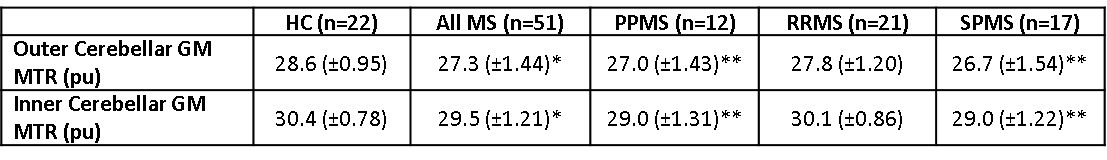
Figure 3: Inner and outer cerebellar GM MTR values for all subgroups
*p<0.05, **p<0.01 compared to controls with age, gender and cerebellar GM volume included as covariates (ANCOVA).