0216
Using myelin water and diffusion basis spectrum imaging to differentiate demyelination, inflammation, oedema and axonal damage in subjects with multiple sclerosis1Radiology, University of British Columbia, Vancouver, BC, Canada, 2Radiology, Washington University, St. Louis, MO, United States, 3Medicine (Neurology), University of British Columbia, Vancouver, BC, Canada, 4Physics and Astronomy, University of British Columbia, Vancouver, BC, Canada
Synopsis
This study compared myelin water fraction (MWF), intra/extracellular water geometric mean T2 (ieGMT2) and diffusion basis spectrum imaging (DBSI)-derived measures in multiple sclerosis (MS) lesions and normal appearing white matter. 14 MS subjects were scanned with 48-echo T2 relaxation and DBSI sequences. Significant correlations were found for MWF vs radial diffusivity, MWF vs fiber fraction, and ieGMT2 vs restricted fraction. Lesions showed changes consistent with decreased myelin and axons. Enhancing lesions also showed increased oedema. By quantitatively distinguishing and tracking inflammation, axon and myelin injury, DBSI and myelin water imaging can inform us of the pathological processes involved in MS.
Purpose
Multiple sclerosis (MS) is a disease characterised by myelin and axonal damage in the central nervous system (CNS). Multi-echo T2 relaxation can separate water into different compartments: a compartment assigned to water trapped between myelin bilayers labeled myelin water (T2=~20ms), a compartment assigned to intra and extracellular water (T2=60-80ms) and finally a compartment assigned to cerebrospinal fluid (T2>1s). The fraction of water within the myelin water compartment (myelin water fraction, MWF1) has been histopathologically validated as a marker for myelin2. The geometric mean T2 of the intra/extracellular water compartment (ieGMT2) is sensitive to the tissue water environment and is expected to increase with oedema and inflammation3.
Another quantitative imaging technique has recently been developed, diffusion basis spectrum imaging (DBSI), to model myelinated and unmyelinated axons as anisotropic diffusion tensors, and to model cells and extracellular space as isotropic diffusion tensors to simultaneously quantify axonal injury, myelination, inflammation and oedema in the CNS4. Numerous measurements can be derived from the DBSI data. Axial diffusivity (λax) is related to axonal integrity and radial diffusivity (λrad) is modulated by myelin5. The fiber fraction is a measure of the density of axons6. The isotropic restricted diffusion fraction reflects changes in cellularity resulting from inflammation whereas the isotropic hindered diffusion fraction increases during vasogenic oedema6.
The purpose of this study was to determine myelin using MWF and inflammation, oedema and axonal integrity using DBSI-derived measures in MS lesions and normal appearing white matter (NAWM). Together, these two techniques can give a more complete picture of the underlying pathology within the MS brain.
Methods
Fourteen subjects with relapsing remitting MS were scanned on a 3T Philips scanner. Scanning sequences included a 48 echo GRASE T2 relaxation sequence (TR=1073ms, TE=8ms, 1x1x2.5mm3, 40 slices)7, a DBSI sequence (99 directions, range of b values=0-1500, TE=79ms, TR=4798ms, 2x2x2mm3, 40 slices), and structural proton-density (PD)-weighted, T2-weighted, 3D T1-MPRAGE and a post-gadolinium T1 sequences for tissue identification. T2 distributions were calculated for every voxel using a modified Extended Phase Graph algorithm combined with regularized non-negative least squares and flip angle optimization8,9. ieGMT2 was calculated as the mean T2 from 40-200ms on a geometric scale. DBSI data was analysed to calculate diffusivities, fiber fraction, hindered isotropic diffusion fraction and restricted isotropic diffusion fraction images10. The 3DT1 scan was segmented using FAST11 to obtain a NAWM mask. Lesions were outlined on the PD/T2-W images. Four subjects were found to have enhancing lesions. Masks were overlaid onto MWF and DBSI derived images to obtain mean measurements.Results
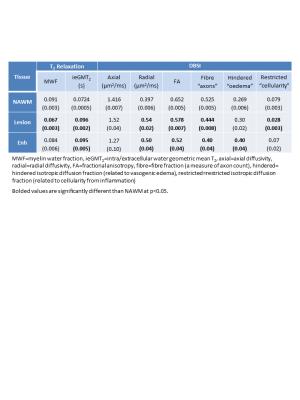
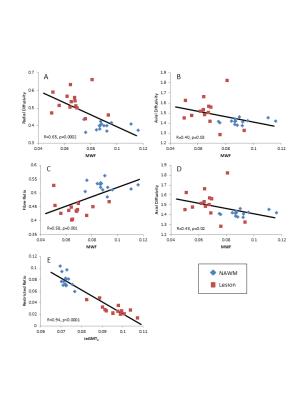
Means of the MR measurements from both sequences are shown in Table 1. Enhancing and non-enhancing lesions showed increased ieGMT2, λrad and FA as well as decreased fiber fraction. Non-enhancing lesions also displayed decreased MWF and restricted isotropic diffusion fraction whereas enhancing lesions had increased hindered isotropic diffusion fraction. Plots comparing MWF, ieGMT2 and various DBSI-derived measures are shown in Figure 1. Significant correlations were found for MWF vs λrad (R=0.65, p=0.0002), MWF vs fiber fraction (R=0.58, p=0.001) and ieGMT2 vs restricted isotropic diffusion fraction (R=0.94, p<0.0001).Discussion
Conventional DTI performs reasonably well at identifying axonal injury (decreased λax) and demyelination (increased λrad) when the signal within an image voxel comes from coherent axon bundles without confounding inflammation or tissue loss. During injury, the DTI-derived λax and λrad become less consistent because inflammation-associated increases in cellularity and vasogenic oedema exerts unpredictable yet opposite effects on directional diffusivity. DBSI, however, incorporates a spectrum of isotropic diffusion tensor components allowing the estimation of cellularity and oedema contents4. Enhancing lesions showed increased oedema (increase in hindered fraction as well as ieGMT2) but only slight increase in cellularity (small increase in restricted fraction). In both enhancing and non-enhancing lesions, the increase in λrad was accompanied by a decrease in MWF as expected. The λax was slightly decreased in enhancing lesions, suggesting an early initation of axonal injury not yet reaching statistical significance. In contrast, slightly increased λax was seen in non-enhancing lesions likely reflecting axonal demage in this region. The decrease in fiber fraction was expected in lesions due to the likely presence of axonal damage or reflecting the dilution effect of increased oedema; the even more pronounced decrease in enhancing lesions suggests the presence of more severe vasogenic oedema.Conclusions
By quantitatively distinguishing and tracking oedema, inflammation, axon and myelin injury, DBSI and myelin water imaging can further our knowledge of the pathological processes involved in MS. They may also provide efficient assessment of disease-modifying interventions and help in treatment planning to reflect individual patient response.Acknowledgements
We would like to thank the technologists and volunteers. We acknowledge the ongoing support from Philips Healthcare. This research was supported by Hoffmann-LaRoche.References
1. MacKay A, Whittall K, Adler J, et al. In vivo visualization of myelin water in brain by magnetic resonance. Magn Reson Med 1994; 31(6): 673-677.
2. Laule C, Kozlowski P, Leung E, et al. Myelin water imaging of multiple sclerosis at 7 T: correlations with histopathology. Neuroimage 2008; 40(4): 1575-1580.
3. Stanisz GJ, Webb S, Munro CA, et al. MR properties of excised neural tissue following experimentally induced inflammation. Magn Reson Med 2004; 51: 473-479.
4. Wang Y, Wang Q, Haldar JP, et al. Quantification of increased cellularity during inflammatory demyelination. Brain 2011; 134: 3590–3601.
5. Song SK, Sun SW, Ju WK, et al. Diffusion tensor imaging detects and differentiates axon and myelin degeneration in mouse optic nerve after retinal ischemia. Neuroimage 2003; 20: 1714–22.
6. Wang Y, Peng Sun P, Wang Q, et al. Differentiation and quantification of inflammation, demyelination and axon injury or loss in multiple sclerosis. Brain 2015; 138: 1223–1238.
7. Zhang J, Vavasour I, Kolind S, et al. Advanced Myelin Water Imaging Techniques for Rapid Data Acquisition and Long T2 Component Measurements. ISMRM 2015; p824.
8. Prasloski T, Mädler B, Xiang Q-S, et al. Applications of stimulated echo correction to multicomponent T2 analysis. Magn Reson Med 2012; 67: 1803–1814.
9. Whittall KP and MacKay AL. Quantitative interpretation of NMR relaxation data. J Magn Reson 1989; 84: 134–152.
10. Ellingson BM, Salamon N, Grinstead JW, et al. Diffusion tensor imaging predicts functional impairment in mild-to-moderate cervical spondylotic myelopathy. Spine J 2014; 14: 589–97.
11. Zhang, Y. and Brady, M. and Smith, S. Segmentation of brain MR images through a hidden Markov random field model and the expectation-maximization algorithm. IEEE Trans Med Imag, 2001; 20(1): 45-57.
Figures

