0215
Glutamate-Sensitive CEST in Cortical Gray Matter: Application to Cognitive Impairment in Multiple Sclerosis1Department of Radiology and Radiological Sciences, Vanderbilt University Medical Center, Nashville, TN, United States, 2Vanderbilt University Institute of Imaging Science, Vanderbilt University Medical Center, Nashville, TN, United States, 3Stroke Institute, Seton Dell Medical School, Austin, TX, United States, 4Department of Neurology, Seton Dell Medical School, Austin, TX, United States, 5Department of Neuroscience, University of Texas, Austin, TX, United States, 6Department of Neurology, Vanderbilt University, Nashville, TN, United States, 7Department of Biomedical Engineering, Vanderbilt University, Nashville, TN, United States
Synopsis
Altered glutamate regulation in gray matter (GM) has been implicated in the pathogenesis of cognitive impairment in multiple sclerosis (MS), but such pathology in GM is subtle and difficult to detect using conventional MRI techniques. In this work, we apply a quantitative, glutamate-sensitive chemical exchange saturation transfer (GluCEST) MRI technique at 7.0T to gain new insights into molecular changes underlying GM pathology and their relationship to cognitive impairment in MS. We found significant differences in cortical GM GluCEST contrast between healthy controls and patients with MS, and in some cortical regions, GluCEST contrast correlates significantly with measures of cognitive impairment.
Purpose
Cognitive impairment (CI) affects ~70% of individuals with multiple sclerosis (MS)1,2, has profound effects on quality of life, and is challenging to monitor due to diverse symptomology2-4. A relation between gray matter (GM) damage and CI has been supported by clinical and MRI studies5-7, yet GM pathology is difficult to detect using conventional MRI1. Brain MR spectroscopy has linked dysfunctional glutamate regulation to CI, yet suffers from poor spatial resolution and long acquisition times8-9. The unmet need is to develop high-resolution, clinically-accessible MRI techniques allowing early detection of molecular changes in GM, prediction of future CI, and evaluation of treatment response in MS. Chemical exchange saturation transfer (CEST) MRI offers higher resolution and large anatomical coverage, and harnesses the solute-to-water proton exchange to enhance detection sensitivity of low-concentration small and mobile metabolites10-12. Glutamate-sensitive CEST (GluCEST) has been demonstrated at 7T in healthy human brain and in patients with epilepsy13-15, but has not been investigated in cortical GM in MS or CI. Here, we apply GluCEST imaging to pathology in cortical GM of MS patients and examine correlations between CEST-derived indices and CI.Methods
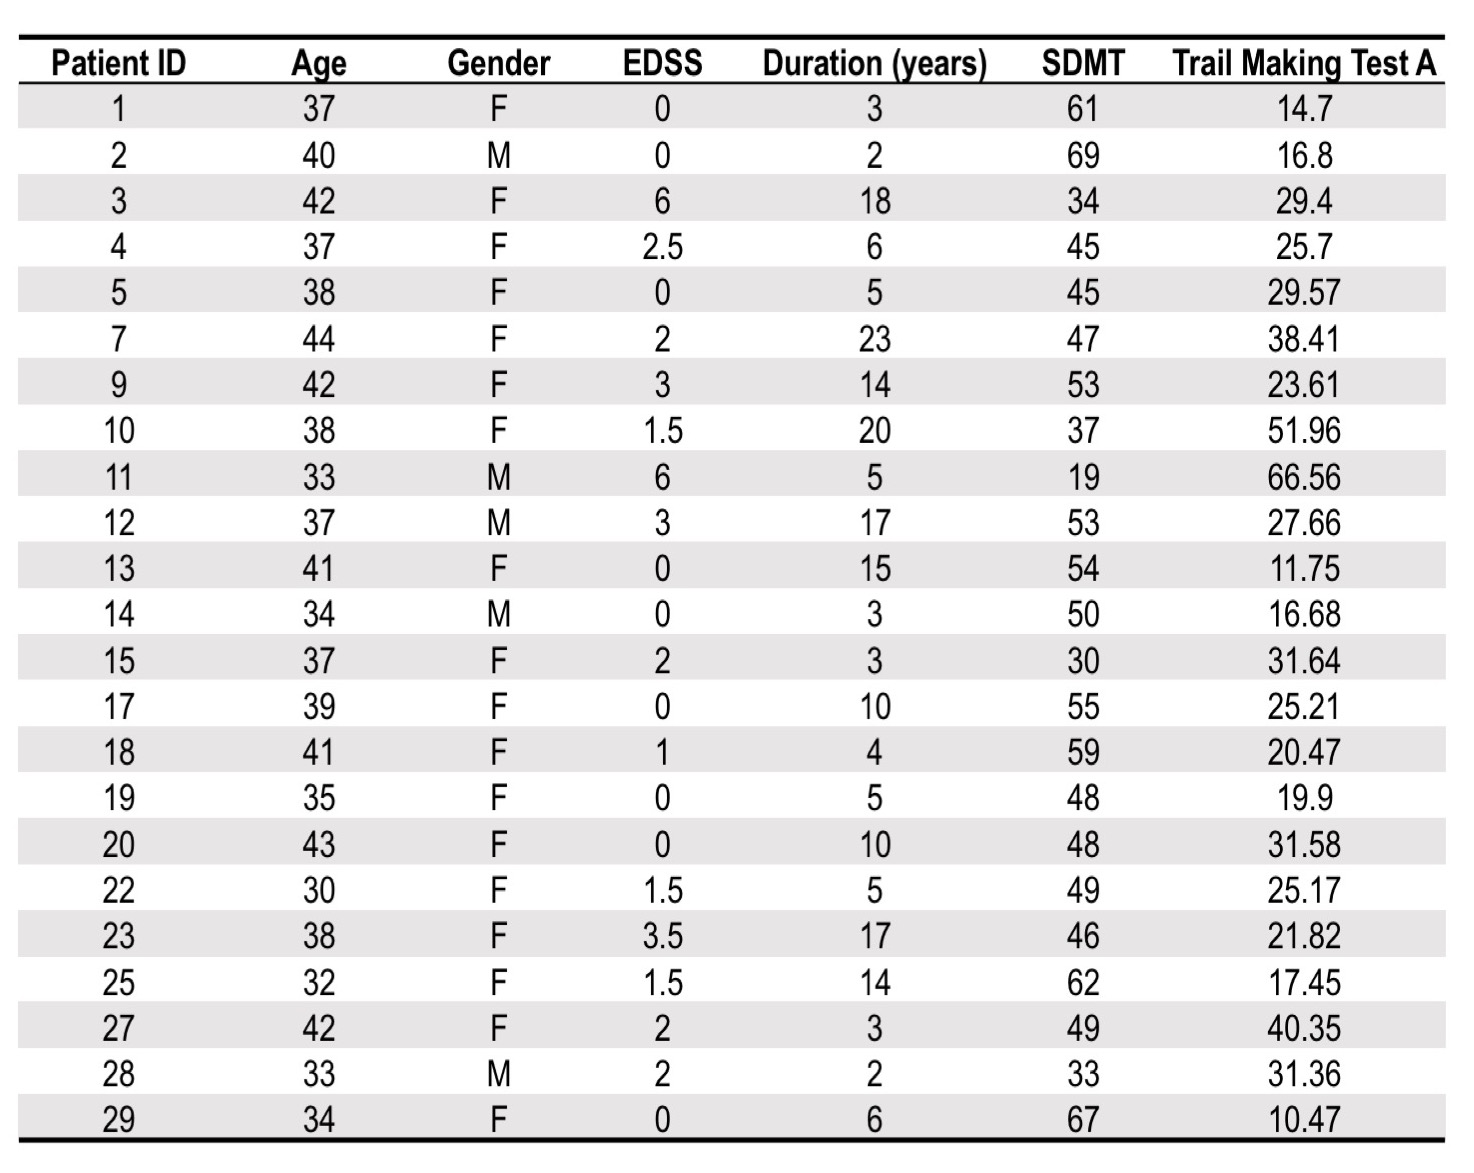
After signed, informed consent, 23 patients with MS (Table 1) and 22 sex/age-matched healthy volunteers were enrolled. Imaging was performed using a 7.0T MR scanner (Philips Achieva) with 2 channel volume transmit and 32-channel receive head coil (Nova Medical).
The CEST sequence consisted of a 2D multi-shot TFE sequence (factor=3, TR/TE/α=5.6ms/2.7ms/10°, 0.94x0.94x10mm3 resolution). CEST saturation: 4.25μT pulse train (10ms Gaussian pulses, 90% duty cycle, 100ms total duration) at 49 frequency offsets (Δω between +/-5.0ppm) and one reference (S0, Δω=80.0ppm). A 3D MP-RAGE was obtained for segmentation.
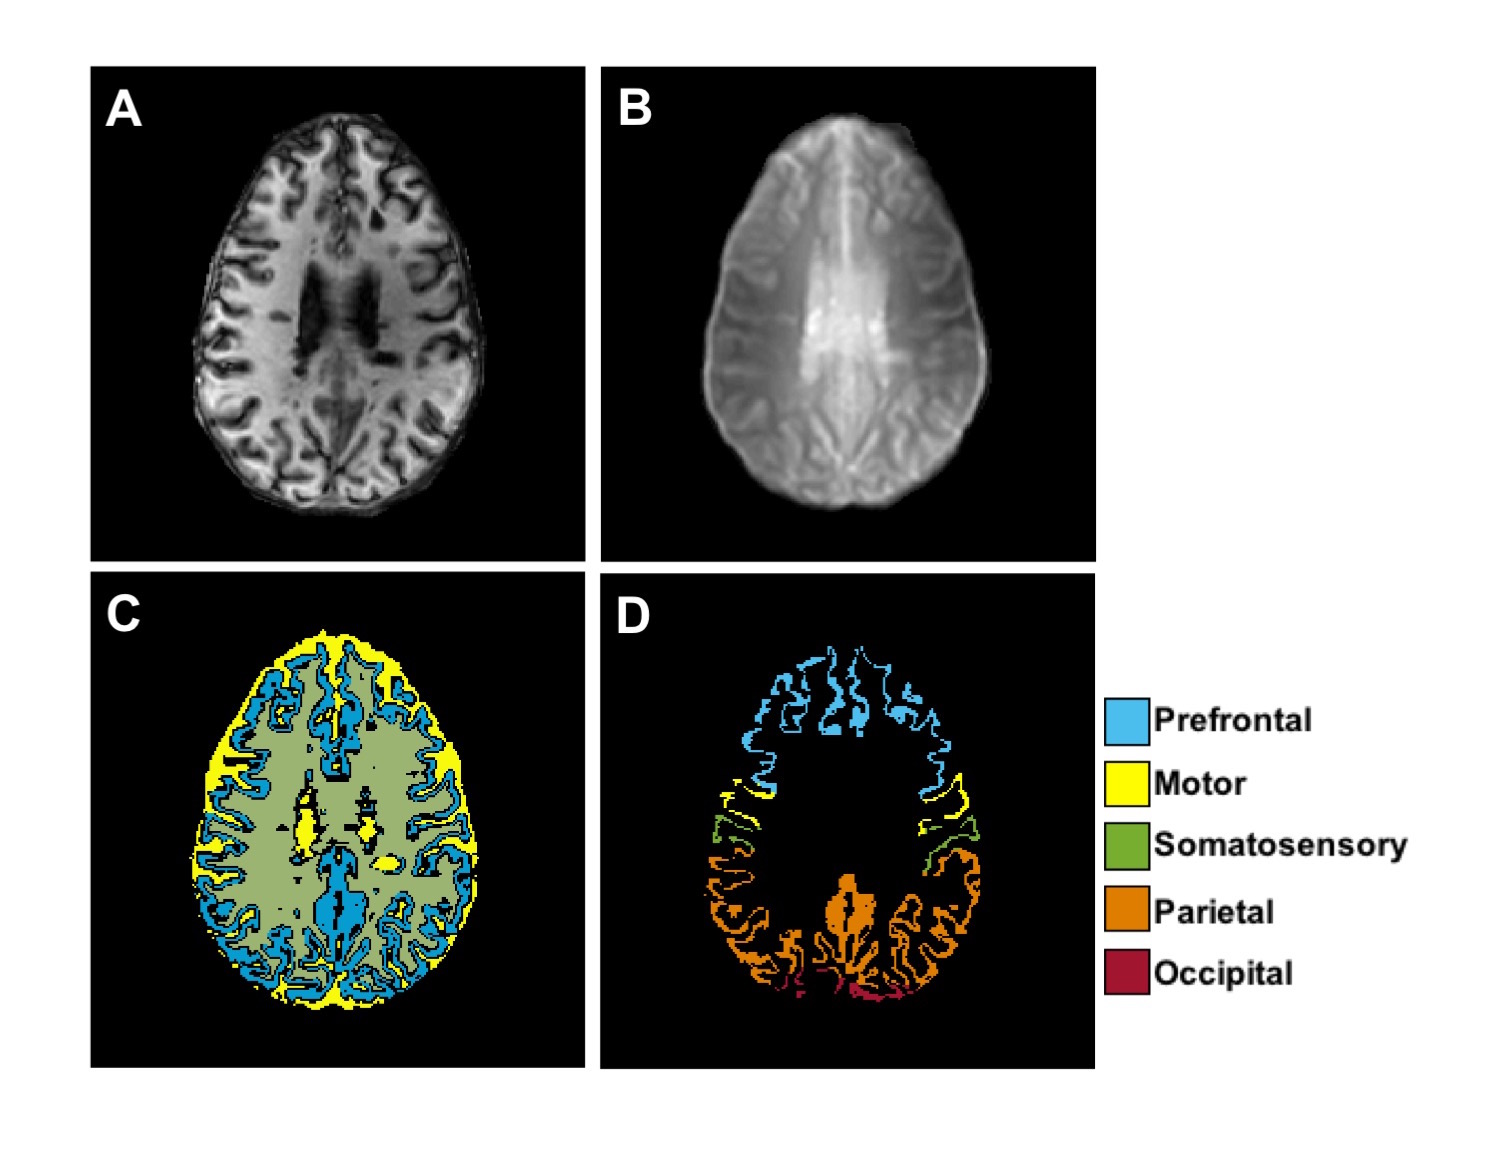
Tissue masks for GM, WM, and CSF were segmented in SPM12 from the MP-RAGE. GM was further divided into distinct cortical regions using multi-atlas labeling segmentation16. The MP-RAGE slice and tissue masks were registered to the CEST (S0) using FLIRT in FSL17.
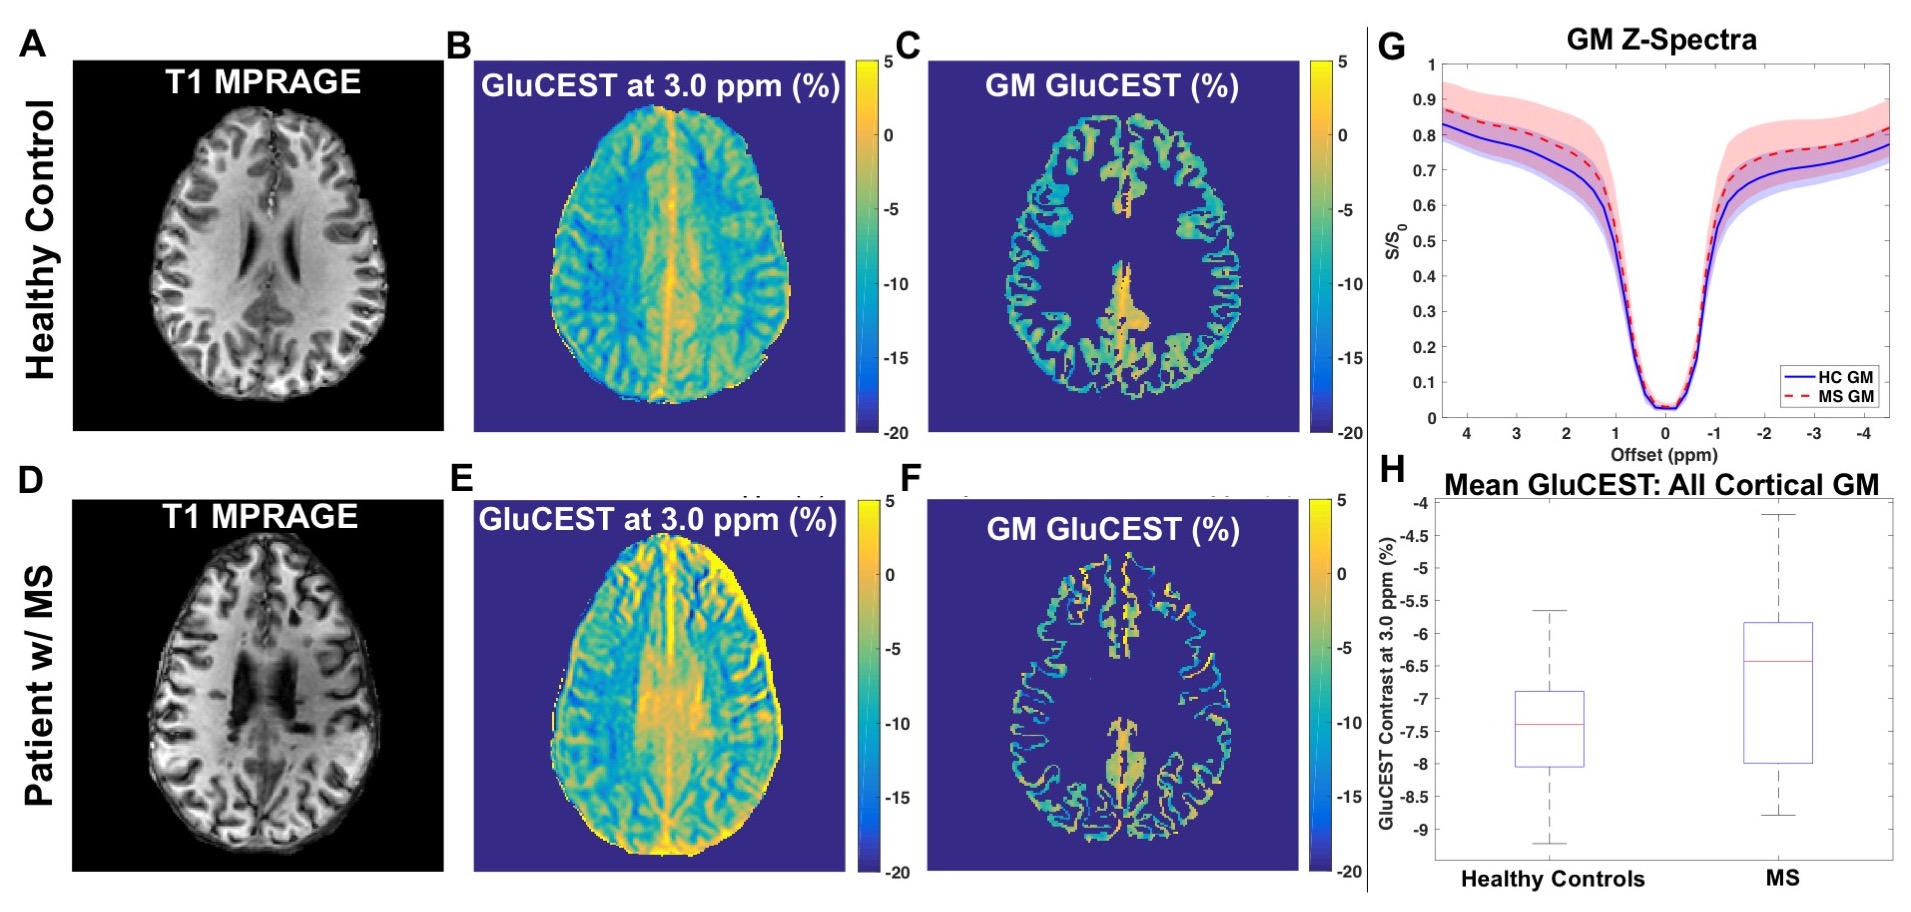
All CEST acquisitions were registered and normalized to the reference acquisition (S0). CEST z-spectra were corrected voxel-wise for B0 and B113 inhomogeneity. GluCEST contrast was calculated: [S(-Δω)-S(+Δω)]/S(-Δω) where Δω=3.0ppm for glutamate amine protons13. A Wilcoxon rank sum test was performed on mean GluCEST (all GM and by region) for each cohort to test differences in GluCEST contrast related to cortical pathology in MS. Spearman’s rank correlation coefficient was used to investigate associations between GluCEST and cognitive function in MS patients using scores from a battery of cognitive tests1 administered before the 7T scan.
Results
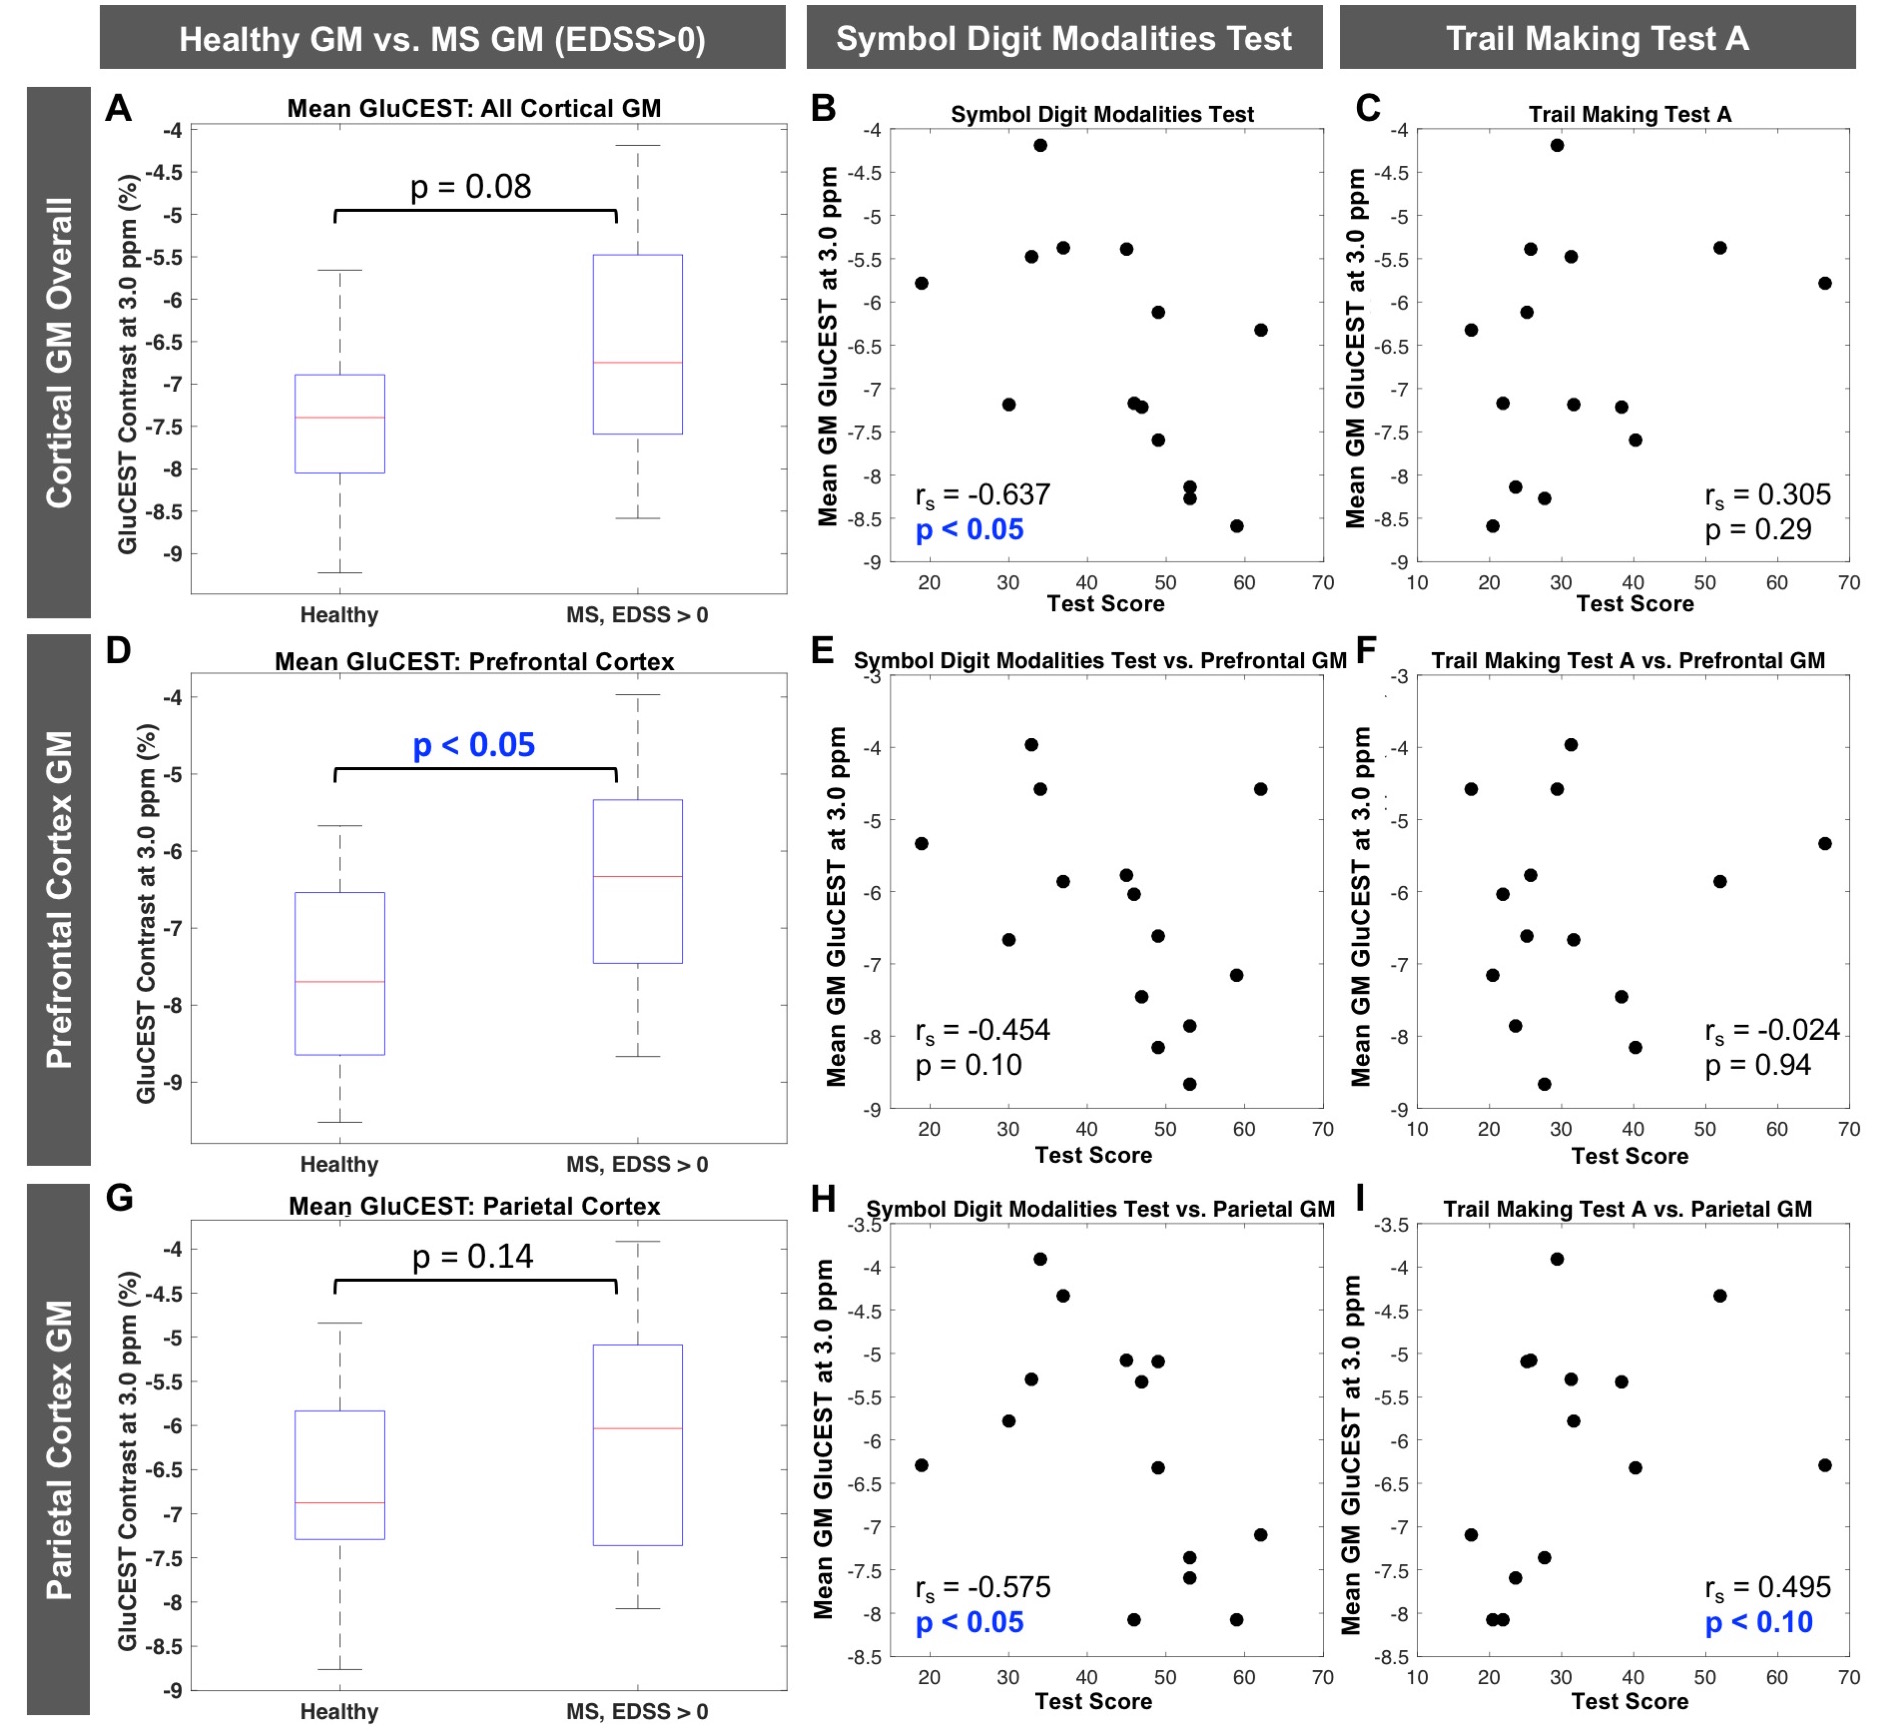
Figure 1 shows MP-RAGE (A) and raw CEST (B), GM segmentation (C), and cortical regional labeling (D) images for an MS patient. Figure 2(A-F) shows GluCEST (Δω=3.0ppm) maps in a healthy control and a patient with MS and average GM z-spectra for the two cohorts (Fig. 2G). In the entire patient cohort, a trend toward greater cortical GM GluCEST in patients with MS was seen (Fig. 2H). Moderately strong but insignificant correlations were observed between regional GluCEST contrast and cognitive test scores. In examining MS patients with some degree of accumulated disability (EDSS>0, n=14), we observed that the trend toward greater cortical GM GluCEST held true (p=0.08) (Figure 3). GluCEST contrast in the overall cortical ribbon showed a significant correlation with the Symbol Digit Modalities Test (SDMT, score=items completed) (p<0.05), and a moderate association with Trail Making Test A (TMT-A, score=time to complete). Regional analysis shows GluCEST contrast to be greater in patients in the prefrontal cortex (p<0.05) and a trend toward greater parietal GluCEST in patients. In other regions there were no differences in GluCEST between groups. Strong associations were seen between GluCEST and SDMT for the prefrontal (rS=-0.454, p=0.10) and parietal (rS=-0.575, p<0.05) regions. Regional analysis also revealed that performance on TMT-A is strongly associated with parietal GluCEST (rS=0.495, p<0.10).Discussion and Conclusions
We demonstrate that GluCEST MRI at 7T is reflective of changes in cortical GM associated with MS, even in a patient cohort with a relatively low degree of disability, and GluCEST correlates with measures of CI. As expected, regional analyses, which are more specific than whole brain measurements, showed a higher degree of association between microstructural damage assessed by GluCEST and CI. The most robust association was observed with the SDMT which assesses information processing speed, the most common cognitive domain affected by MS1. GluCEST in the parietal cortex is also strongly associated with the TMT-A test, which assesses visual search skills and attention18. These findings demonstrate the potential of GluCEST MRI as a quantitative imaging technique for studying molecular changes in cortical GM underlying disease progression in MS.Acknowledgements
The authors would like to acknowledge all of the patients and control subjects who volunteered for our study, Dr. Bennett Landman for help with the B0 shift correction algorithm, Dr. Paul Newhouse for help with design of cognitive testing methods, and our MRI technologists: Kristen George-Durrett, Leslie McIntosh, Clair Jones, and Chris Thompson. Dr. O’Grady is supported by NIH/NIBIB Training Grant 5T32EB001628-14 (PI: John C. Gore). This work was supported in part by funding from DoD W81XWH-13-1-0073, NIH/NINDS R21NS087465, National MS Society, and NIH R01 EY023240 (Smith), Vanderbilt CTSA Grant RR024975, and NIH/NCATS KL2 TR 000446 (Dula).References
1. Rocca MA, et al., Clinical and imaging assessment of cognitive dysfunction in multiple sclerosis. Lancet Neurol. 2015; 14(3): 302-17.
2. Chiaravalloti ND and DeLuca J. Cognitive impairment in multiple sclerosis. Lancet Neurol. 2008; 7(12): 1139-51.
3. Rao SM, et al. Cognitive dysfunction in multiple sclerosis. I. Frequency, patterns, and prediction. Neurology. 1991; 41(5): 685-91.
4. Ruet A, et al. Cognitive impairment, health-related quality of life and vocational status at early stages of multiple sclerosis: a 7-year longitudinal study. J Neurol. 2013; 260(3): 776-84.
5. Geurts JJ, et al. Measurement and clinical effect of grey matter pathology in multiple sclerosis. Lancet Neurol. 2012; 11(12): 1082-92.
6. Calabrese M, et al. Detection of cortical inflammatory lesions by double inversion recovery magnetic resonance imaging in patients with multiple sclerosis. Arch Neurol. 2007; 64(10): 1416-22.
7. Calabrese M, et al. Cortical lesion load associates with progression of disability in multiple sclerosis. Brain. 2012; 135(Pt 10): 2952-61.
8. Srinivasan R, et al. Evidence of elevated glutamate in multiple sclerosis using magnetic resonance spectroscopy at 3 T. Brain. 2005; 128(Pt 5): 1016-25.
9. Muhlert N, et al. Memory in multiple sclerosis is linked to glutamate concentration in grey matter regions. J Neurol Neurosurg Psychiatry. 2014; 85(8): 833-9.
10. van Zijl PC, et al. Mechanism of magnetization transfer during on-resonance water saturation. A new approach to detect mobile proteins, peptides, and lipids. Magn Reson Med. 2003; 49(3): 440-9.
11. Dula, AN, Smith SA, and Gore JC. Application of chemical exchange saturation transfer (CEST) MRI for endogenous contrast at 7 Tesla. J Neuroimaging. 2013; 23(4): 526-32.
12. Dula AN, et al. Development of chemical exchange saturation transfer at 7 T. Magn Reson Med. 2011; 66(3): 831-8.
13. Cai K, et al., Magnetic resonance imaging of glutamate. Nat Med. 2012; 18(2): 302-6.
14. Kogan F, et al. Imaging of glutamate in the spinal cord using GluCEST. Neuroimage. 2013; 77: 262-7.
15. Davis KA, et al. Glutamate imaging (GluCEST) lateralizes epileptic foci in nonlesional temporal lobe epilepsy. Sci Transl Med. 2015; 7(309): 309ra161.
16. Asman AJ and Landman BA. Hierarchical performance estimation in the statistical label fusion framework. Medical image analysis. 2014; 18(7): 1070-81.
17. Jenkinson M and Smith SM. A global optimisation method for robust affine registration of brain images. Medical Image Analysis. 2001; 5(2): 143-156.
18. Bowie CR and Harvey PD. Administration and interpretation of the Trail Making Test. Nature Protocols. 2006; 1: 2277-2281.
Figures