0214
Combining QSM and MWF in multiple sclerosis: a marker for the inflammatory state of MS lesions?Carsten Stueber1,2, Alexey Dimov1, Kofi Deh1, Thanh Nguyen1, Yi Wang1, and David Pitt2
1Weill Cornell Medicine, New York, NY, United States, 2Yale University, New Haven, CT, United States
Synopsis
Multiple sclerosis (MS) is a demyelinating disease of the central nervous system. In particular, excess iron is considered to play an essential role in lesion activity. In this study, we combine iron-reflecting quantitative susceptibility mapping (QSM) and myelin water fraction (MWF) with histology in post-mortem tissue. Our results show that elevated iron concentrations at the lesion rim reflect pro-inflammatory microglial activity, suggesting to use QSM to determine levels of lesion inflammation and MWF for detecting ongoing demyelination.
Introduction
MRI is routinely used to diagnose and evaluate patients with multiple sclerosis (MS). In particular, Gadolinium (Gd) on contrast enhanced T1-weighted (T1w+Gd) MRI has become the standard tool to assess current inflammation of MS lesions [1]. Nevertheless, T1w+Gd offers only a small time-frame of about six weeks for lesion detection, when the brain-blood barrier (BBB) is disrupted [2]. After the BBB is reconstituted, microglial cells at the lesion periphery accumulate iron, which is associated with pro-inflammatory (M1) activation of microglia [3]. Since inflammatory lesion activity mainly occurs behind a closed BBB it cannot be detected with T1w+Gd. However, quantitative susceptibility mapping (QSM) is able to detect excess iron and in particular distinguish iron levels within MS lesions. Thus, QSM may be used to imply inflammatory activity in white matter MS lesions. Furthermore, myelin water fraction (MWF) allows to measure the degree of demyelination [4]. Our study combines QSM, MWF and histology of post-mortem tissue to investigate the correlation between susceptibility, iron distribution, demyelination and microglial activation in shell lesions.Methods
10 post-mortem brain slabs with MS lesions obtained from the Rocky Mountains MS Center (RMMSC, Westminster, CO) were scanned on 3 T clinical MRI scanners (GE Healthcare, Milwaukee, WI / SIEMENS, Erlangen) using an 8-channel coil. A T2FLAIR sequence (res. = 0.8 x 0.8 x 0.6 mm3, TE = 160 ms, TR = 9.6 s, bandwidth = ± 62.5 kHz) was used as well as a 3D-gradient echo (GRE) sequence (res. = 0.6 x 0.6 x 0.6 mm3, TE1 = 4.3 ms, ΔTE = 4.8 ms, # TE = 11, TR = 74.2 ms, bandwidth = ± 62.5 kHz, 3 orientations) for multiple orientation reconstruction of QSM (COSMOS) [5]. Additionally, MWF maps were created for 4 brain slabs using a fast acquisition with spiral trajectory and T2prep (FAST-T2) sequence (res. = 1x1x1 mm3, spiral TR = 7.8 ms, spiral TE = 0.5 ms, bandwidth = ± 125 kHz) [6]. Subsequent to scanning, tissue blocks were sectioned (5 μm) and stained for myelin (MBP), microglia (CD68), marker for pro-inflammatory activation (M1-polarization) (iNOS), M2-polarization (CD206), ferritin and ferric iron (Perls’); all DAB-enhanced. Histological slides were digitized with a digital scanner. Both, coronally orientated QSM maps and histologic sections were co-registered in FSL. Histologic images were converted into binary maps after background removal. Correlation analysis between MRI and histopathologic images was performed in ImageJ and MATLAB.Results
We investigated 18 white matter MS lesions in 10 different post-mortem brain slabs. Fig. 1 shows one selected lesion with a bright paramagnetic rim on QSM, which overlaps with iron-rich areas visible on iron (Perls’) and ferritin stain. Iron is predominantly stored in microglia (Fe+CD68) at the lesion rim indicated by the cellular marker CD68 (2nd col.). The threshold-based correlation between QSM and iron-positive microglia is 72% (Fig. 1 / 2nd row). Furthermore, the pro-inflammatory (M1-polarization) microglial marker iNOS shows a high spatial overlap with FeCD68+. Iron is mainly associated with microglia at the active lesion periphery, whereas most iron in the demyelinated lesion center is stored in axons and astrocytes (Fig. 2). Fig. 3 shows a shell-like lesion, where the hyperintense rim overlaps with spatial differences in myelination separating the demyelinated lesion center from normal appearing white matter.Discussion
For the first time we combined QSM and MWF to investigate the correspondence between shell lesions and inflammatory activity in post-mortem white matter MS tissue. We showed that the paramagnetic rim visible on QSM at the lesion edge corresponds to high concentrations of microglia-associated iron. Furthermore, the overlap between iron and pro-inflammatory marker (iNOS) implies that excess iron induces pro-inflammatory microglial activation at the lesion rim. Additionally, MWF shows differences in myelin concentration at the lesion edge, indicating a gradient of demyelination in regions of active inflammation, which cannot be detected with conventional T2FLAIR.Conclusion
Our preliminary results suggest that iron-sensitive QSM can be used to detect microglia-driven inflammation in white matter MS lesions, which occurs behind a closed blood brain and cannot be detected with standard MRI. Based on lesion susceptibility and geometry, QSM might allow to assess inflammatory states of individual lesions. Additionally, MWF complements QSM and offers a detailed assessment of ongoing demyelination at the active lesion edge. Thus, the combination of QSM and MWF for MS lesion imaging allows for a more precise characterization and classification of lesion status based on iron load and demyelination beyond conventional imaging methods.Acknowledgements
We acknowledge support from NIH grants R01NS072370, R01NS090464 and R01NS095562. Furthermore, we thank Mayyan Mubarak for the help of processing the brain tissue.References
1. Dousset, V., et al., AJNR Am J Neuroradiol., 2006. 27(5): p. 1000-1005.; 2. Gaitán, M.I., et al., Ann Neurol, 2011. 70(1): p. 22-29. 3. Mehta, V., et al., PLoS ONE, 2013. 8(3): p. 1-10.; 4. Laule, C., et al., NeuroImage, 2008. 40(4): 1575-1580. 5. Liu, T., et al., Magn Reson Med, 2009. 61(1): p. 196-204. 6. Nguyen, T., et al., Magn Reson Med, 2016. 76(2): p. 456-465.Figures
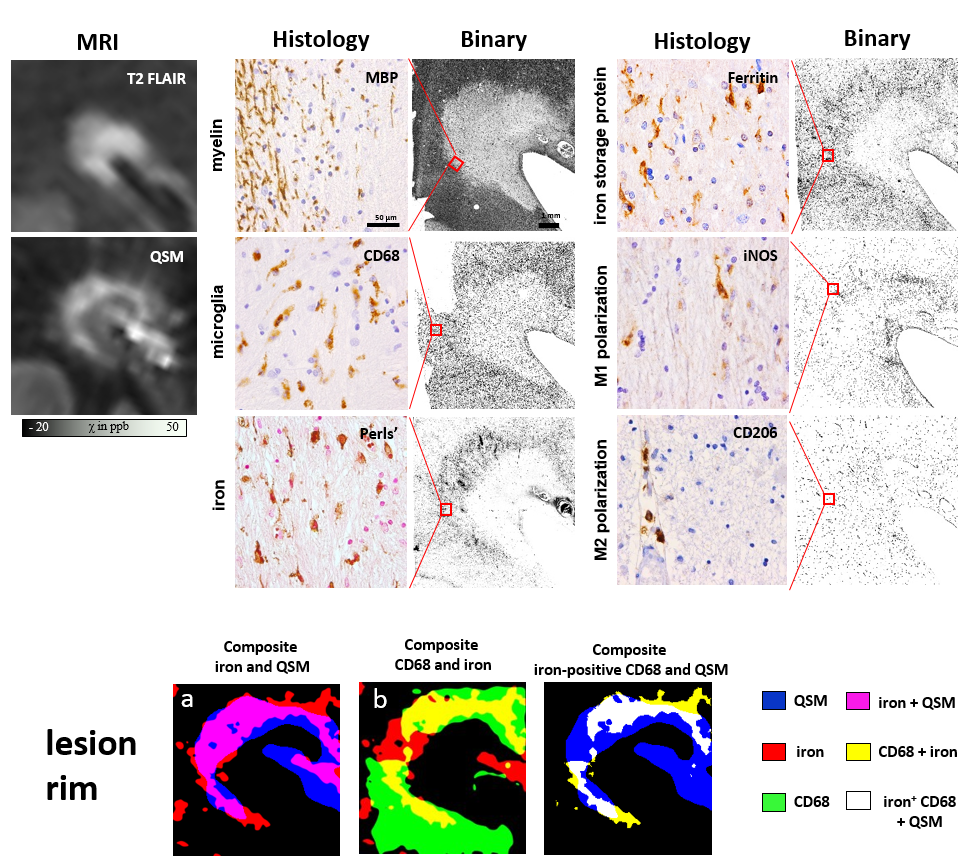
QSM and T2FLAIR of a single lesion are shown in the left column.
Col. 2 shows histopathologic stains of this lesion. Only microglia are stained
in the Perls’, ferritin, iNOS and CD206 stains. This confirms that iron is stored
in microglia at the lesion rim and furthermore inflammatory markers for lesion activity
are associated with microglia. The lower row shows the overlap of QSM, iron and
microglia (CD68) after thresholding the binary maps.
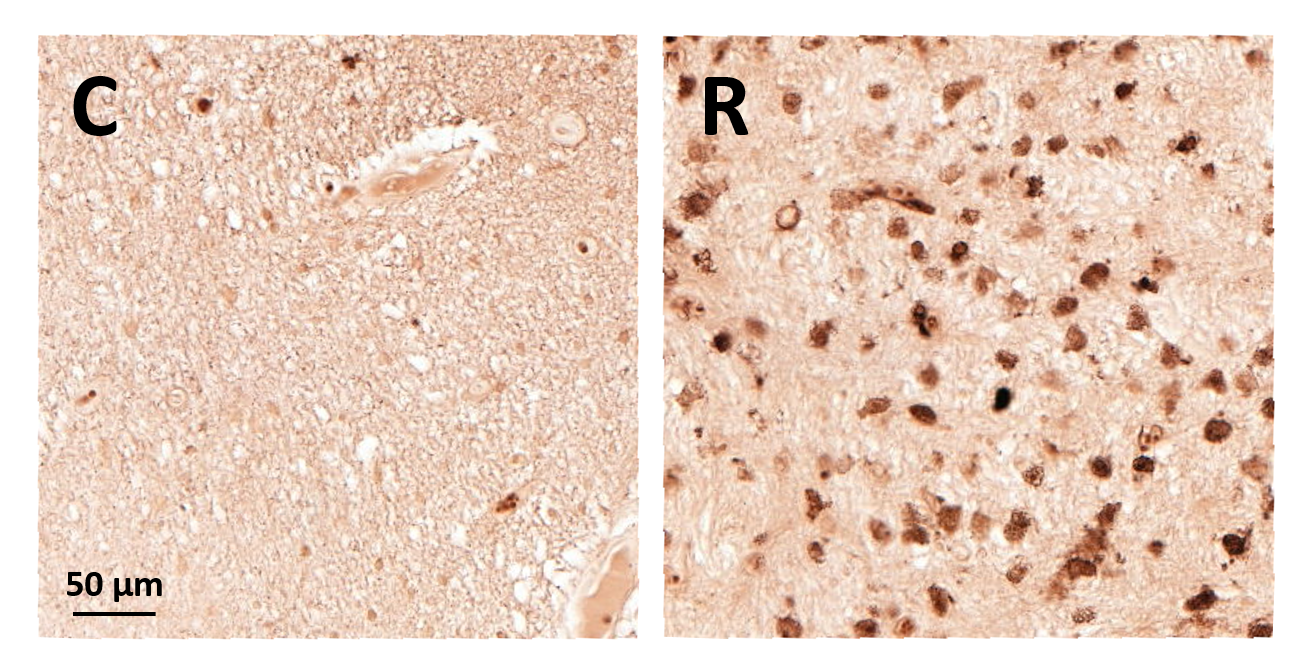
(C) Iron in the inactive demyelinated lesion center is stored
in astrocytes and axons. (R) Iron is stored in microglia at the lesion rim
contributing to inflammatory activity.

The white matter lesion is visible on MWF, which is
surrounded by normal appearing white matter (NAWM) (left). At the lesion edge, a
hyperintense rim is visible on QSM, which reflects microglia-associated iron (right).
The paramagnetic iron rim overlaps with a transition zone between demyelinated
lesion center and NAWM.