0213
MS lesions demonstrating a QSM hyperintense-rim have more myelin loss compared to those without a QSM hyperintense-rimYihao Yao1, Thanh D. Nguyen2, Sneha Pandya2, Sandra Hurtado Rúa3, Amy Kuceyeski4, Yi Wang2,5, and Susan A. Gauthier6
1Department of Radiology, Tongji Hospital, Tongji Medical College, Huazhong University of Science & T, Wuhan, People's Republic of China, 2Department of Radiology, Weill Cornell Medical College, New York, NY, United States, 3Department of Mathematics, Cleveland State University, Cleveland, OH, 4Department of Radiology, Weill Cornell Medicine Feil Family Brain and Mind Research Institute, New York, NY, United States, 5Biomedical Engineering, Cornell University, Ithaca, NY, United States, 6Department of Neurology, Weill Cornell Medical College, New York, NY, United States
Synopsis
Iron causes proinflammatory activation of microglia near the rim of white matter MS lesion. This is chronic inflammation with associated myelin tissue damage. We propose to use quantitative susceptibility mapping (QSM) to assess chronic inflammation, as hyperintense rim on QSM can be unequivocally interpreted as iron. We use myelin water fraction (MWF) to measure myelin. We have found that MS lesions with hyperintense rims on QSM have lower MWF and higher susceptibility compared to lesions without hyperintense rims on QSM (p<0.01). Hyperintense rim on QSM may provide a biomarker for tissue injury due to iron associated chronic inflammation.
Introduction
Iron accumulation frequently occurs at the edge of chronic active multiple sclerosis (MS) lesions, where chronically activated microglia are present and continued demyelination is occurring1, 2. The ability to study these lesions in-vivo requires an imaging modality to identify iron within the MS lesion. Quantitative susceptibility mapping (QSM) provides an effective means to directly map the distribution of susceptibility sources including iron by solving the field-to-source inversion problem3. In general, an increase in susceptibility on QSM in the MS lesion may be related to iron deposition and myelin loss, and combining QSM with a measurement of myelin by the well-validated myelin water fraction (MWF)4-6 would allow for a more accurate assessment of iron deposition7. In particular, hyperintense rim on QSM must contain iron, as myelin loss biophysically is less at the lesion rim than at the lesion center. The objective of this study was to combine the information from QSM and MWF to 1) identify a subset of MS lesions with higher iron deposition occurring at the rim (QSM hyperintense rim+ lesions) and 2) to investigate the consequence of increased iron deposition on lesion myelin tissue damage.Methods
QSM was reconstructed from a multi-echo gradient echo (GRE) imaging by using the morphology-enabled dipole inversion method. A multi-voxel nonlinear least-squares data-fitting algorithm with spatial smoothness constraints was used to reconstruct MWF maps from T2w images obtained with Fast Acquisition with Spiral Trajectory and T2prep (FAST-T2) sequence8, 9. Eighty-one QSM hyperintense rim positive (rim+) lesions and 185 rim negative (rim-) lesions were identified on QSM from 47 MS patients (15 men and 32 women, mean age 43.2 years ± 10.7) who underwent brain MRI at 3T. Classification of QSM rim+ vs. rim- lesions was a consensus of two neuroradiologists. Lesion MWF and QSM measurements were obtained using ITK-SNAP software. ROIs for whole lesion as well as core and rim areas of rim+ lesions were placed on standard T2WI and then were overlaid on QSM and MWF with manual adjustment as required. ROIs were also drawn in normal appearing white matter (NAWM) on contralateral mirror site of the lesions with similar shape and size to serve as a QSM reference. Two mixed-effects-models were implemented to assess the variables of interest: 1) QSM and 2) MWF between rim+ and rim- groups at lesion level. The modeling strategy accounts for patient variability and the following covariates: subtype of lesion (rim+ or rim-), QSM lesion volume, gender, and age. The final model is reported after using a back fitting procedure.Results
Figure 1 shows an example of T2WI and QSM and MWF maps from one patient, illustrating the appearance of rim+ and rim- lesions on QSM. QSM and MWF values for both rim and core ROI’s from QSM rim+ lesions were evaluated. For rim+ lesions, their QSM volume tend to be larger than T2w volume (Fig.2), the QSM value decreased from the rim (45.29 ± 13.6) to the core (31.52 ± 12.01) (p<0.01) (Fig 3a), and similarly, the MWF value decreased from the rim (0.045 ± 0.017) to the core (0.033 ± 0.018) (p<0.01) (Fig.3b). This pattern is consistent with iron deposition at the edge of rim+ lesions. QSM rim+ had higher whole-lesion susceptibility (38.07 ± 11.72) as compared to rim- lesions (26.4 ± 14.15), p<0.01 (Fig 4a). After accounting for patient variability as random effect (mixed-effects-model), the QSM values of rim + lesions remained significantly higher (7.91 ± 1.850), p<0.0001, and no significant association was found with any potential covariates. The whole-lesion MWF in QSM rim+ lesions was lower (0.041± 0.017) as compared to rim- (0.061 ± 0.019), (p<0.01) (Fig 4b). In the mixed-effects-model, the MWF values of rim+ lesions remained significantly lower (-0.013 ± 0.003), p<0.0001, with QSM lesion size remaining the only other significant covariate in the final model (p<0.0001).Discussion
We found that both QSM and MWF decrease centripetally from rim to core within MS lesions demonstrating a QSM hyperintense rim. Centripetal MWF decrease has corresponding susceptibility centripetal increase. The observed centripetal QSM decrease accompanying MWF centripetal decrease can be biophysically explained by the presence of highly paramagnetic iron that is also centripetally decreasing. Therefore, for identifying chronic active MS lesions, we can use dual QSM and MWF centripetal decrease to assess iron existence in lesion, in addition to the use of hyperintense QSM rim to assess iron existence. QSM hyperintense rim+ lesions demonstrated more demyelination suggesting iron involvement in myelin damage in the MS lesion.Conclusions
Hyperintense rim on QSM may provide a biomarker to study the role of iron on lesion myelin injury.Acknowledgements
We are acknowledged support from grants: R01NS072370, R01NS090464, R01NS095562,Genzyme, Biogen, Novartis, Mallincrodt.References
1. Hametner S, Wimmer I, Haider L, et al. Iron and neurodegeneration in the multiple sclerosis brain. Annals of neurology 2013;74:848-861 2. Mehta V, Pei W, Yang G, et al. Iron is a sensitive biomarker for inflammation in multiple sclerosis lesions. PLoS One 2013;8:e57573 3. Wang Y, Liu T. Quantitative susceptibility mapping (QSM): Decoding MRI data for a tissue magnetic biomarker. Magnetic resonance in medicine : official journal of the Society of Magnetic Resonance in Medicine / Society of Magnetic Resonance in Medicine 2014 4. Gareau PJ, Rutt BK, Karlik SJ, et al. Magnetization transfer and multicomponent T2 relaxation measurements with histopathologic correlation in an experimental model of MS. Journal of magnetic resonance imaging : JMRI 2000;11:586-595 5. Laule C, Leung E, Lis DK, et al. Myelin water imaging in multiple sclerosis: quantitative correlations with histopathology. Multiple sclerosis 2006;12:747-753 6. Laule C, Kozlowski P, Leung E, et al. Myelin water imaging of multiple sclerosis at 7 T: correlations with histopathology. NeuroImage 2008;40:1575-1580 7. Wisnieff C, Ramanan S, Olesik J, et al. Quantitative susceptibility mapping (QSM) of white matter multiple sclerosis lesions: Interpreting positive susceptibility and the presence of iron. Magnetic resonance in medicine 2015;74:564-570 8. Nguyen TD, Deh K, Monohan E, et al. Feasibility and reproducibility of whole brain myelin water mapping in 4 minutes using fast acquisition with spiral trajectory and adiabatic T2prep (FAST-T2) at 3T. Magnetic resonance in medicine : official journal of the Society of Magnetic Resonance in Medicine / Society of Magnetic Resonance in Medicine 2016;76:456-465 9. Nguyen TD, Wisnieff C, Cooper MA, et al. T2 prep three-dimensional spiral imaging with efficient whole brain coverage for myelin water quantification at 1.5 tesla. Magnetic resonance in medicine : official journal of the Society of Magnetic Resonance in Medicine / Society of Magnetic Resonance in Medicine 2012;67:614-621Figures
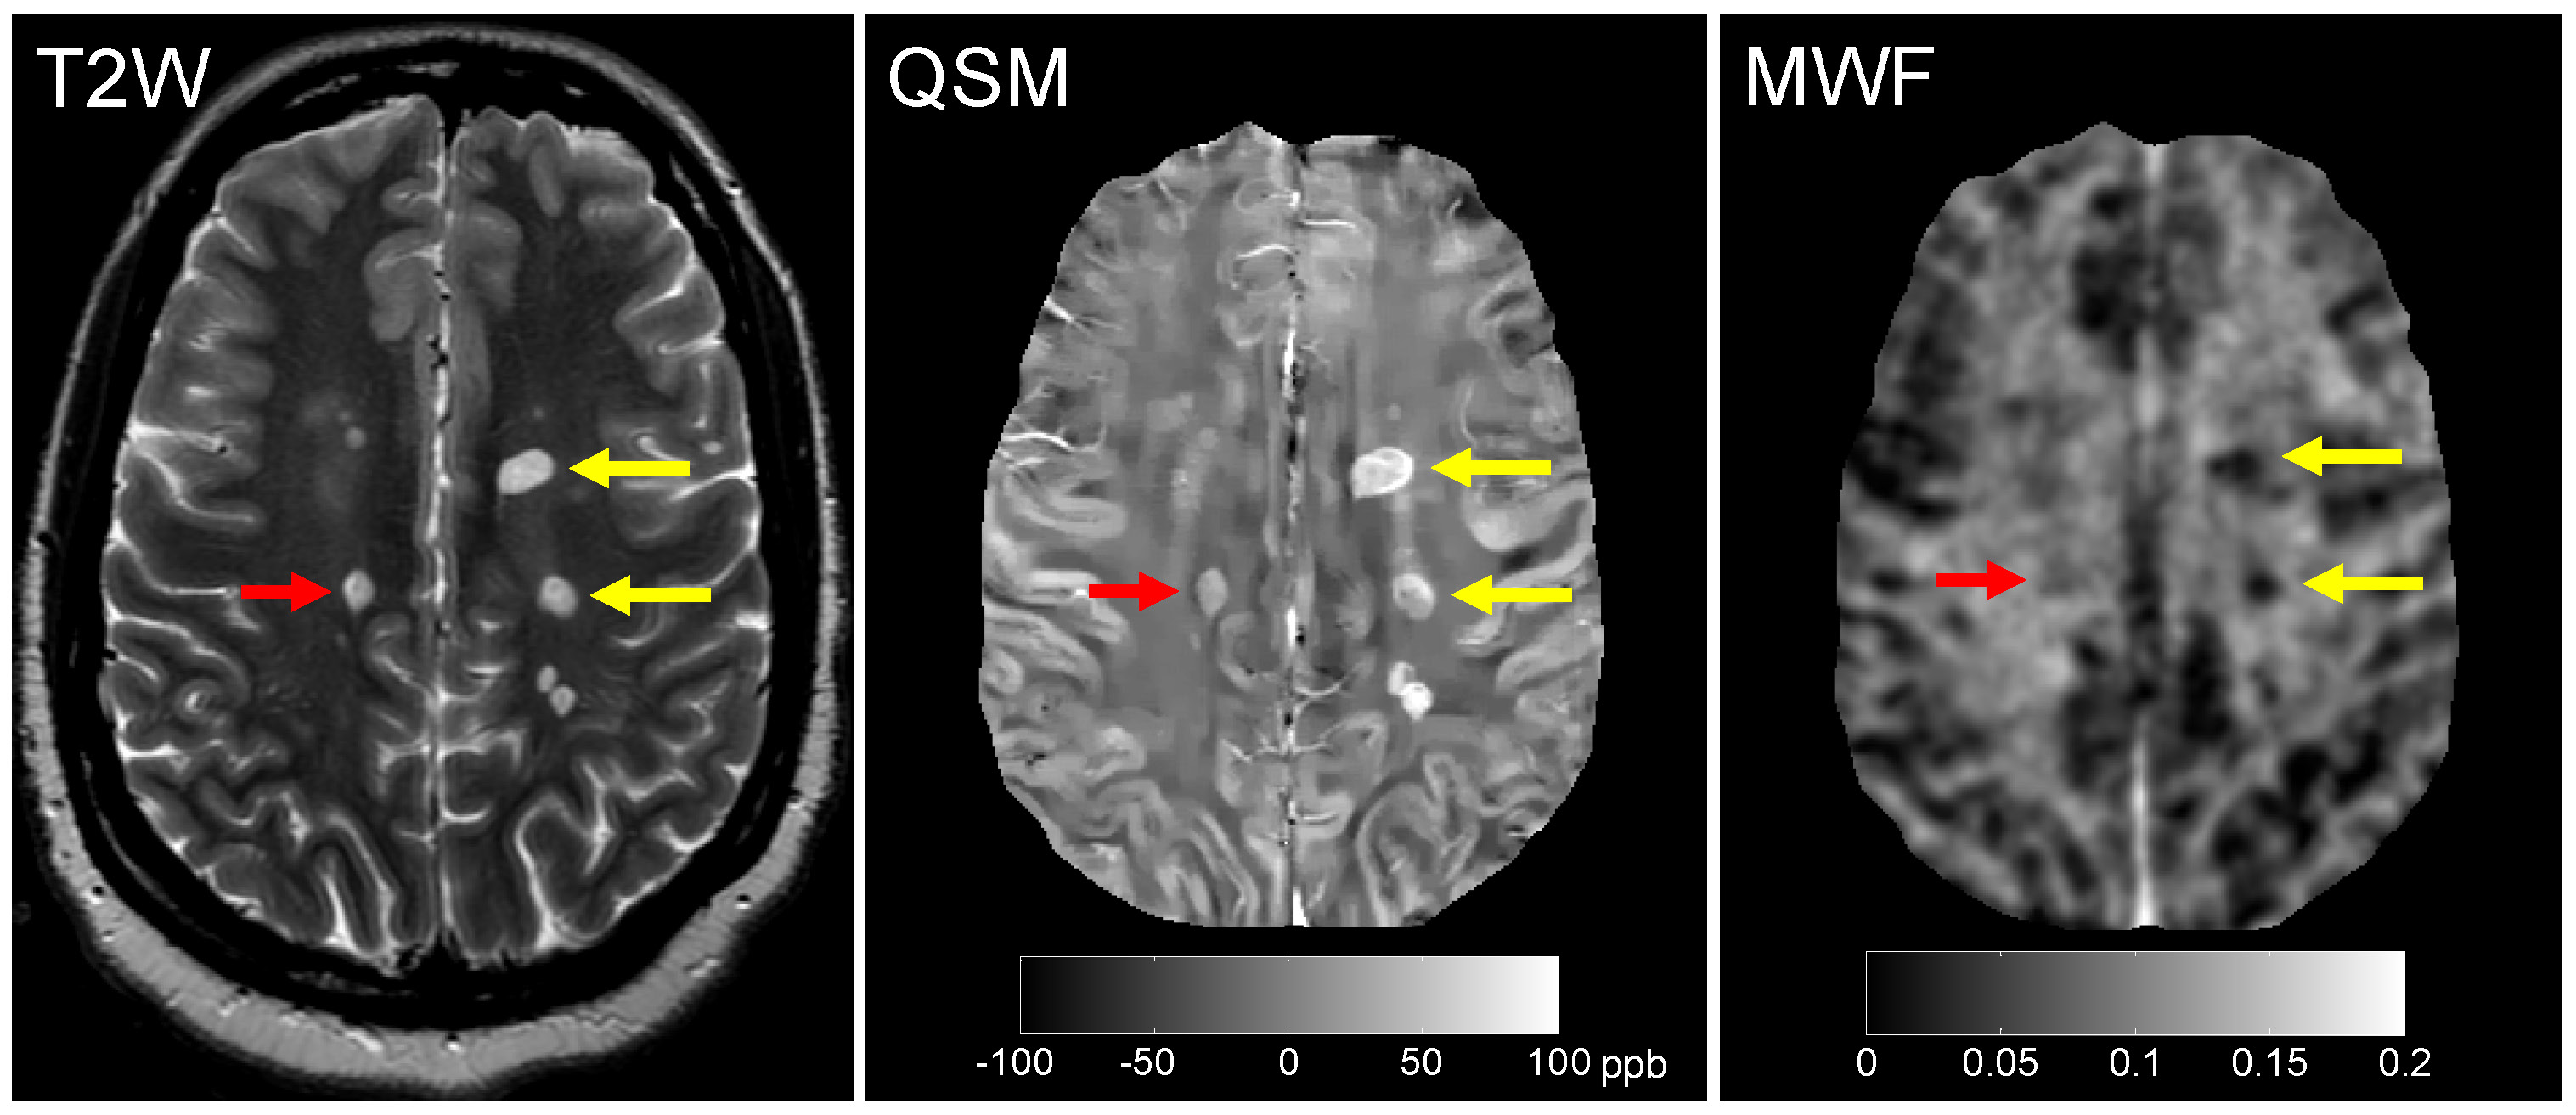
Fig. 1 Example of QSM rim+ (yellow arrow) and rim-
(red arrow) on standard T2w anatomical image and quantitative QSM and MWF maps.
Note the appearance of hyperintense edge on QSM of rim+ lesions, which are not
seen on T2w and MWF images. Also note the higher susceptibility and lower MWF
values of rim+ lesion as compared to rim- lesions, suggesting the detrimental
effect of iron deposition on lesion myelin.
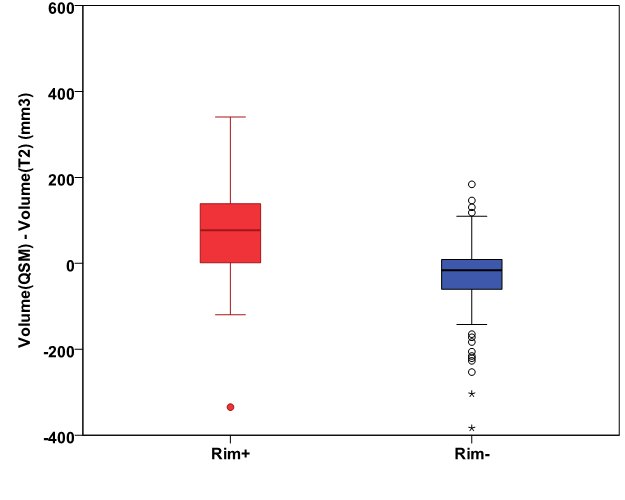
Fig 2. For rim+ lesions, lesion volumes on QSM are mostly
bigger than that on T2WI. For rim- lesions, lesion volumes on QSM are mostly
smaller than that on T2WI.
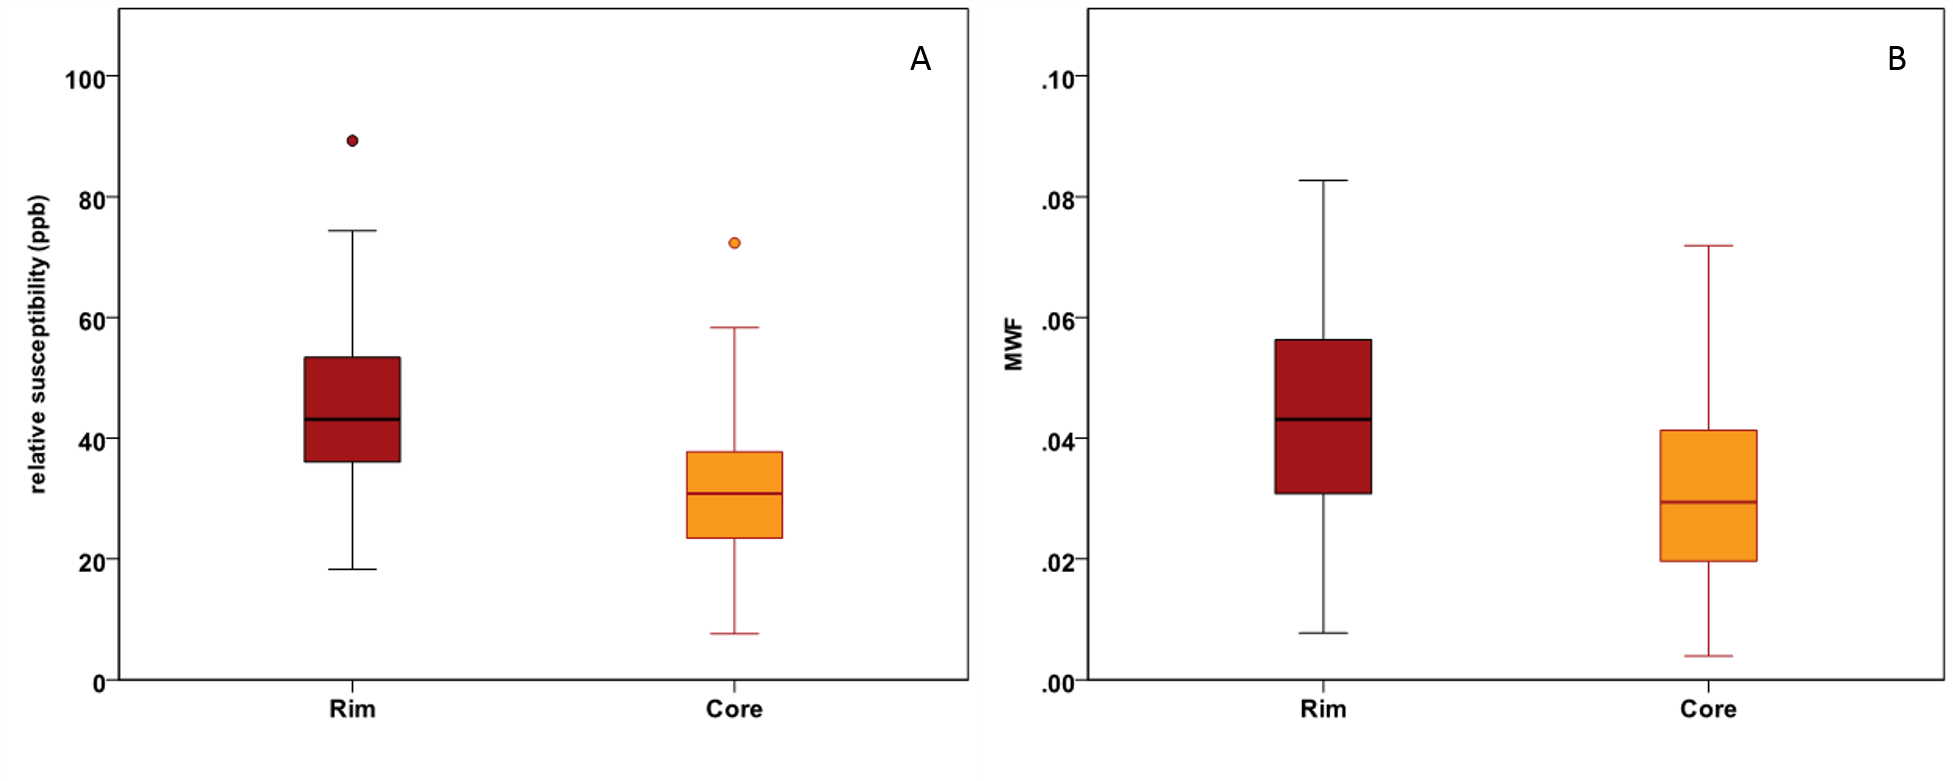
Fig.3 Rim area of Rim+ lesions had significantly higher susceptibility
(A) and higher MWF (B) as compared to core area of Rim+ lesions, consistent
with the presence of iron at the lesion edge.
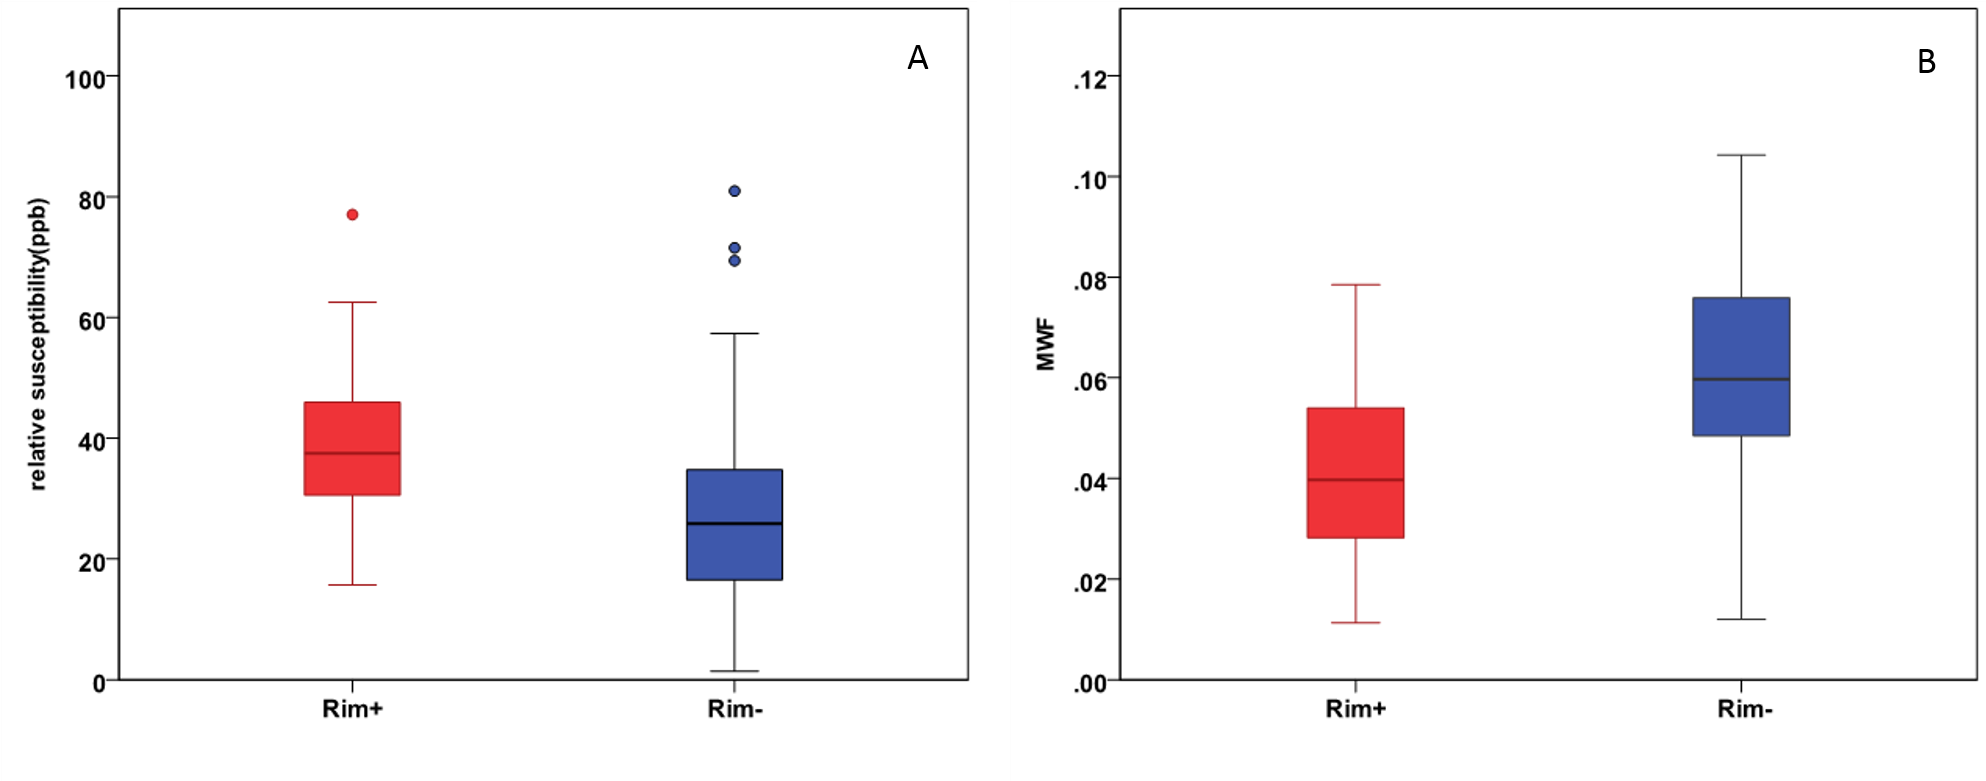
Fig.4 Rim+ lesions had significantly higher susceptibility (A)
and lower MWF (B) as compared to Rim- lesions.