0212
Metabolic counterparts of sodium accumulation in Multiple Sclerosis: A whole brain 1H-MRSI and 23Na-MRI study1Aix-Marseille University, CNRS, CRMBM UMR 7339, Medical School of Marseille, Marseille, France, Metropolitan, 2AP-HM, CHU Timone, Department of Imaging, CEMEREM, Marseille, France, 3Siemens Healthineers, Saint-Denis, France, Metropolitan, 4AP-HM, CHU Timone, Department of Imaging, CEMEREM, Marseille, France, Metropolitan, 5AP-HM, CHU Timone, Department of Neurology, Marseille, France, Metropolitan
Synopsis
To determine the metabolic counterparts of cerebral total sodium accumulations in patients with Multiple Sclerosis, we acquired fast 3D-1H-EPSI and Density-adapted 3D-UTE 23Na MRI at 3 Tesla covering the whole brain in 21 patients and 20 volunteers. Patients showed increased 23Na and decreased NAA, Glx and Cho levels. Stepwise analyses highlights association of 23Na accumulations with i) decreased NAA and Glx levels and increased Cho levels within GM, ii) with decreased NAA and increased Cho levels within NAWM and T2 lesion compartments. Clinical status of patients assessed by MSFC was correlated to GM and NAWM 23Na, NAA and Glx levels.
Introduction
Multiple Sclerosis (MS) is an inflammatory disease of the central nervous system characterized by three main pathophysiological processes including inflammation, demyelination and neurodegeneration (1). Recently, several studies have reported that accumulation of brain total sodium (23Na) concentration (TSC) could be a relevant marker of neurodegeneration, the main cause of irreversible deficit in MS (2) but in vivo proofs have not been provided yet. In the present study we sought to determine the metabolic counterparts of TSC accumulations by looking at the correlations between TSC obtained by 3D-23Na MRI (3) and the metabolic profiles assessed by whole brain 1H 3D-EPSI (4) within grey matter (GM), normal appearing white matter (NAWM) and T2 lesions of MS patients.Materials and Methods
Subjects: 21 RRMS patients (37±10.7 years old, 13 women) and 20 healthy volunteers (33.2±10.2 years old, 12 women). Clinical status of patients was assessed by EDSS and MSFC. MR acquisitions were performed on a Magnetom verio 3T (Siemens, Erlangen, Germany).
1H-MRSI: Two axial fast 3D-1H-EPSI with two different orientations (AC-PC and AC-PC+15°) with (TE/TR/TI=20/1710/198ms, voxel=1x1x1cm3, FOV=280x280x180mm3, flip angle=73°, matrix=50x50x18, GRAPPA factor=2, TA≈18min).
23Na-MRI: Density-adapted 3D radial projection reconstruction 23Na MRI (TE/TR=0.2/120ms, 17 000 projections, 369 samples/projection, readout time=20ms, flip angle=87°, voxel=3.6x3.6x3.6mm3, TA≈34min).
Conventional MRI: 3D-T1-weighted MPRAGE (TE/TR/TI=53.44/2150/1100ms, voxel= 1mm3, FOV=256mm, flip angle=8°, TA≈5min), axial double-TE TSE (TE1/TE2/TR=11/90/8500ms, FOV=250mm, flip angle=150°, matrix=2562, thickness=3mm, 49 slices, TA≈4min).
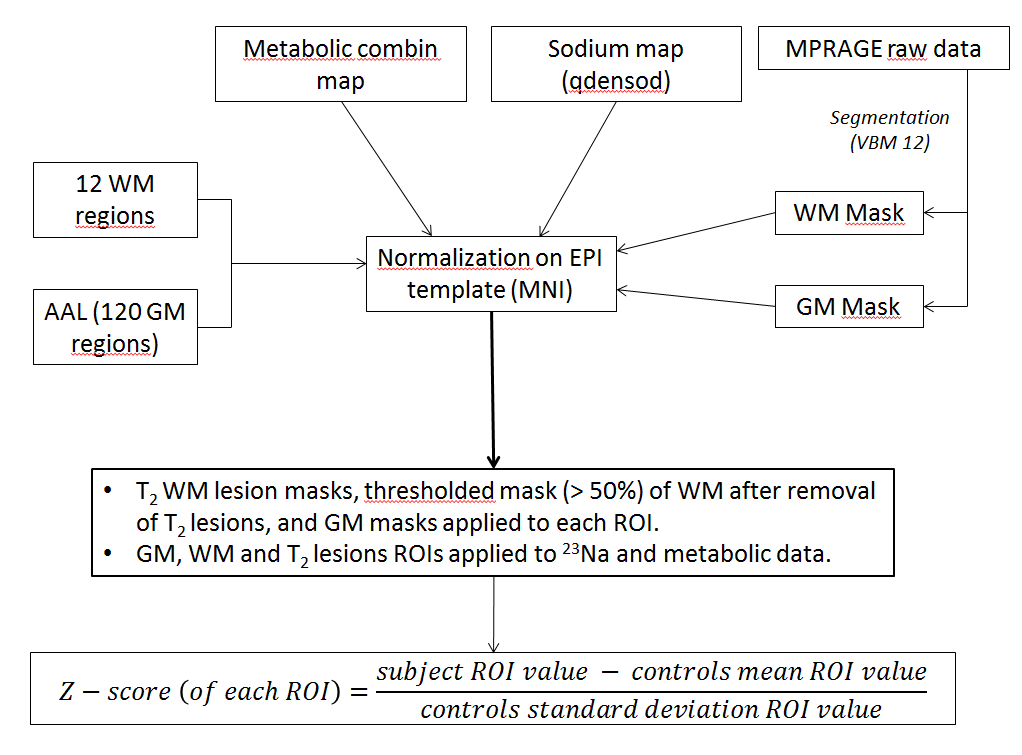
Post-Processing: Metabolic maps and 23Na imaging were obtained using the procedures described in (3) and (5). Then, all quantitative maps were normalized (Figure 1) in the same MNI spatial space, and 23Na, N-Acetyl Aspartate (NAA), Glutamate + Glutamine (Glx), Creatine (Cr), Choline (Cho) and myo-Inositol (Ino) levels were extracted from the 110 GM regions of the AAL atlas and 10 WM regions corresponding to the different lobes (frontal, parietal, limbic, temporal and occipital) masked by each individual GM and WM probabilistic maps thresholded at 50%. Data from T2 lesions were also obtained. All values were expressed as Z-scores after normalization by the mean and SD values of the controls for each parameter and each region.
Statistics: Comparisons of Z-scores (Wilcoxon test, p<0.05, corrected for multiple comparisons) were performed to determine the differences between patients and controls for all parameters within GM, NAWM and T2 lesion compartments. Stepwise models were constructed to explain TSC by the levels of NAA, Glx, Cr, Cho and Ino within each compartment. Finally, correlations between MSFC or EDSS and parameters were assessed using spearman rank tests.
Results
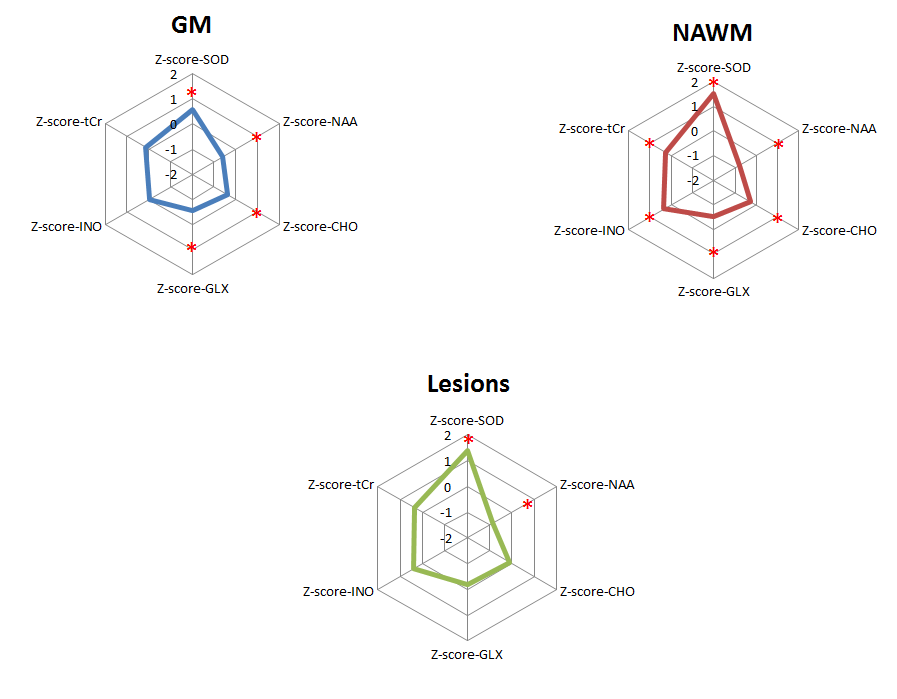
Within GM regions, RRMS patients showed significant abnormal increases in 23Na concentrations, decreases in NAA, Glx and Cho levels. Within NAWM regions, RRMS patients showed increased 23Na concentrations, decreased NAA, Glx and Cho levels and increased Cr and Ino levels. T2 lesions of RRMS patients showed increased 23Na levels and decreased NAA levels (Figure 2). Within GM regions, stepwise regression (Adjusted R2=0.132, p<0.0001) showed that sodium concentrations in RRMS were significantly associated to decreases in NAA (β=-0.233; p<0.0001), decreases in Glx (β=-0.321; p<0.0001) and increases in Cho (β=0.296; p<0.0001). Within NAWM regions, TSC was associated (AdjR2=0.190, p<0.0001) with decreases in NAA (β=-0.475; p<0.0001) and increases in Cho (β=0.492; p<0.0001). Similar profile was obtained within T2 WM lesions with association of TSC (AdjR2= 0.444, p<0.0020) with decreases in NAA (β=-0.761; p<0.0042), and increases in Cho (β=0.892; p<0.0171). Finally, MSFC scores were negatively correlated with GM TSC (rho=-0.439; p=0.0465) and NAWM TSC (rho=-0.583; p=0.0055) and positively correlated with GM NAA (rho=0.595; p=0.0045), NAWM NAA (rho=0.595; p=0.0045), GM Glx (rho=0.607; p=0.0036) and NAWM Glx (rho=0.495; p=0.0226).Discussion/Conclusion
3D-1H-EPSI and 3D-DA 23Na MRI enabled to obtain whole brain metabolic (4, 6) and 23Na (7) topography in RRMS patients at 3 Tesla, showing altered ionic and metabolic profiles within GM, NAWM and T2 lesions. Stepwise analyses highlighted for the first time the metabolic counterparts of 23Na accumulation within the different brain compartments of RRMS patients, exhibiting within GM, associations between 23Na accumulation and decreases in NAA and Glx, markers of neuronal dysfunction and neuro-astrocytic exchange respectively (8, 9) but also with increases of Cho that could be related to membrane disruption (9). Within NAWM and T2 lesions, TSC was strongly associated to NAA decreases, reflecting neuro-axonal dysfunction and increases of Cho related to demyelination and/or reorganization of sodium channels in demyelinated axons. Finally, sodium accumulations, NAA and Glx decreases within both GM and NAWM were shown to act on clinical status of RRMS patients assessed by MSFC. Future work will aim at deciphering the association between intra-cellular 23Na concentrations and metabolic profiles using more specific methods at ultra-high field.Acknowledgements
No acknowledgement found.References
1. Kutzelnigg A: Cortical demyelination and diffuse white matter injury in multiple sclerosis. Brain 2005; 128:2705–2712.
2. Stys PK: General mechanisms of axonal damage and its prevention. J Neurol Sci 2005; 233:3–13.
3. Zaaraoui W, Konstandin S, Audoin B, et al.: Distribution of Brain Sodium Accumulation Correlates with Disability in Multiple Sclerosis: A Cross-sectional 23Na MR Imaging Study. Radiology 2012; 264:859–867.
4. Lecocq A, Le Fur Y, Maudsley AA, et al.: Whole-brain quantitative mapping of metabolites using short echo three-dimensional proton MRSI. J Magn Reson Imaging JMRI 2015; 42:280–289.
5. Donadieu M, Le Fur Y, Lecocq A, et al.: Metabolic voxel-based analysis of the complete human brain using fast 3D-MRSI: Proof of concept in multiple sclerosis. J Magn Reson Imaging JMRI 2016.
6. Ebel A, Soher BJ, Maudsley AA: Assessment of 3D proton MR echo-planar spectroscopic imaging using automated spectral analysis. Magn Reson Med 2001; 46:1072–1078.
7. Hilal SK, Maudsley AA, Ra JB, et al.: In vivo NMR imaging of sodium-23 in the human head. J Comput Assist Tomogr 1985; 9:1–7.
8. Witte ME, Mahad DJ, Lassmann H, van Horssen J: Mitochondrial dysfunction contributes to neurodegeneration in multiple sclerosis. Trends Mol Med 2014; 20:179–187.
9. Rae CD: A Guide to the Metabolic Pathways and Function of Metabolites Observed in Human Brain 1H Magnetic Resonance Spectra. Neurochem Res 2014; 39:1–36.
Figures