0211
Motion correction for 3D free-breathing renal DCE-MRI using tracer kinetic model-driven registration1Division of Biomedical Imaging, University of Leeds, Leeds, United Kingdom, 2Department of Applied Mathematics, University of Leeds, Leeds, United Kingdom, 3University of Manchester, Salford, United Kingdom
Synopsis
Tracer-kinetic model driven motion-correction is a highly effective strategy for 2D free-breathing DCE-MRI. In this study we address the challenge of translation to 3D by improving computational efficiency and evaluating performance in the presence of ghosting artefacts. Results in 8 patient cases show that the optimised algorithm is feasible in realistic computation times and effectively removes between-frame breathing motion despite significant within-frame artefacts. Quantitative evaluation against reference measurements shows a reduction of the bias, but precision is limited by within-frame artefacts and will require an integrated motion-correction and image reconstruction strategy.
PURPOSE
Breathing motion is a main source of error in DCE-MRI measurements of single-kidney glomerular filtration rate (SK-GFR). Recently a novel Tracer Kinetic model-driven Motion Correction (TKMC) was proposed, and evaluated on 2D free-breathing data1. Translation to 3D is however challenging due to exponential increase in computational complexity, and ghosting artefacts caused by within-frame breathing motion.
The purpose of this study is to: (1) improve the efficiency of TKMC by precomputing steps to remove redundant calculations; (2) evaluate registration quality and clinical utility in 3D free-breathing patient data.
METHODS
Subjects
8 subjects were selected from a database of patients with significant renal artery stenosis who had paired MRI and radio-isotope reference measurements2. Selection was designed to provide a good representation of the population in terms of SK-GFR errors.
DCE-MRI
MRI was performed at 3T (Philips Achieva) using a 3D spoiled gradient echo sequence in free breathing (TR/TE 5.0/0.9ms, FOV 400x400x10 mm, FA 17deg, SENSE factor 2, acquisition matrix 128x84x10 reconstruction 128x128x20, temporal resolution 2.1s, oblique-coronal slab). A quarter dose of 0.025 mmol/kg Gd-DOTA (Dotarem, Guerbet) was injected at 3 ml/s.
Post-processing (without motion correction)
Post-processing was performed on a standard desktop PC (3.4GHz, 32GB) with open-source software PMI 0.4 as described previously2. Briefly: an AIF was extracted semi-automatically in the aorta; maps of blood flow and distribution volumes were generated by model-free deconvolution; whole kidney ROI's were defined semi-automatically on the latter; concentrations were calculated assuming a linear relationship with signals, and a two-compartment filtration model (2CFM) was fitted non-linearly.
Post-processing (with motion correction)
The core architecture of the TKMC algorithm has been described previously1. Briefly: the 2CFM is linearly fitted pixel-by-pixel3 and the model fit is used as a target for image registration (since the aorta is static, the AIF is taken from the uncorrected data); then a free-form deformation (FFD) model is used for pairwise co-registration of source- and target images at the same time point. These two steps are iterated until convergence, and the whole process is iterated with increasing FFD resolution (multiresolution). After motion-correction, post-processing is the same as for uncorrected data.
For translation into 3D, the existing algorithm was carefully analysed for duplicate calculation steps, and those were extracted from the loops and inserted as precomputation steps to reduce calculation times.
Evaluation
The effect of precomputation on calculation times was recorded. TKMC was evaluated by comparing results with- and without motion correction using subjective visual evaluation and objective comparison of SK-GFR against isotope references.
RESULTS
For 2D registration, the precomputation steps reduced calculation times for one slice from 5hrs to 20min. In 3D the original algorithm didn't converge within 5 days - precomputation steps reduced calculation times to 12-13hrs.
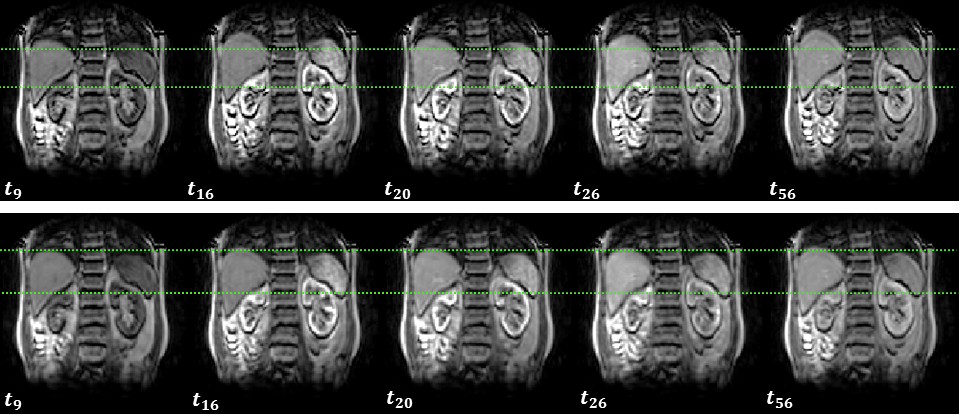
Fig. 1 shows the effect of TKMC on the measured images in a representative case. Despite significant within-frame artefacts, the between-frame motion is effectively removed without affecting the signal intensities or image contrast.
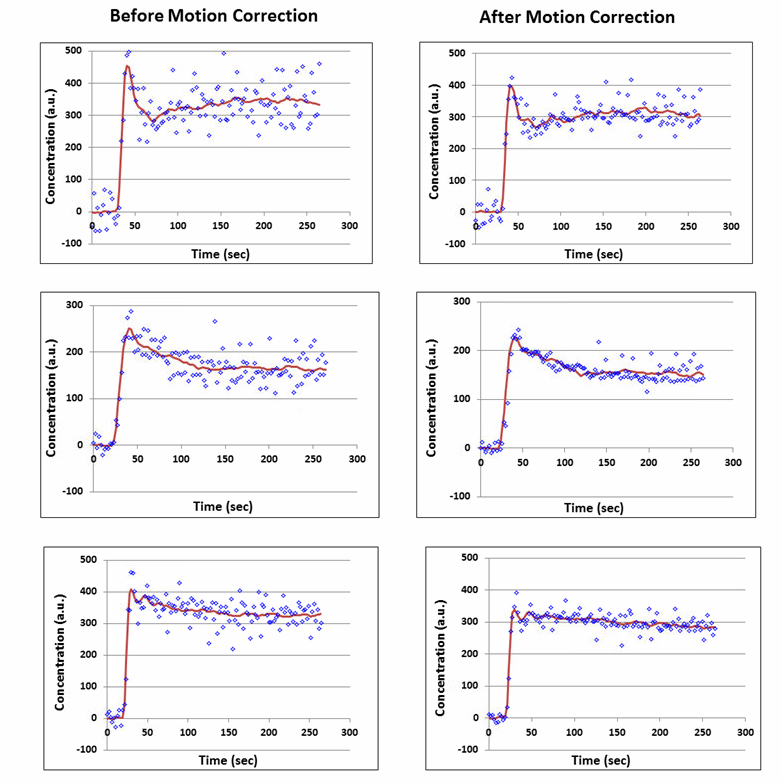
Fig. 2 shows the effect of TKMC on temporal profiles from three representative kidney ROIs. Respiratory signal oscillations on original time-intensity curves are notably reduced after motion correction, resulting in an improved fit to the data.
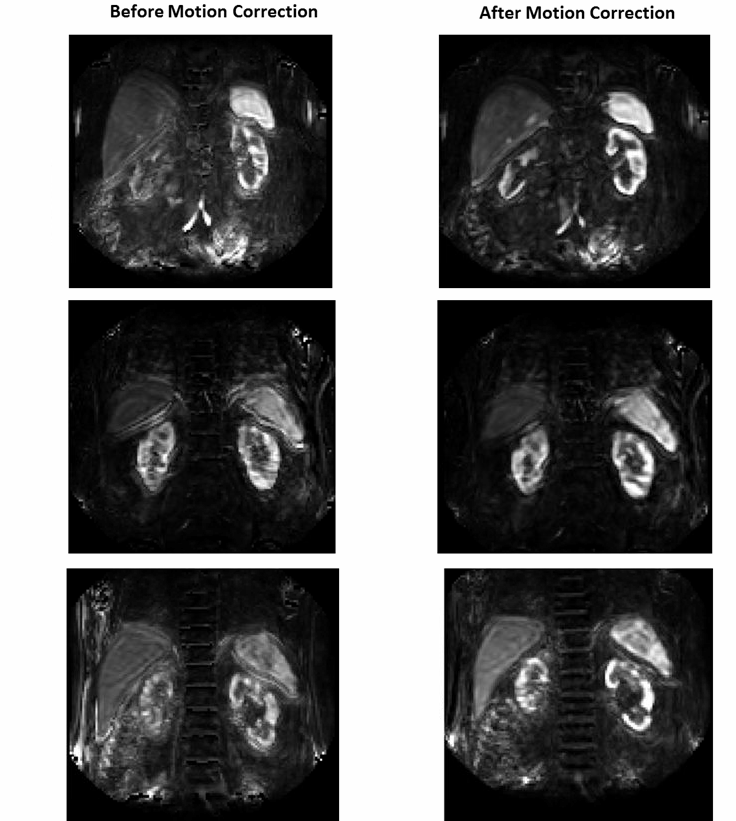
Fig. 3 shows the effect of TKMC on blood flow maps in the cases of Fig 2. The uncorrected maps shows strong blurring and artefacts, which are mostly removed after correction leading to much clearer organ boundaries and internal structures (cortex/medulla).
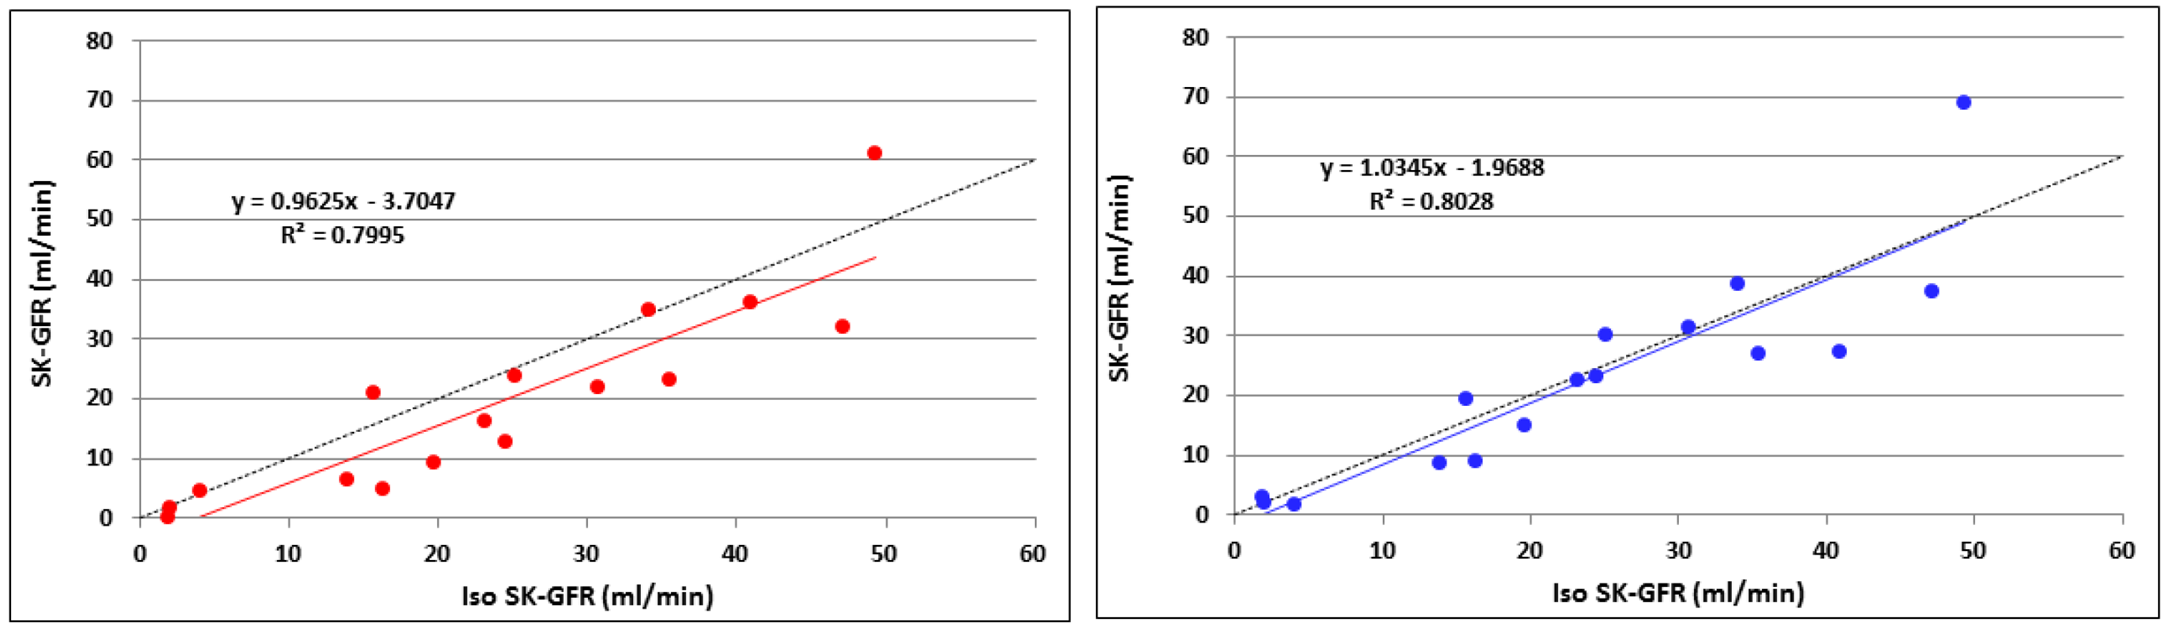
Fig. 4 shows that TKMC reduces most of the bias in the SK-GFR values, but with only minor and insignificant improvement in precision.
DISCUSSION
Precomputation reduced calculation times to 12hrs on a desktop PC. As the calculation is easily parallellizable, this implies that convergence within minutes is feasible on multi-core workstations.
TKMC is surprisingly insensitive to significant structured noise caused by within-frame breathing artefacts. The data suffered from significant ghosting as the acquisition time is similar in duration to the breathing cycle, yet between-frame motion is virtually removed.
Quantitatively, TKMC removes the residual bias in SK-GFR. This is consistent with the fact that breathing motion causes a net displacement of the time curves because expiration has a longer duration than inspiration.
On the other hand the limiting factor to clinical utility is currently lack of precision in SK-GFR rather than accuracy. Correction of between-frame motion does not resolve this problem, suggesting that within-frame artefacts are the main driver for poor precision.
CONCLUSION
TKMC with well-chosen precomputation steps is a computationally efficient approach for 3D DCE-MRI, which effectively removes between-frame breathing motion. Clinical translation will require removal of within-frame artefacts, which can only be achieved by integrating motion correction in the reconstruction process.
Acknowledgements
This study was supported by a CASE PhD studentship of the Engineering and Physical Sciences Research Council (EPSRC) and GlaxoSmithKline (GSK). Data collection was supported by Kidney Research UK grant RP55/2012.References
1. D Flouri, D Lesnic, S Sourbron (2016) Motion correction in DCE-MRI by tracer-kinetic model-driven registration: beyond the Tofts model. ISMRM 2016 (Singapore).
2. SW Lim, C Chrysochou, DL Buckley, PA Kalra, SP Sourbron (2013) Prediction and assessment of responses to renal artery revascularization with dynamic contrast-enhanced magnetic resonance imaging: a pilot study. Am J Physiol Renal Physiol; 305 (5): F672-F678.
3. D Flouri, D Lesnic, SP. Sourbron (2016) Fitting the two-compartment model in DCE-MRI by linear inversion. Magn Reson Med 76(3); 998-1006.
Figures