0210
Automated renal motion correction using fat-images derived from Dixon reconstruction of DCE MRI1University Medical Center Utrecht, Utrecht, Netherlands
Synopsis
In renal dynamic contrast enhanced (DCE) MRI respiratory motion of the kidneys necessitates registration of the dynamics. Since image contrast varies during contrast agent passage, automatic registration is challenging. We show that on Dixon-derived fat-images this contrast change is virtually absent. Therefore, we propose to perform automated image registration using fat-images and apply the resulting transformation to the water-images. We applied this method to DCE data of 10 patients and show its superiority over a conventional registration approach. Pharmacokinetic fits to a two-compartment model yielded realistic values for renal perfusion and filtration.
Background
Renal dynamic contrast enhanced (DCE) MRI is increasingly used to obtain information on renal perfusion and filtration. Since the kidneys move with respiration, image registration is required to derive quantitative measures. However, automatic image registration is challenging since background-kidney contrast swaps during contrast agent (CA) passage. Because gadolinium based CAs are confined to the intravascular and extracellular compartments this contrast change is virtually absent on Dixon-derived fat-images. Therefore we propose to perform automated image registration using fat-images derived from a Dixon acquisition, since these provide consistent high contrast between kidney tissue and surrounding fat over the dynamic series.Methods
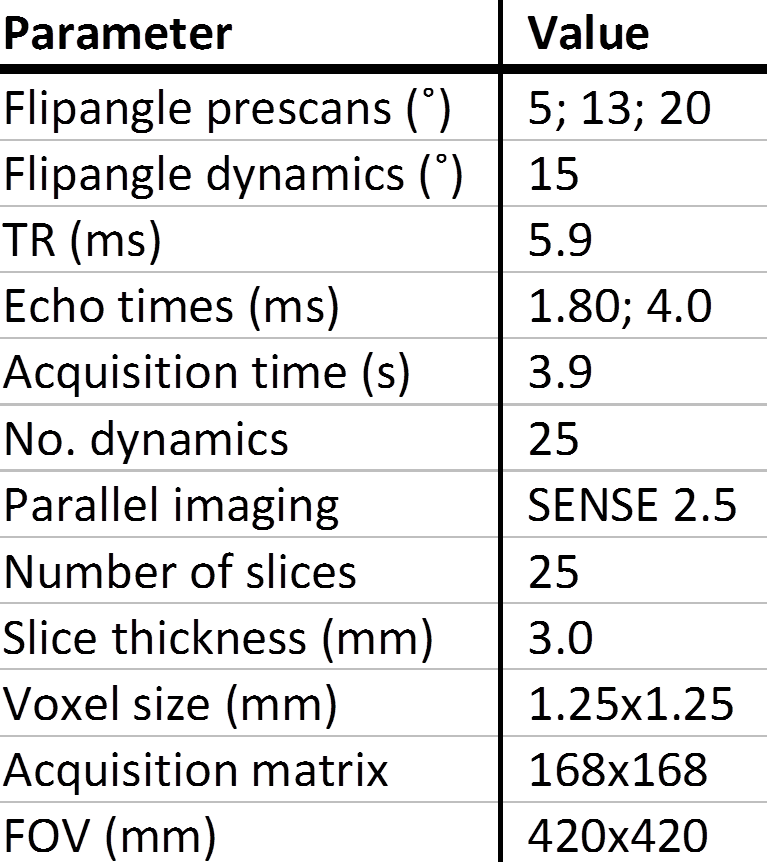
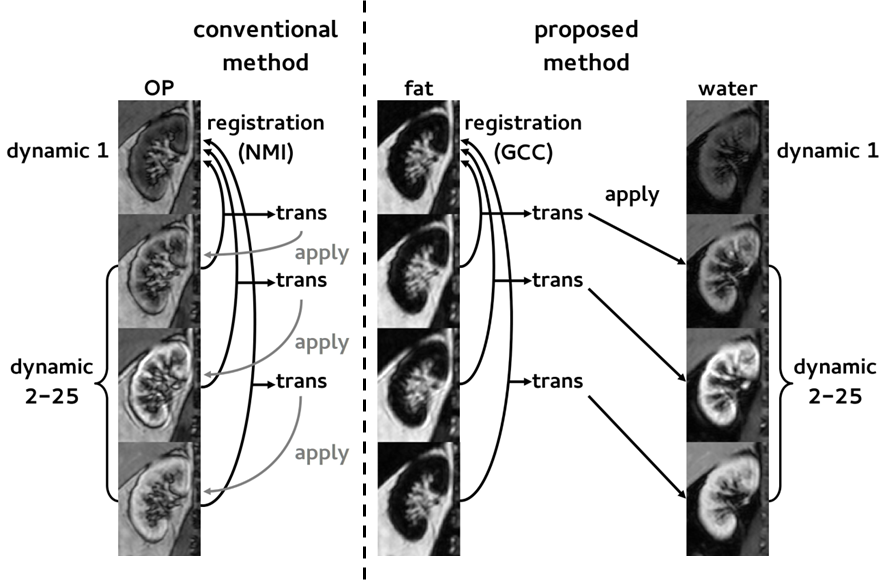
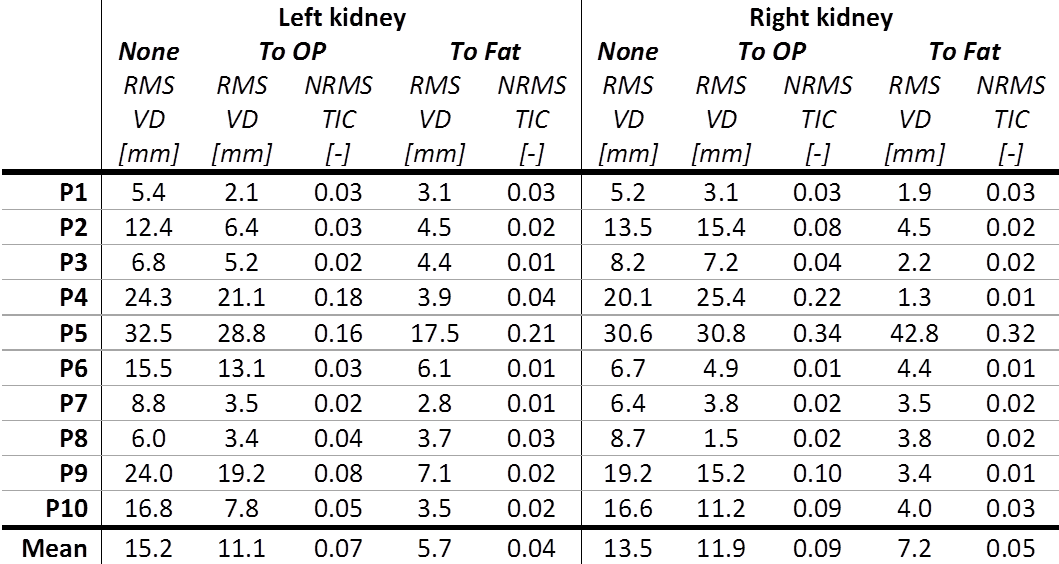
DCE MRI data of 10 hypertensive patients undergoing renal MRI were used. DCE imaging consisted of a 3D spoiled dual-echo gradient-echo protocol acquired on a 1.5T MR system (Ingenia, software release 4.1, Philips, Best, the Netherlands) followed by a Dixon reconstruction resulting in water, fat and opposed-phase images.1 Imaging parameters are depicted in table 1. This protocol was used to monitor CA passage and for three pre-contrast images to map native T1. During the dynamic series, 0.15mmol/kg of gadobutrol was infused, followed by a saline flush of 25mL. Subjects were instructed to hold their breath as long as possible, followed by free breathing. Prior to registration, whole kidney volumes of interest (VOIs) were manually delineated on the first Dixon-water dynamic only. The renal collecting system was avoided, as were partial volume artefacts. A ROI was segmented in the caudal part of the aorta for determination of the arterial input function. Apart from initial segmentation, post processing was fully automated. Rigid registration of prescans and dynamics was performed to the fat first dynamic using the VTK Registration Toolkit (Kitware Inc, New York, NY, USA). In our proposed method (figure 1), registration was performed using the dynamic series of fat-images. The obtained transformation matrices were applied to the corresponding water-images. To compare our method with a conventional approach, we also performed registration on OP-images. Of the available images, OP-images have the lowest echo time and are most similar to first echo images acquired in a standard post contrast dynamic series. To quantify respiratory motion before and after registration, root mean square (RMS) vertical displacement of the top of the kidney was determined with respect to the first dynamic for all dynamics. Since this only measures registration performance in one direction, a second measure was used. The whole parenchyma time-intensity curve (TIC) was calculated using fat-images (fat-TIC). Assuming perfect registration and no impact of the CA, the fat-TIC will be constant. Since the kidney is surrounded by adipose tissue, registration errors result in adipose tissue shifting inside the renal VOI, and consequently in fluctuations of the fat-TIC. As a second measure, normalized RMS error was calculated for these fat-TICs. To compare registration of the proposed method with registration to OP-images, the sign test was used since the data was not normally distributed. To obtain quantitative information on renal perfusion, TICs obtained from water-images were fitted to Tofts’ renal specific two-compartment model.3Results
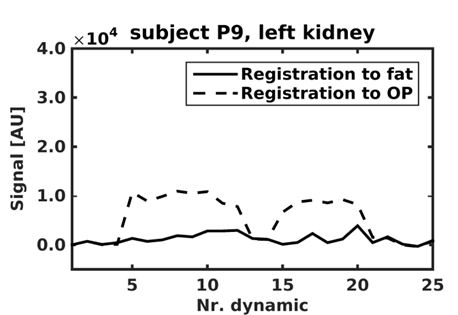
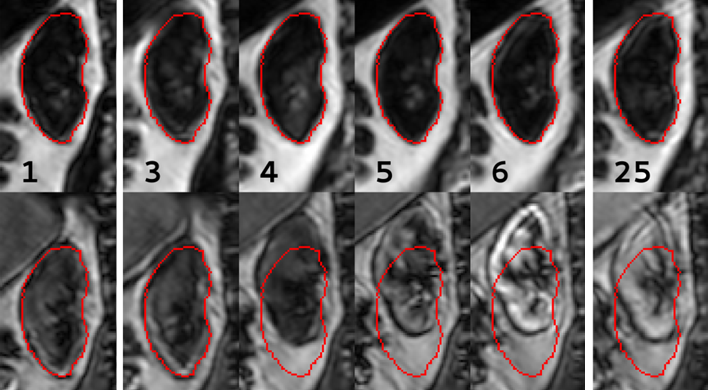
Overall image quality was acceptable, although later phase images were affected by motion artefacts. Figure 2 shows a representative example of a virtually constant fat-TIC calculated for the fat-registered images, confirming that contrast enhancement in the Dixon-fat-images is virtually absent despite CA administration. The fluctuations in the fat-TIC derived from OP-registered images arise from registration errors. In figure 3 registered images are shown, again showing absence of contrast enhancement in fat-images. Quantitative registration results are provided in table 2. Mean RMS vertical displacement was significantly improved by registration to fat compared to OP (6.5 versus 11.5mm, P=0.01). In one subject registration was poor for both methods, due to severe respiratory motion. Mean perfusion and glomerular filtration rate (GFR) were 266±70mL/100mL/min and 68.6±30.6ml/min, respectively.Discussion and conclusion
We describe a new approach to image registration in renal DCE imaging, resulting in better and more robust automated registration than conventional methods. We demonstrated that fat-images are minimally affected by CA passage. This facilitates the proposed fully automated registration algorithm relying on the constant image contrast in fat-images during bolus passage. A drawback of our method is the increase in scanning time inherent to the acquisition of dual-echo images. We achieved a temporal resolution of <4s, using a parallel imaging factor of 2.5 which is considered acceptable.2 Temporal resolution can easily be increased by migrating to 3T. Pharmacokinetic fits yielded realistic values for perfusion and GFR, in agreement with other studies.3,4 Presumably, the clear renal contour on fat-images also facilitates automated kidney delineation, enabling fully automated renal DCE post-processing.Acknowledgements
No acknowledgement found.References
1. Eggers H, Brendel B, Duijndam A et al. Dual-echo Dixon imaging with flexible choice of echo times. Magn Reson Med. 2011;65(1):96-107.
2. Michaely HJ, Sourbron SP, Buettner C et al. Temporal constraints in renal perfusion imaging with a 2-compartment model. Invest Radiol. 2008; 43(2):120-128.
3. Tofts PS, Cutajar M, Mendichovszky IA et al. Precise measurement of renal filtration and vascular parameters using a two-compartment model for dynamic contrast-enhanced MRI of the kidney gives realistic normal values. Eur radiol. 2012;22(6):1320-1330.
4. Sourbron SP, Michaely HJ, Reiser MF et al. MRI-measurement of perfusion and glomerular filtration in the human kidney with a separable compartment model. Invest Radiol. 2008;43(1):40-48.
Figures