0209
A Robust Reconstruction Method for Quantitative Perfusion MRI: Application to Brain Dynamic Susceptibility Contrast (DSC) Imaging1Department of Computer Science, Technische Universität München, Munich, Germany, 2GE Global Research, Munich, Germany, 3Department of Neuroradiology, Technische Universität München, Munich, Germany, 4Zentralinstitut für Medizintechnik, Technische Universität München, Munich, Germany
Synopsis
We propose a robust reconstruction model for dynamic perfusion magnetic resonance imaging (MRI) from undersampled k-space data. Our method is based on a joint penalization of the pixel-wise incoherence on temporal differences and patch-wise dissimilarities between spatio-temporal neighborhoods of perfusion image series. We evaluate our method on dynamic susceptibility contrast (DSC)–MRI brain perfusion datasets and demonstrate that the proposed reconstruction model can achieve up to 8-fold acceleration by yielding improved spatial reconstructions and providing highly accurate matching of perfusion time-intensity curves, thus leading to more precise quantification of clinically relevant perfusion parameters over two existing reconstruction methods.
Purpose
Perfusion-weighted MR imaging (PWI) is a widely used imaging technique that allows to measure the hemodynamic parameters of perfusion through the examination of spatio-temporal changes of signal intensities following the injection of bolus via exogenous contrast agents. Although PWI techniques have become widespread clinical tools for the assessment of tumor malignancy, quantitative PWI requires high temporal resolution to capture the rapid kinetics of contrast agent uptake, high spatial resolution to accurately delineate spatial boundaries, and high signal-to-noise ratio to enable precise fitting of quantitative model parameters1. With such severe limitations, quantitative PWI can greatly benefit from dynamic imaging reconstruction techniques2,3,4. This work presents a new reconstruction model that is specifically developed for PWI and is capable of producing high-quality spatial images and reconstructing the complete temporal signal dynamics, hence enabling accurate estimation of perfusion parameters from accelerated acquisitions.Methods
Our reconstruction model integrates two different data-driven constraints for the reconstruction of PWI: (i) the pixel-wise sparsity constraint on the temporal differences of the image series, limiting the overall dynamic of the perfusion time series, (ii) the patch-wise similarity constraint on the spatio-temporal neighborhoods of the whole data, providing smooth image regions with less temporal blurring when there are high inter-frame intensity changes. The proposed model can be formulated as, $$\hat{X}=\underset{X}{\arg\min}\left\lbrace\frac{1}{2}\|\mathcal{F}_uX-Y\|_2^2+\lambda_1\mathcal{G}_1(X)+\lambda_2\mathcal{G}_2(X)\right\rbrace$$ where $$$X$$$ denotes the perfusion image series to be reconstructed, $$$Y$$$ represents undersampled k-space data, $$$\lambda_1$$$ and $$$\lambda_2$$$ are the regularization parameters. The first regularizer here penalizes the sum of pixel-wise differences on the temporal difference images based on a reference, and defined as, $$\mathcal{G}_1(X)=\sum\limits_{t\in\mathbb{T}}\sum\limits_{n=1}^{M\times N}\sqrt{\left(\nabla_x\left(x_t-\bar{x}\right)_n\right)^2+\left(\nabla_y\left(x_t-\bar{x}\right)_n\right)^2}$$where $$$\bar{x}$$$ is a reference image calculated by averaging all temporal frames, $$$\nabla_x$$$ and $$$\nabla_y$$$ are the finite-difference operators along $$$x$$$ and $$$y$$$ dimensions, respectively. This regularizer is better adjusted to the variation in time. The second regularizer penalizes the weighted sum of $$$\ell_2$$$ norm distances between spatio-temporal (3D) patches of the image series, and this term is specified by,$$\mathcal{G}_2(X)=\sum_{(\mathrm{p}_x,\mathrm{p}_y,\mathrm{p}_t)\in\mathrm{\Omega}}\sum_{(\mathrm{q}_x,\mathrm{q}_y,\mathrm{q}_t)\in\mathcal{N}_{\mathrm{p}}}w(\mathrm{p},\mathrm{q})\|P_{\mathrm{p}}(\mathrm{X}^{3D})-P_{\mathrm{q}}(\mathrm{X}^{3D})\|_2^2$$ where $$$P_{\mathrm{p}}(\mathrm{X}^{3D})$$$ is a 3D patch centered at voxel $$$\mathrm{p}$$$, $$$\mathcal{N}_{\mathrm{p}}$$$ is a 3D search window around $$$\mathrm{p}$$$. The weights $$$w(\mathrm{p},\mathrm{q})$$$ are determined using exponentially weighted $$$\ell_2$$$ norm distance. This regularizer can exploit similarities between patch pairs and enforce smooth solutions by averaging distance-wise close patches.
To efficiently solve the optimization, we adopt an accelerated iterative algorithm based on a generalized forward-backward splitting framework5. We evaluate our method using five DSC image series acquired within a PET/MR study on brain tumor hypoxia. Data were acquired using a 3T Siemens mMR Biograph scanner with a 2D dynamic single-shot gradient-echo EPI sequence (TR/TE=1500/30 ms, flip angle=70$$$^{\circ}$$$, voxel size=$$$1.8\times1.8\times4$$$ mm$$$^3$$$, 60 dynamics). A bolus of 15 ml Gd-DTPA (Magnevist, 0.5 mmol/ml) was injected 3 minutes after an initial bolus of 7.5 ml with 4 ml/s injection rate. We compare our method with two reconstruction methods: SparseSENSE with multiple constraints6 and k-t RPCA7. For fair comparison, we empirically fine-tuned the optimal regularization parameters for each method. Undersampling was retrospectively done via variable density Poisson-disc sampling8. Concordance correlation coefficients (CCCs) are used to quantitatively compare the perfusion maps.
Results
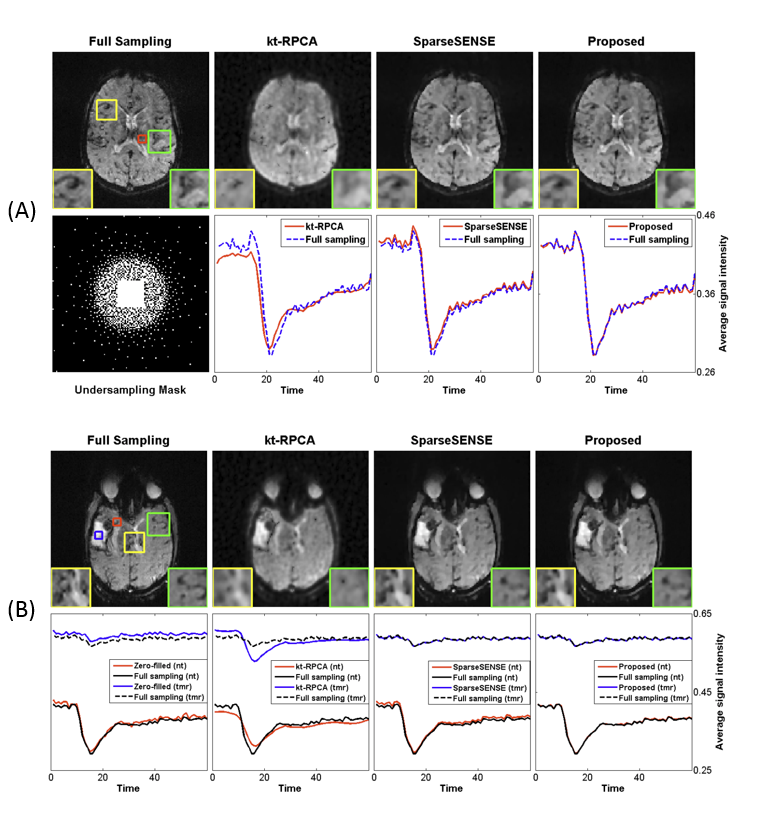
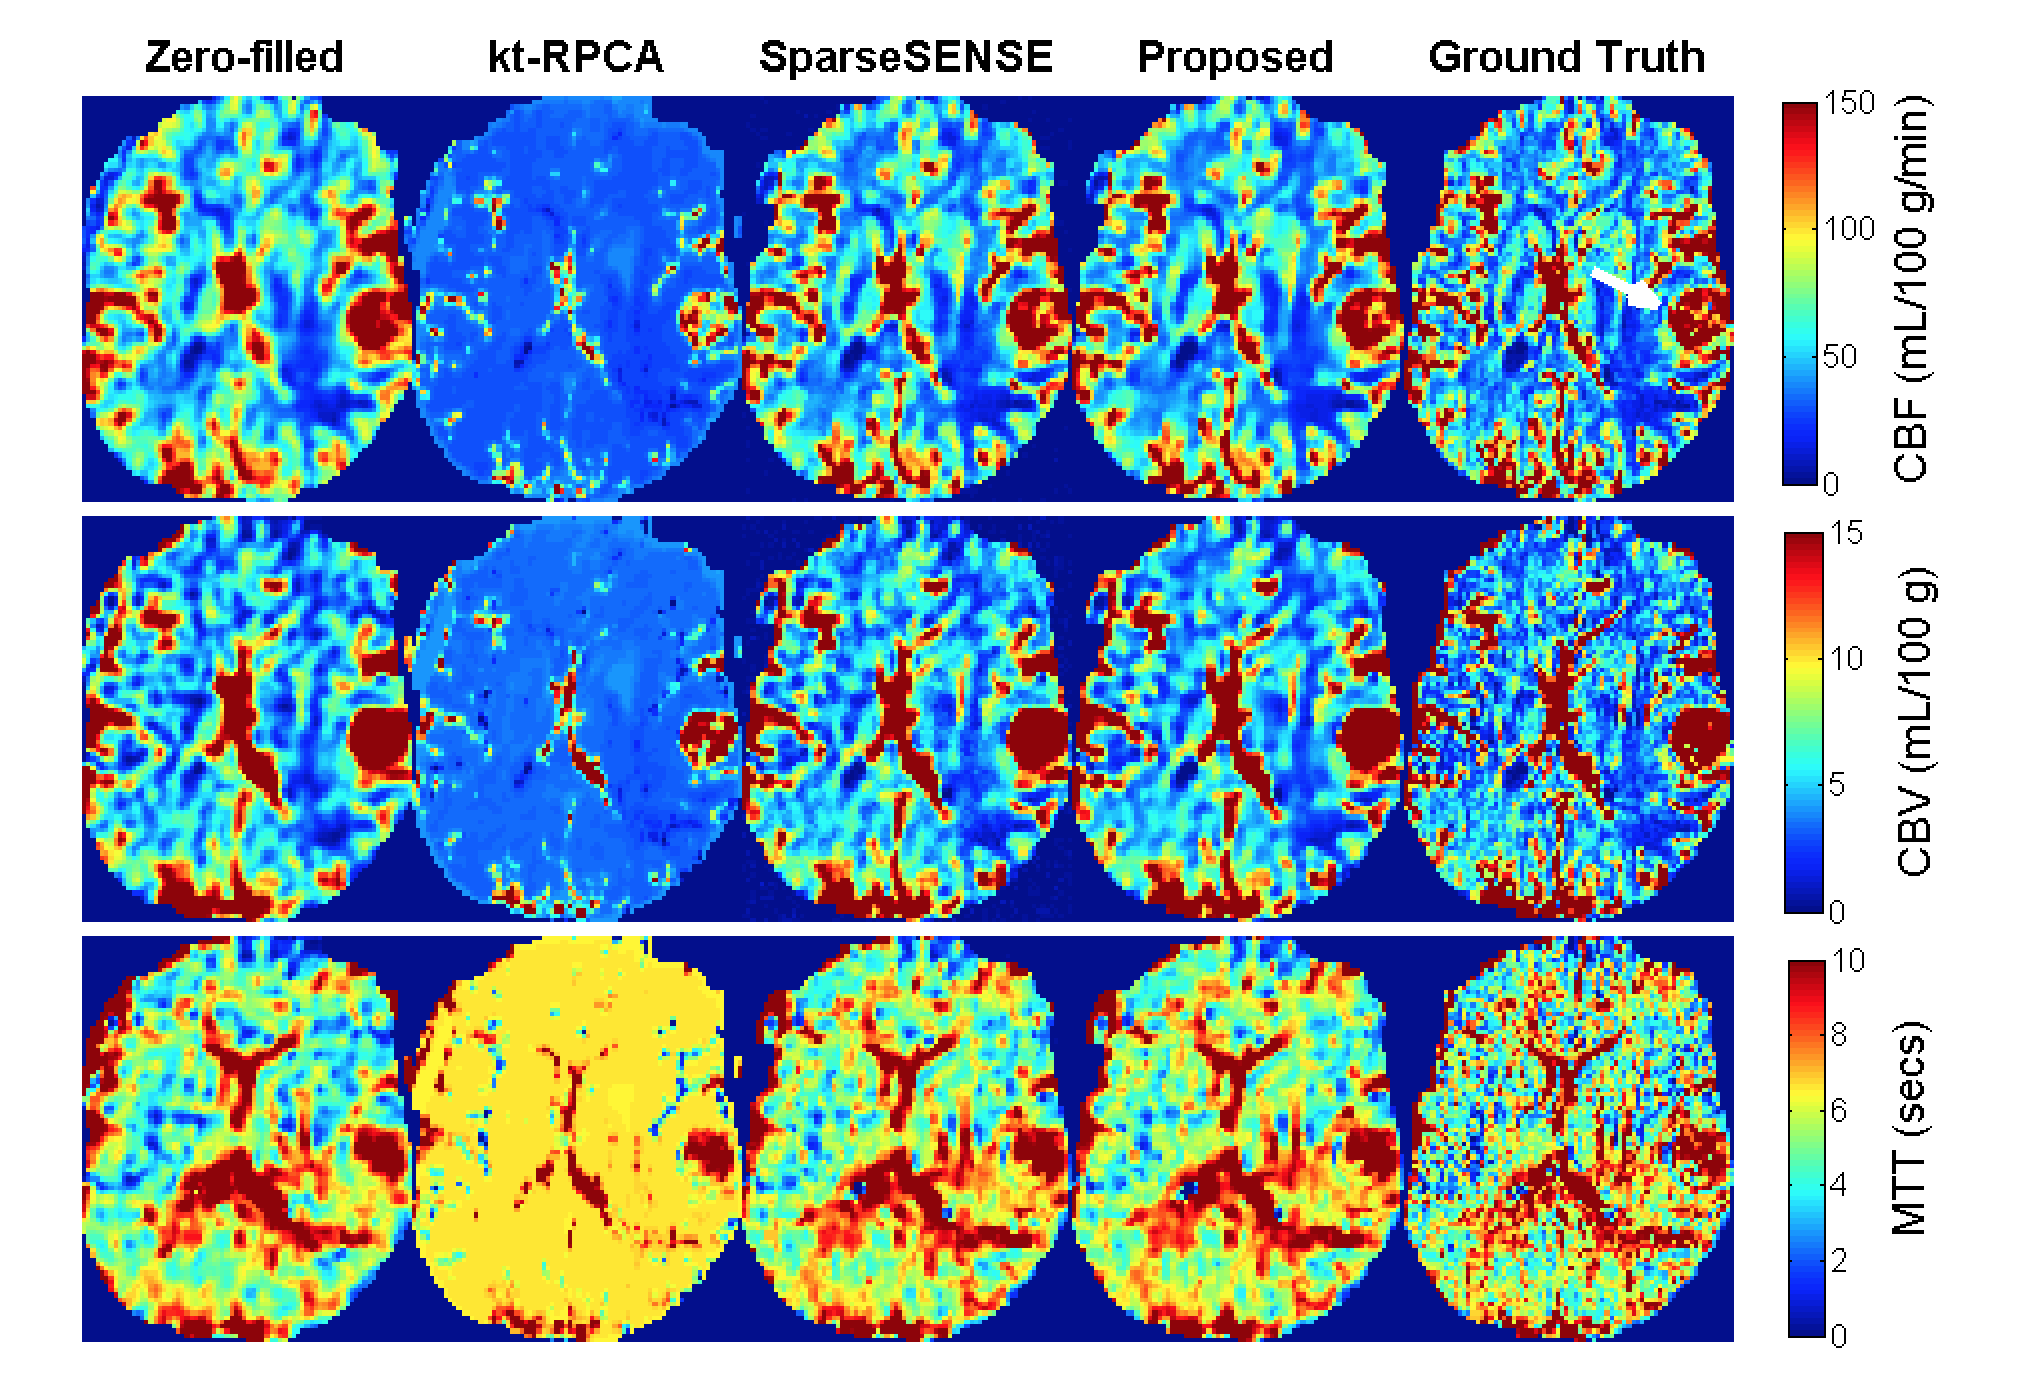
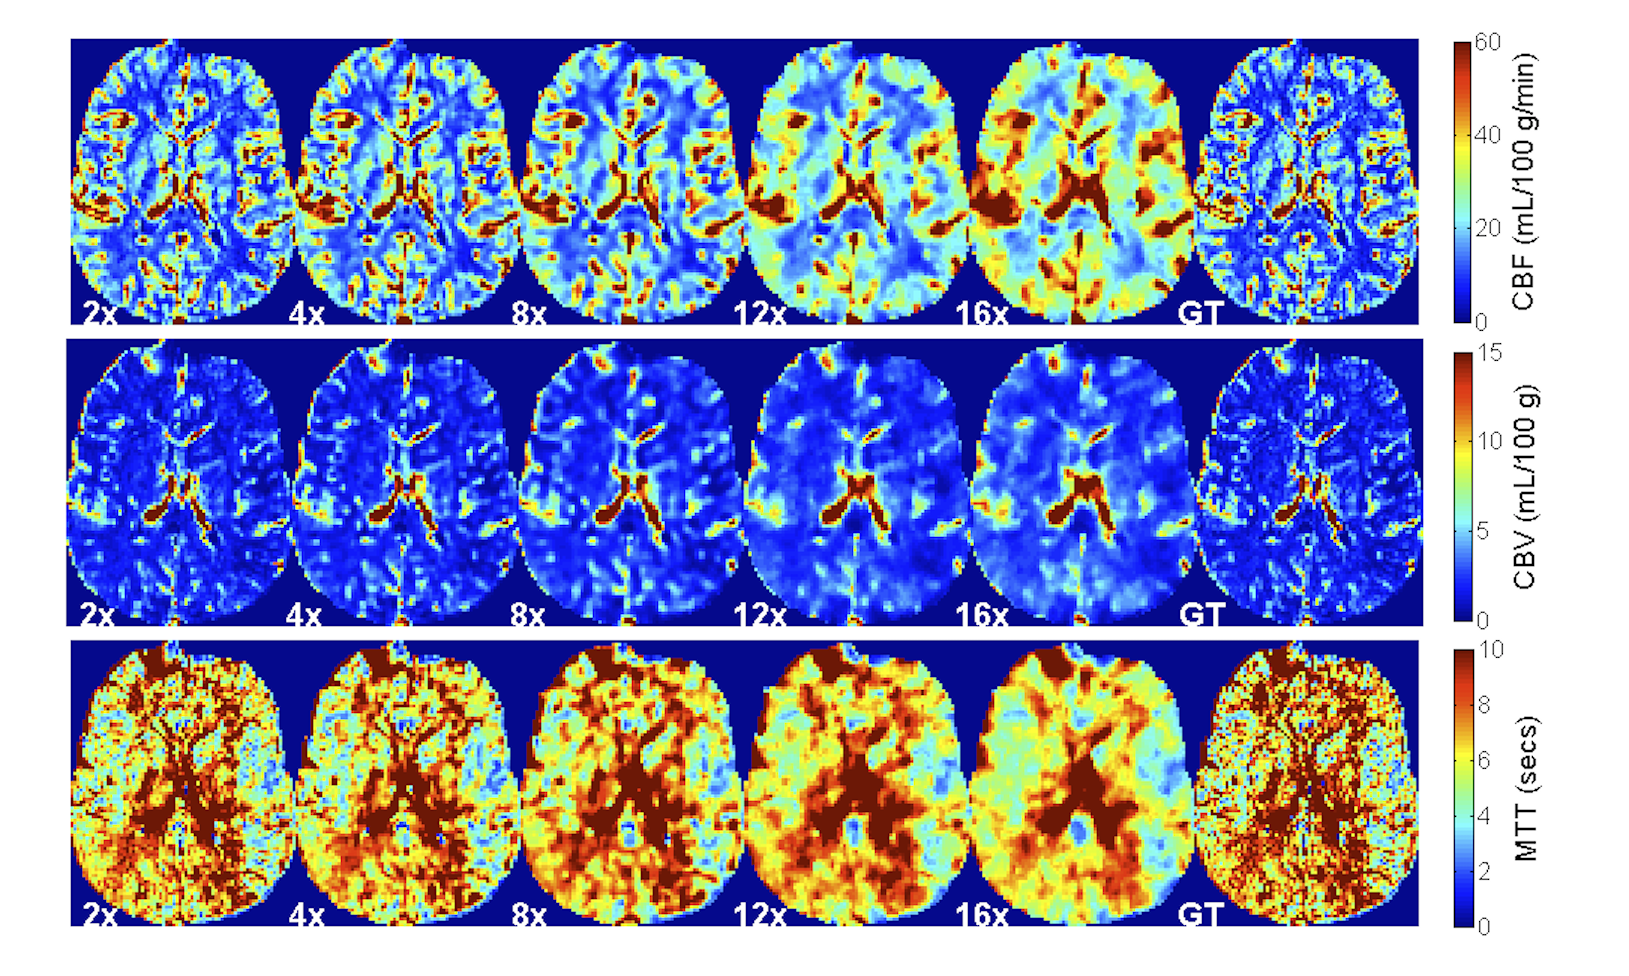
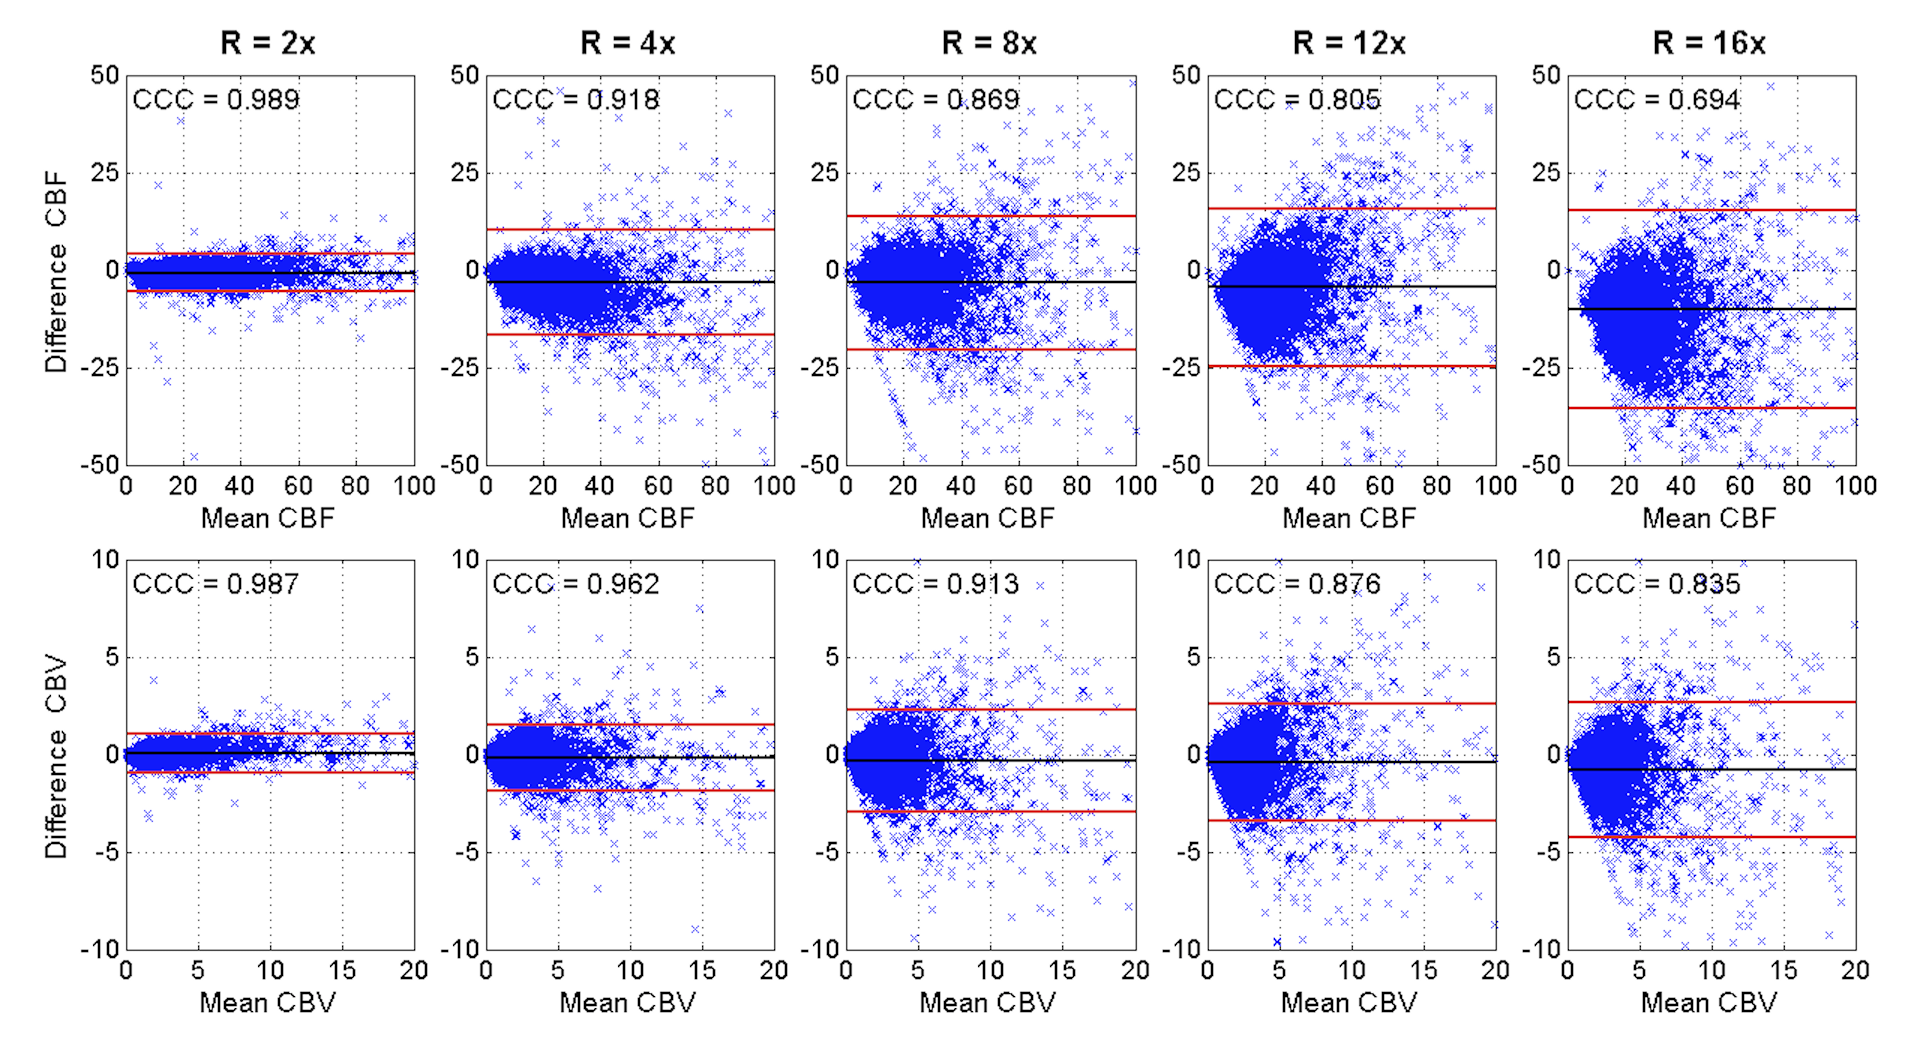
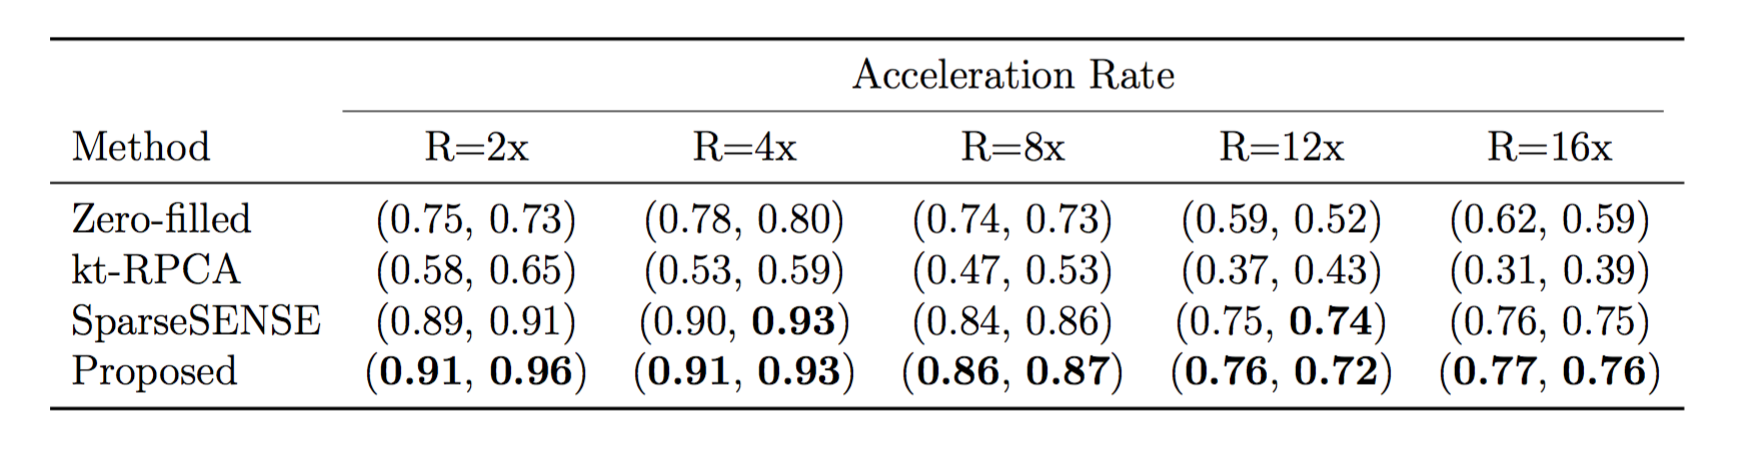
Figure 1 displays the results of both spatial reconstructions and estimated perfusion time-intensity curves of all methods obtained from two different subjects with an 8-fold acceleration. The proposed method yields the most accurate matching of peaks and temporal pattern of perfusion signal and produces acceptable spatial reconstructions together with SparseSENSE. Figure 2 demonstrates resulting perfusion maps of different reconstruction methods with 8-fold acceleration. Our method produces maps that are closer to the GT maps obtained by fully sampled data and provide sharper edges compared to SparseSENSE. The inefficiency of kt-RPCA for quantitative PWI is also demonstrated in Figure 2. Figure 3 shows how the quality of perfusion maps of a subject decreases depending on increasing acceleration rates, and this evidence is quantitatively assessed and illustrated for another subject in Figure 4. Table 1 reports the average CCCs of CBF and CBV parameters obtained from all methods with increasing acceleration rates. Our method yields the best CCCs up to 8-fold acceleration and shows similar performance like SparseSENSE at further accelerations.Discussion
This study presents an efficient reconstruction method for quantitative PWI, which jointly exploits the temporal variations in pixel-wise and patch-wise level. The processing time of our method on a single-slice DSC-MRI dataset is around 4-5 minutes (on a Intel desktop). The maximum acceleration achieved with our method could be further increased with the use of a high-spatial resolution data. However, high-spatial resolution is not clinically realistic for PWI because a high temporal resolution is necessary to accurately track the kinetics of the tracer.Acknowledgements
The research leading to these results has received funding from the European Union’s H2020 Framework Programme (H2020-MSCA-ITN-2014) under grant agreement no 642685 MacSeNet.References
1. Smith, D.S. et al. Robustness of quantitative compressive sensing MRI: the effect of random undersampling patterns on derived parameters for DCE- and DSC-MRI. IEEE Trans. Med. Imag. (2012).
2. Lingala, S.G. et al. Accelerated dynamic MRI exploiting sparsity and low-rank structure: k-t SLR. IEEE Trans. Med. Imag. (2011).
3. Chen, C. et al. Real time dynamic MRI by exploiting spatial and temporal sparsity. Magn. Reson. Imag. (2016).
4. Ulas, C. et al. Spatio-temporal MRI reconstruction by enforcing local and global regularity via dynamic total variation and nuclear norm minimization. IEEE International Sym. on Biomed. Imag. (ISBI) (2016).
5. Raguet, H. et al. A generalized forward-backward splitting. SIAM J. on Imag. Sci. (2013).
6. Lebel, R.M. et al. Highly accelerated dynamic contrast enhanced imaging. Magn. Reson. Med. (2014).
7. Trémoulhéac, B. et al. Dynamic MR image reconstruction-separation from undersampled (k-t)-space via low-rank plus sparse prior. IEEE Trans. Med. Imag. (2014).
8. Vasanawala, S.S. et al. Practical Parallel Imaging Compressed Sensing MRI: Summary of two years of experience in accelerating body MRI of Pediatric patients. IEEE International Sym. on Biomed. Imag. (ISBI) (2011).
Figures