0208
The effects of intra-voxel contrast agent diffusion on the analysis of DCE-MRI data in realistic tissue domains1Biomedical Engineering, The University of Texas at Austin, Austin, TX, United States, 2Dell Medical School, The University of Texas at Austin, TX, United States, 3Barrow Neurological Institute, AZ, United States
Synopsis
Standard compartmental models for quantitative dynamic contrast enhanced MRI (DCE-MRI) typically assume active delivery of contrast agent that is instantaneously distributed within the extravascular extracellular space within each imaging voxel. The goal of this study is to determine the error accumulated in the estimated pharmacokinetic parameters when these assumptions are not satisfied. Using finite element methods to model contrast agent arrival and diffusion throughout realistic tissue domains (obtained from histological stains of tissue sections from a murine cancer model), it was rigorously determined that parameterization error is highest in regions of low vascularity, and lowest in well-perfused regions.
PURPOSE
Quantitative evaluation of dynamic contrast enhanced MRI (DCE-MRI) allows for the estimation of parameters related to perfusion, vessel permeability, and tissue volume fractions by fitting dynamic signal intensity curves to appropriate pharmacokinetic models (1). These models are based on compartmental analysis which necessarily assumes that the contrast agent concentration rapidly equilibrates within the extravascular space in each voxel. However, there is increasing evidence that this assumption is often violated by the Gadolinium chelates most commonly used for DCE-MRI (2,3). As the diffusivities for Gadolinium chelates range from 1-3 E-4 mm2/s (4), the contrast agent will not be equilibrated throughout an imaging voxel, thereby resulting in inaccurate parameterization. While a previous study has examined this issue using simulated tissue domains (2), we seek to extend those results by comparing the results of a simulated DCE-MRI experiment initialized and constrained with histological volume fractions from entire tumor cross-sections obtained from murine tumor studies (5).METHODS
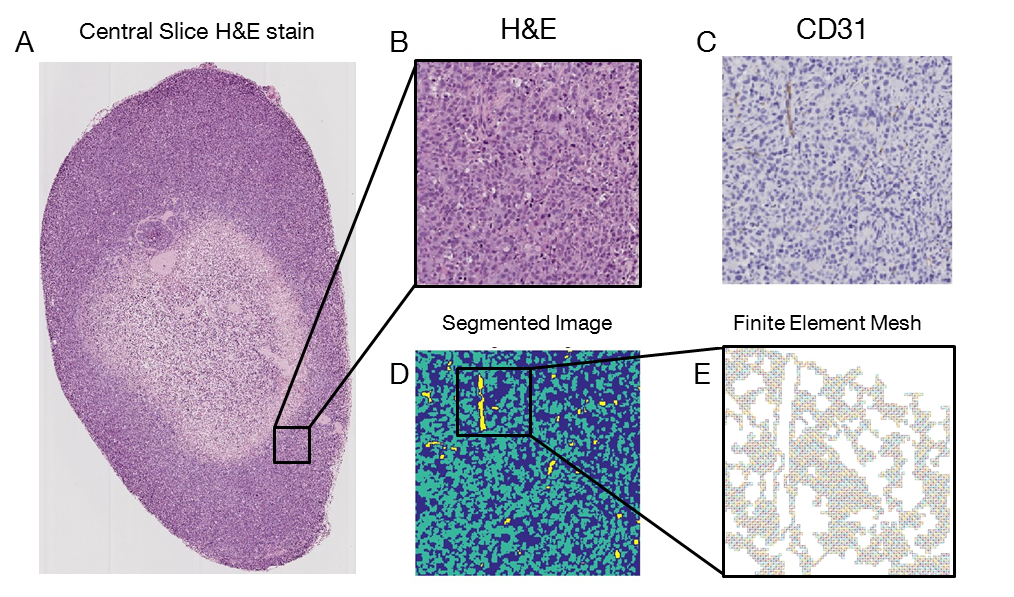
Nude athymic mice were subcutaneously implanted with BT474 cancer cells which were then allowed to grow into ~300 mm3 tumors for six weeks prior to performing DCE-MRI (6). Following imaging, the tumors were extracted, sectioned, and stained for vascularity (CD31) and cellularity (H&E). Stained central slice sections were digitized at high resolution (0.5 mm), and segmented and meshed in MATLAB (Natick, MA) (Figure 1). A finite element model (FEM) with 2 mm resolution (down-sampled from the 0.5 mm resolution) was developed based on the 2D diffusion equation: $$[1], \frac{dC(x,y,t)}{dt}=\nabla\cdot D\nabla C(x,y,t),$$ where $$$C(x,y,t)$$$ is the concentration of contrast agent, and $$$D$$$ is the diffusivity (set to 2 E-4 mm2/s). Impermeable boundaries were assigned at the tumor periphery and at cell membranes. Flux of contrast agent across the boundaries at blood vessels was defined according to Eq. [2]: $$[2], \nabla C\cdot\hat{n}=P(C_p(t)-C(t)),$$ where $$$P$$$ is equal to $$$K^{trans}\times\frac{V}{S}$$$, $$$S$$$ is the total vessel surface area within a voxel, $$$K^{trans}$$$ is the volume transfer coefficient, $$$V$$$ is the volume of tissue perfused, $$$\hat{n}$$$ is the normal vector with respect to the vessel boundary, and $$$C_p(t)$$$ is a population arterial input function (AIF) (6). All vessels are assumed to contain the AIF concentration for each time step, and flux from a vessel does not affect the vascular concentration. Using the resulting contrast agent distribution, a signal intensity is calculated for each MRI voxel at 438 $$$\mu$$$m in plane resolution (down-sampled from the 2 mm resolution) at each AIF time step. The extended Tofts’ model (Eq. [3]) is then fit to the simulated signal intensity of each MRI voxel to provide estimates of $$$K^{trans}$$$, $$$v_e$$$ (extravascular, extracellular volume fraction), and $$$v_p$$$ (plasma volume fraction):$$[3], C_t(t)=K^{trans}\int_{0}^{t}C_p(u)exp(\frac{K^{trans}}{v_e}(t-u))du+v_pC_p(t),$$ Finally, the fit values for $$$K^{trans}$$$, $$$v_e$$$, and $$$v_p$$$ are then compared to the histological ($$$v_e$$$ and $$$v_p$$$) and assigned ($$$K^{trans}$$$) model values used in the forward model, and a percent error is calculated for each simulated MRI voxel.
RESULTS
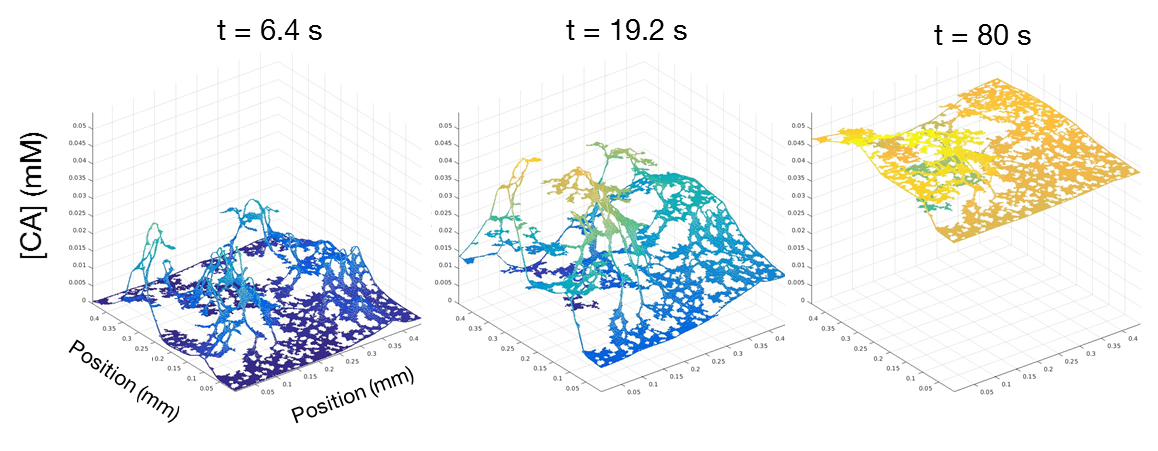
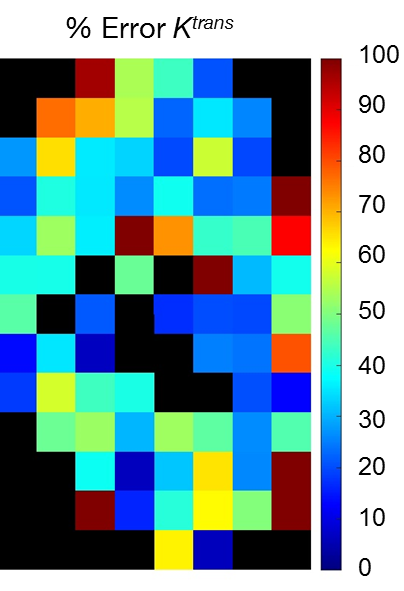
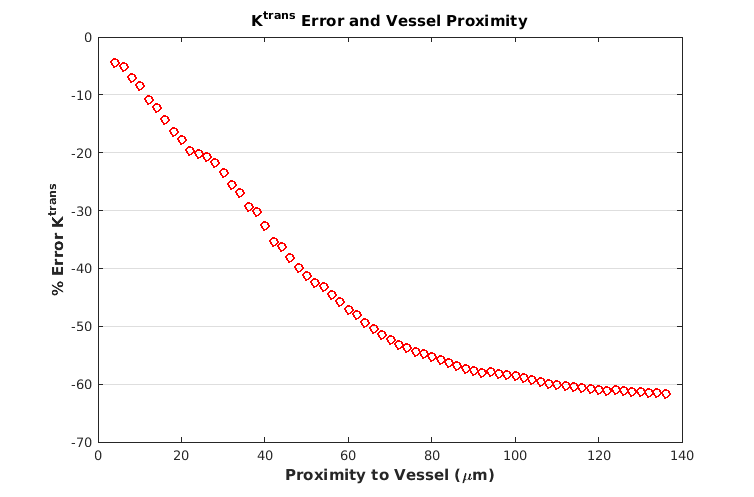
Figure 2 depicts an example FEM time course of a voxel with a histological $$$v_p = 0.0135$$$. The parameterization error for this voxel was -62% for $$$K^{trans}$$$, -24% for $$$v_e$$$, and 107% for $$$v_p$$$. Figure 3 depicts the parameterization error of $$$K^{trans}$$$ within each imaging voxel of the total imaging domain. Error in $$$K^{trans}$$$ is maximized in poorly perfused regions, such as the necrotic core, while well-perfused voxels exhibit the least error. Figure 4 depicts the relative error in $$$K^{trans}$$$ and $$$v_e$$$ with increasing distance from a vessel. Of particular note, as the distance from the vessel increases, the parameterization error increases.DISCUSSION
Necrotic voxels exhibit high parameterization error, as they are poorly perfused, or only show enhancement due to nearby voxels. Eq. [3] most accurately fits voxels with high vascular surface area. Fit values consistently underestimate the assigned ($$$K^{trans}$$$) and histological values ($$$v_e$$$ and $$$v_p$$$), indicating that the accessible volume (i.e., $$$v_e$$$) is frequently less than biological values. Figure 4 demonstrates that Eq. [3] is most accurate in the tissue region nearest to vessels, indicating that error is caused by limited diffusion.CONCLUSION
This work demonstrates a major source of error in DCE-MRI parameterization using the standard pharmacokinetic models employed by the field (ourselves included). Having demonstrated these shortcomings, future efforts are aimed at amending the standard model to account for diffusion of contrast agent, which we hypothesize will improve the accuracy of estimated pharmacokinetic parameters.Acknowledgements
No acknowledgement found.References
(1) Tofts PS, Kermode AG, et al. Measurements of the blood-brain barrier permeability and leakage space using dynamic MR imaging 1. Fundamental Concepts. Magn Reson Med. 1991:17(2):357-67
(2) Barnes SL, Quarles CC, et al. Modeling the Effect of Intra-Voxel Diffusion of Contrast Agent on the Quantitative Analysis of Dynamic Contrast Enhanced Magnetic Resonance Imaging. PlosOne.2014:9(9)
(3) Fluckiger JU, Loveless ME, et al. A diffusion-compensated model for the analysis of DCE-MRI data: theory, simulations and experimental results. Physics in Medicine and Biology.2013:58:1983-1998
(4) Koh TS, Hartono S, et al. In vivo measurement of gadolinium diffusivity by dynamic contrast-enhanced MRI: A preclinical study of human xenografts. Magnetic Resonance in Medicine.2013:69:269-276
(5) Sorace AG, Quarles CC, et al. Trastuzumab improves tumor perfusion and vascular delivery of cytotoxic therapy in a murine model of HER2+ breast cancer: preliminary results. Breast Cancer Res Treat.2016:155(5):273-83
(6) Loveless ME, Halliday J, et al. A quantitative comparison of the influence versus population-derived vascular input functions on dynamic contrast enhanced-MRI in small animals. Magnetic Resonance in Medicine.2012:67:226-236
Figures