0207
Comparison of Ferumoxytol based Cerebral Blood Volume estimates using Multi-Echo T2* and Ultrashort Echo Time T1 Imaging1Dept. of Medical Physics, University of Wisconsin-Madison, Madison, WI, United States, 2Dept. of Radiology, University of Wisconsin-Madison, Madison, WI, United States
Synopsis
Intracranial vascularity is modified in a wide array of diseases including cancer, various forms of dementia, and stroke. Steady state imaging with Ferumoxytol provides unique opportunities to estimate cerebral blood volume (CBV). In this work, we investigate the correlation between relaxometry changes measured utilizing ultrashort echo time variable flip angle (UTE-VFA) R1 and a multi-echo R2* approaches. Initial results from 8 healthy volunteers shows a high degree of correlation of R1 with R2* measures and improved performance in and around vessels. This, and opportunities to probe disease induced disagreements, suggests potential value in combined R1 and R2* measures.
Purpose:
Cerebral vascular hemodynamics and vascular architecture are modified in a wide array of diseases including cancer, various forms of dementia, and stroke. For these reasons, perfusion is commonly assessed clinically with dynamic susceptibility imaging utilizing a gadolinium bolus injection, resulting in estimates of cerebral blood volume (CBV) and flow. However, in cases in which vascular architecture is of greater interest, steady state imaging of Ferumoxytol may be used to estimate CBV.1-3 Ferumoxytol is an ultrasmall superparamagnetic iron oxide (USPIO) particle that exhibits strong T2* shortening effects and has an exceptionally long intravascular half-life. While Ferumoxytol studies of CBV to date have focused on the T2* effects, Ferumoxytol also has high T1 relaxivity. Susceptibility based and T1 shortening (e.g. DCE) has substantially different mechanism to affect the extravascular signal. This presents an opportunity to probe different aspects of vascular remodeling, if accurate and co-registered T1 and T2* mapping can be achieved. For example, T1 based techniques are sensitive to water exchange with the tissue; while, susceptibility based techniques are not.4 The purpose of this work is to investigate the correlation between relaxometry changes measured after the administration of ferumoxytol utilizing quantitative T1 and T2* approaches. Of particular relevance with ferumoxytol, we estimated T1 from an ultrashort echo time variable flip angle approach (UTE-VFA) which simultaneously mitigates bias from flow and T2*.Methods:
Subjects: The study population consisted of 8 healthy subjects (age range 20-51y, mean=30y, 5F) with institutional approval and subject consent. MRI: 3D volumetric images were acquired using 3D UTE-VFA and T2* mapping sequences on a 3.0T scanner (MR750, GE Healthcare Waukesha, WI, USA) with a 32ch brain coil (Nova Medical, Wilmington, MA, USA). For all patients, scanning was performed before and after the administration of two doses of ferumoxytol (AMAG Pharmaceuticals, Inc., Cambridge, MA). Ferumoxytol was diluted to 60 ml and injected as a slow infusion. Images were acquired at 3 time points: pre-contrast, after a first injection (1mg/kg) and a second injection (4mg/kg), for a total ferumoxytol dose of 5mg/kg. UTE-VFA was acquire with: TE/TR = 0.2/3.6ms, flip angles = 2°,8°,14°,20°, imaging volume=240x240x240mm3, 0.94mm isotropic resolution, scan time 5:11min. Actual flip angle (AFI) images were also acquired from which B1 maps were generated, these maps were combined with the fitting of the UTE-VFA images to obtain R1 (1/T1) images. 3D multi-echo, gradient echo images were acquired with: TR= 32.5 ms, 8 echo times ranging from 2.2ms to 29.8ms, flip angle = 15 degrees, 1mm isotropic resolution, and FOV=256x180x240mm3. R2* (1/T2*) images were generated from complex fitting the multi-echo images. A total of 6 sets of images were generated per subject, 3 R1 and 3 R2* images at different ferumoxytol concentrations (0,1mg/kg,5mg/kg). These images were co-registered using a rigid body registration utilizing the source images. For each subject, region of interest measures were made in three regions: gray matter, white matter and blood vessel. Measures were averaged over 3 slices. Pixel wise changes were analyzed in the registered images and cumulated into a 2D histogram of measures. This data was projected for along the R1 and R2* values at two different doses concentration 1mg/kg and 5mg/kg.Results:
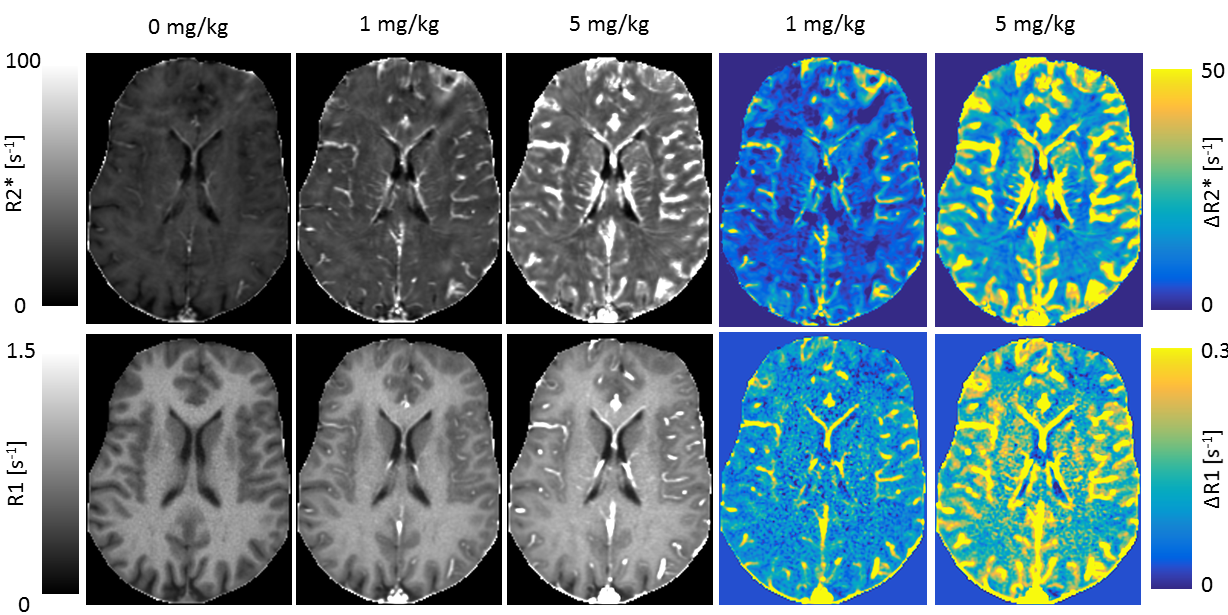
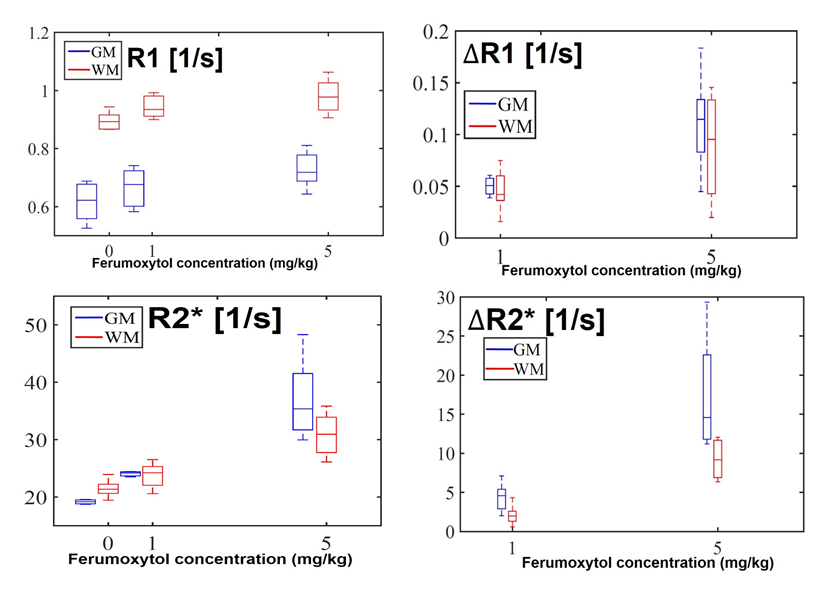
Figure 1 show representative R2*, R1, ΔR2*, and ΔR1 images from a single slice of the volume from one subject. Both images are acquired at the same resolution; however, R2* measures are susceptible to effective resolution loss from static gradients from large vessels. R1 measures are unaffected by this artifact; however, the SNR is substantially lower. Figure 2 shows the R2* and R1 changes observed in ROI’s across all subjects. As expected R2* is substantially more sensitive and more linear with respect to dose. In Figure 3, this non-linearity and sensitivity pattern is not present in the large vessels in which UTE-VFA R1 measures are substantially more sensitive and linear with respect to dose. Figure 4 shows pixel wise relationship between R2* and R1 measures for all subjects. The pixel wise correlation shows near linear agreement when projected onto R2*. As projected onto R1, the R2* tends to exhibit changes in R2* where the R1 does not, suggesting some blooming effects.Discussion and Conclusion:
In this work, we present initial results in 8 healthy volunteers comparing R1 and R2* changes following the administration of ferumoxytol. The UTE-VFA technique employed demonstrated a high degree of correlation with R2* measures and was highly effective in large vessels. The ability to depict large vessel changes and the potential to probe permeability changes, suggest that this technique may be of value when combined with the more sensitive susceptibility based measures.Acknowledgements
We gratefully acknowledge R01NS066982, ASNR Alzheimer’s Grant Award and GE Healthcare for assistance and support.References
1. Christen T, et al. High-resolution cerebral blood volume imaging in humans using the blood pool contrast agent ferumoxytol. Magn Reson Med. 2013 Sep;70(3):705-10. doi: 10.1002/mrm.24500
2. Pohlmann A, et al. Cerebral blood volume estimation by ferumoxytol-enhanced steady-state MRI at 9.4 T reveals microvascular impact of α1 -adrenergic receptor antibodies.NMR Biomed. 2014 Sep;27(9):1085-93. doi: 10.1002/nbm.3160. Epub 2014 Jul 24.
3. Varallyay CG, et al. High-resolution steady-state cerebral blood volume maps in patients with central nervous system neoplasms using ferumoxytol, a superparamagnetic iron oxide nanoparticle. J Cereb Blood Flow Metab. 2013 May;33(5):780-6. doi: 10.1038/jcbfm.2013.36.
4. Larsson HB, et al. Quantification of the effect of water exchange in dynamic contrast MRI perfusion measurements in the brain and heart. Magn Reson Med. 2001 Aug;46(2):272-81.
Figures