0205
Simultanous-multi-slice and Alternating Multi-echo Measurement Sequence (SAME) for Perfusion Imaging1Department of Radiology, University Medical Center Freiburg, Freiburg, Germany, 2Department of Cognitive Neuroscience, Maastricht Brain Imaging Centre (MBIC), Maastricht University, 3Department of Neuroradiology, University Medical Center Freiburg, Freiburg, Germany
Synopsis
In this work, we combine simultaneous multi-slice acquisition with a multi-echo readout, dedicated to dynamic susceptibility-contrast perfusion imaging (DSC). With this approach, multiple spin and gradient echo images can be obtained at short repetition times to determine both T2 and T1 effects of contrast agent in a robust and stable manner.
Purpose
Perfusion imaging is widely performed using single-echo EPI sequences. More advanced dual- or multiecho sequences in which both, gradient and spin echoes are acquired, allow for assessment of the vessel size index (1), and to model T1-effects (2) but suffer from too long repetition times to accurately sample the blood dynamics. In this work we use a simultaneous multi slice approach to reduce the repetition time by a factor of three and combine it with a scheme of alternating gradient –and spin echo acquisitions.Methods
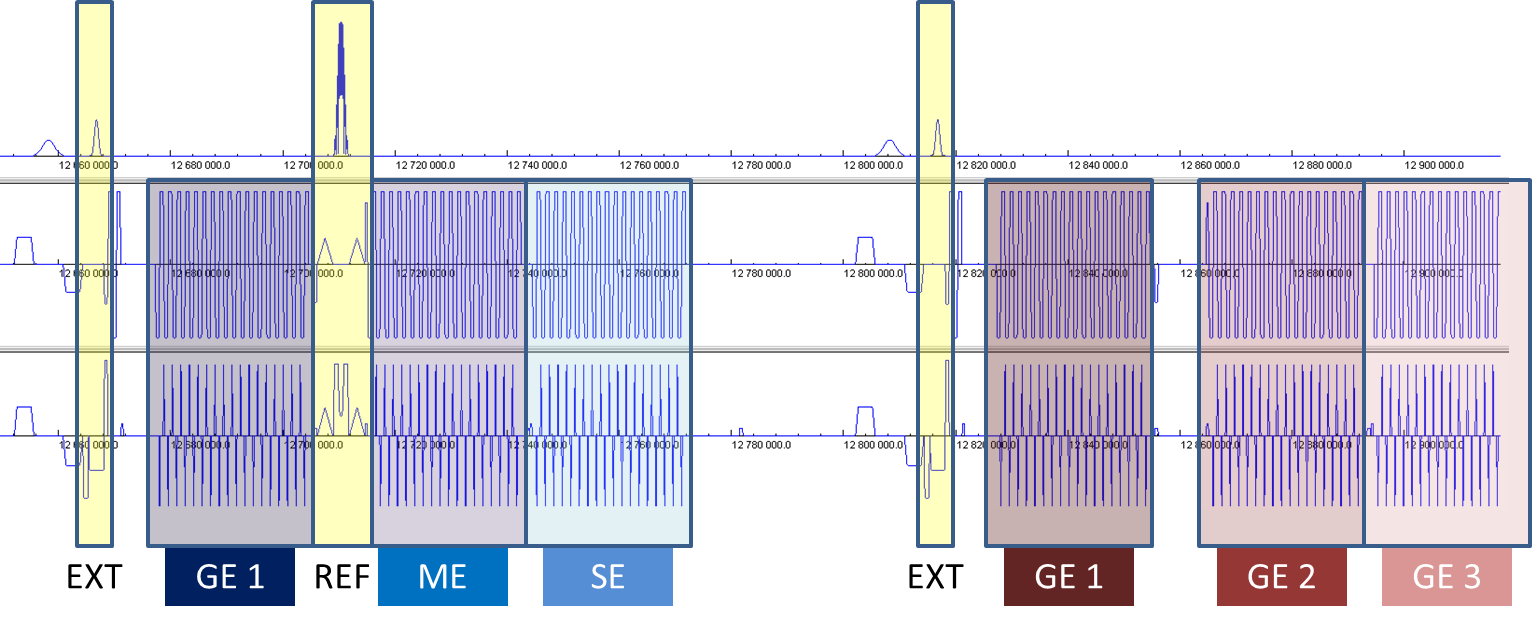
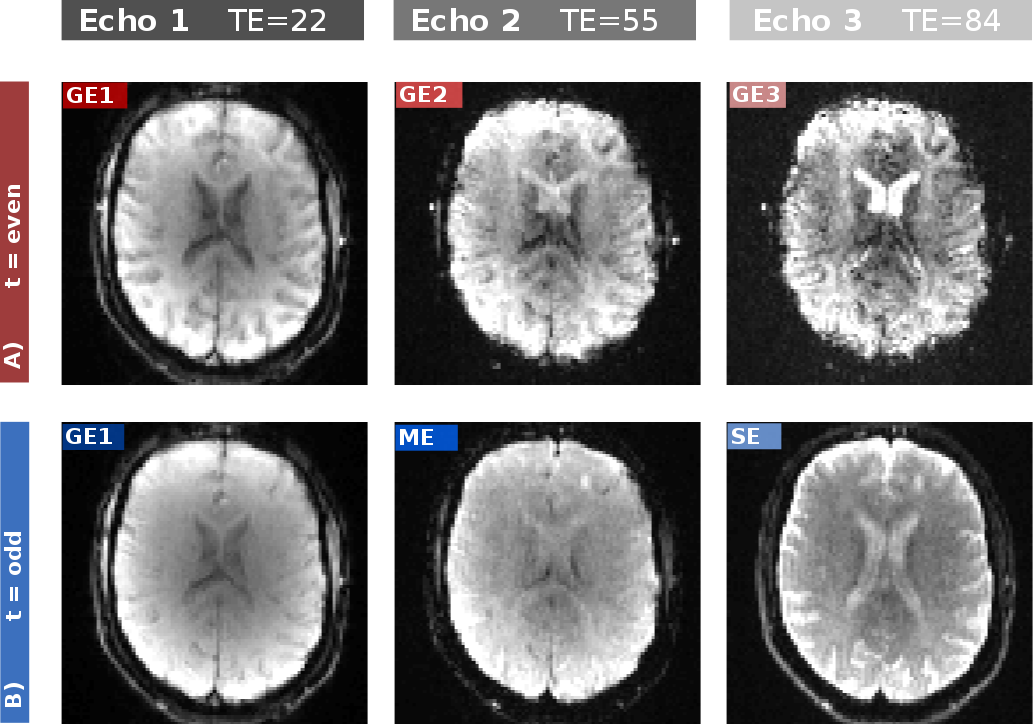
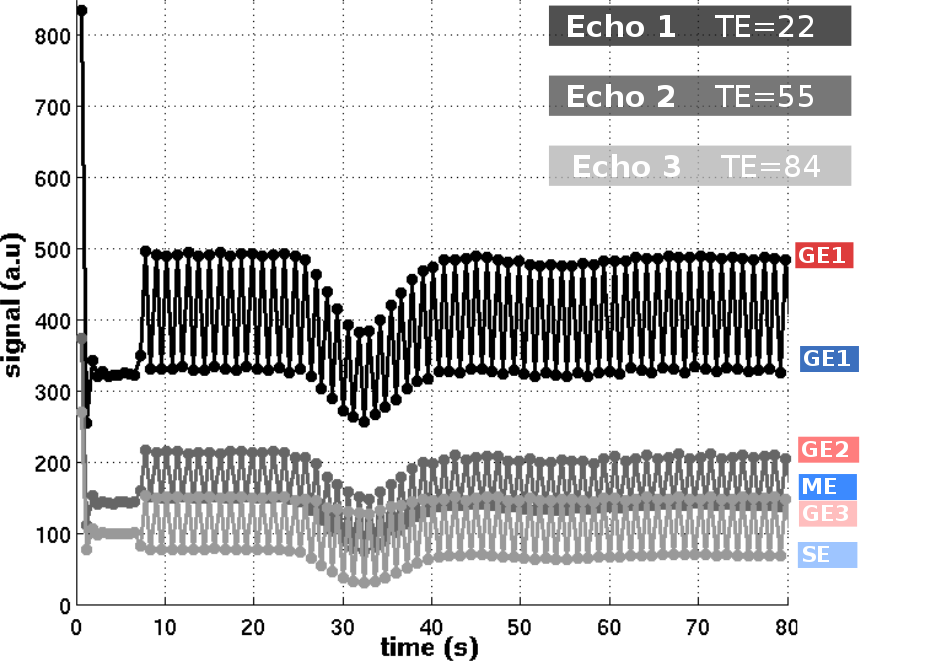
A multi-echo SMS-EPI sequence was modified to apply an 180deg refocusing pulse after an initial gradient echo. This pulse is then alternatingly applied during the runtime of the sequence, leading to 6 different contrasts (Figure 1). Simultaneous multislice (SMS) excitation and refocusing pulses were generated as linear combinations of three sinc and refocusing Shinnar–Le Roux (SLR) pulses respectively, using optimized relative phases to reduce peak RF. Peak RF power of the refocusing pulse was further minimized by reducing the amplitude of the slice-selective gradient using the variable rate selective excitation (VERSE) method. The excitation pulse was calculated online and the refocusing pulse was designed offline in Matlab and imported to the sequence during runtime. Online SMS reconstructions of single-shot data were performed using the sliceGRAPPA implementation as distributed with blipped-CAIPI EPI.We performed measurements in 8 patients with no vascular diseases undergoing post-contrast examinations (0.1mmol/Kg Gadovist), on a SIEMENS Prisma, 3Tesla. Protocol parameters were: TR=600ms, TE1=22ms, TE2=55ms, TE3=84ms, Matrix Size 96x96, SMS Factor 3, 15 Slices, 2 x 2 x 5 mm3, GRAPPA Factor 2. For all 6 echoes, signal time courses were converted to estimated changes in relaxation rates using
$$S(t) = S_0(t) \mathrm{e}^{-dR_2(t) TE}$$ where $$$S(t)$$$ denotes the time series of dynamic scans and TE refers to the echo time within a scan. T1 effects can be approximated with the time-dependent $$$S_0(t)$$$, and fitting both $$$log(S_0(t))$$$ and $$$dR2(t)$$$ for each time point t, using a two-parameter linear fit for all echoes, similar to (2).
Results and Discussion
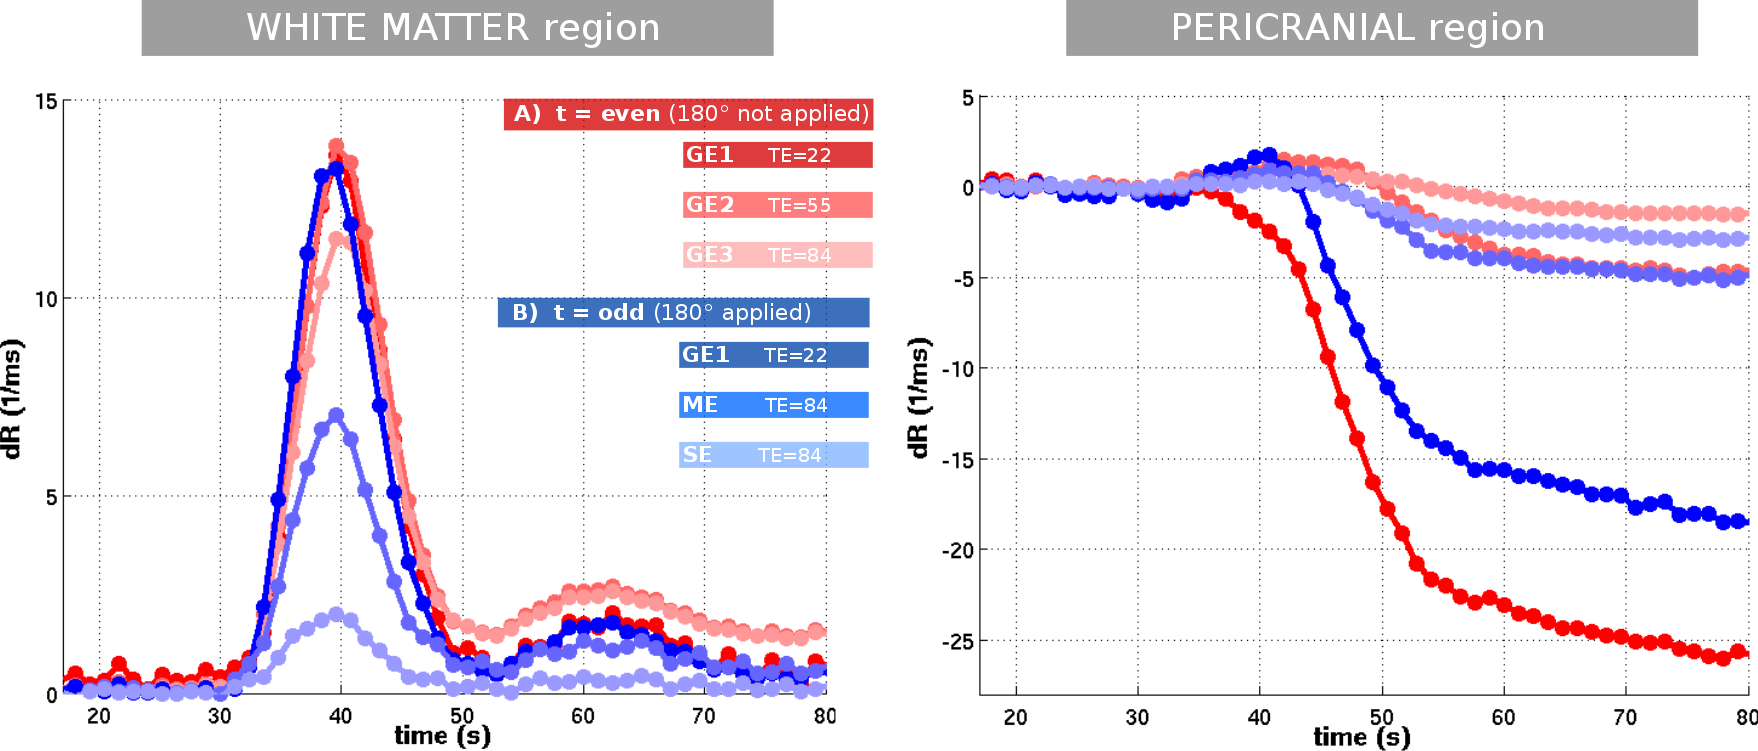
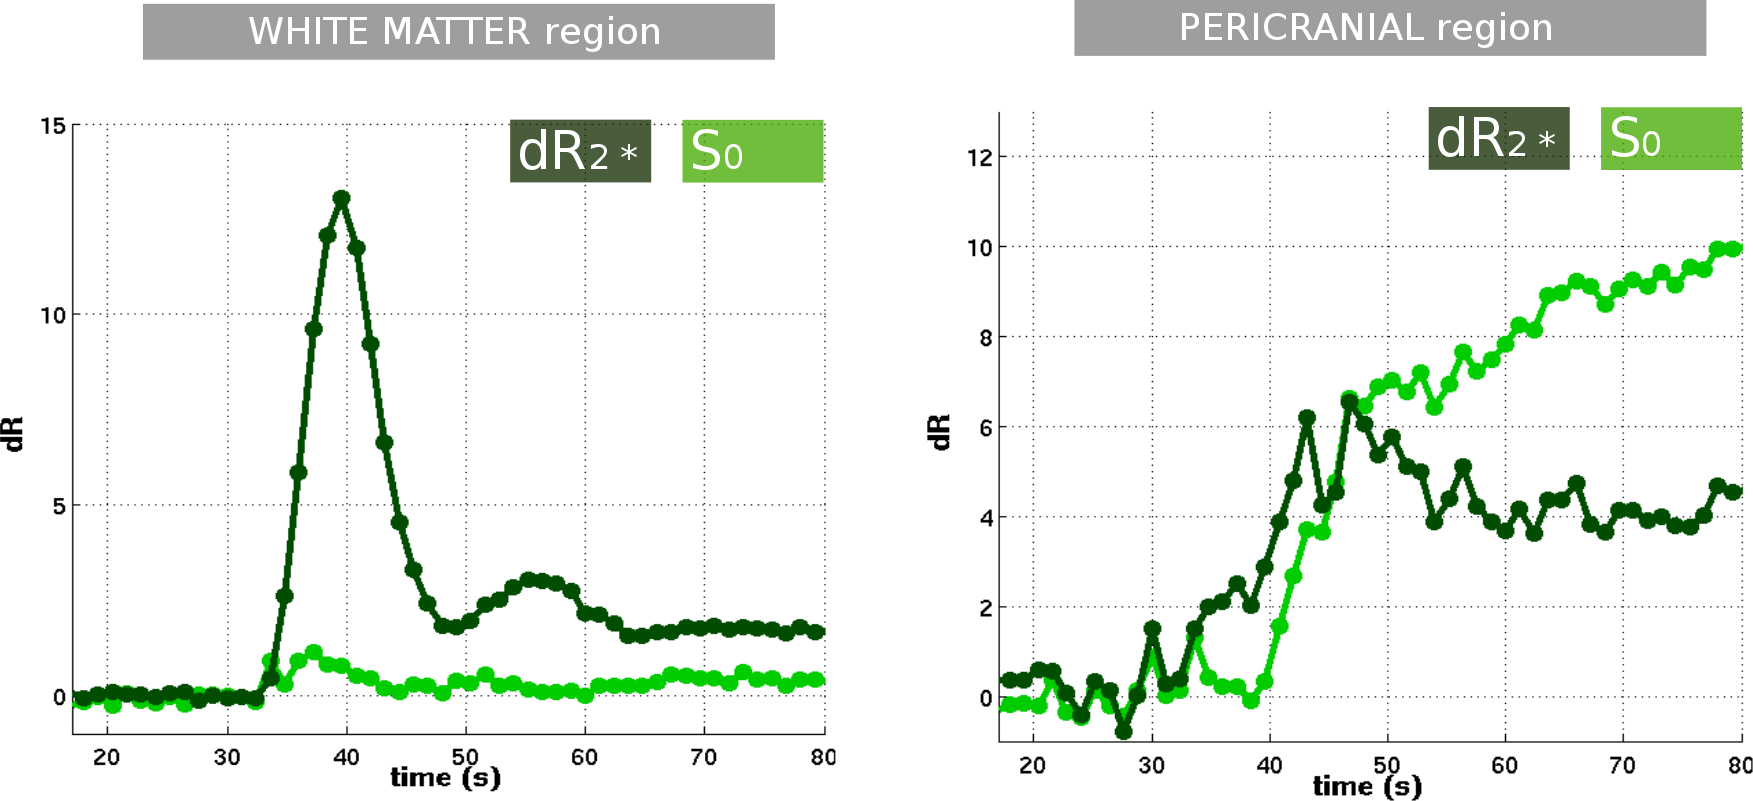
The results for one patient are exemplarily shown in Figure 2-5. The alternating application of spin-echo refocusing pulses leads to an alternating signal level, with each branch having its own steady state. Treating each branch independently results in a total of 6 curves of relaxation rate changes (Figure 3) at an effective sampling rate of 2TR = 1200ms. Both figures indicate that the method yields stable and robust time series for multiple echoes with a single measurement sequence. Note that in Figure 4, relaxation rates were calculated the "standard" way for each echo individually using a fixed $$$S_0$$$ determined from the baseline signals. This does not account for T1 effects, which becomes obvious in slightly different post-contrast signal levesls The effect is even stronger in a pericranial region outside of the skull, where the blood brain barrier is absent. Figure 5 shows that obviously, T1 and T2 effects can be separated in a robust manner using a time dependent $$$S_0(t)$$$, fitted to all echoes. In this work, we only used the gradient echo data for the fit. A more advanced fit accounting also for the microvascular content of the asymmetric- and spin echoes is part of future work.Conclusions
The proposed method allows for robust and stable measurement of multiple gradient- asymmetric- and spin echoes. With this, both T2 and T1-effects of contrast agent can be separated at good SNR and short repetition times for accurate perfusion measurement implementing both DSC and the DCE in the same examination.Acknowledgements
This work has partly been funded by German Research Foundation (DFG) grant number KI1089/3-2 .References
1. Troprès, Irène, et al. "Imaging the microvessel caliber and density: principles and applications of microvascular MRI." Magnetic resonance in medicine 73.1 (2015): 325-341.
2. Kiselev, Valerij G, Schmiedeskamp, Heiko. Chapter "Vessel Size Imaging" in: Perfusion Imaging: Clinical Applications and Theoretical Principles, Wolters Kluwer Health, Editor: Bammer, R, 2016 https://books.google.de/books?id=fxKtCwAAQBAJ
2. Schmiedeskamp, Heiko, et al. "Combined spin-and gradient-echo perfusion-weighted imaging." Magnetic resonance in medicine 68.1 (2012): 30-40.
Figures