0204
Anisotropic cerebral vascular architecture causes orientation dependency in cerebral blood flow and volume measured with spin echo dynamic susceptibility contrast magnetic resonance imaging1UBC MRI Research Centre, University of British Columbia, Vancouver, BC, Canada, 2Engineering Physics, University of British Columbia, Vancouver, BC, Canada, 3Department of Physics and Astronomy, University of British Columbia, Vancouver, BC, Canada, 4Pediatrics, University of British Columbia, Vancouver, BC, Canada, 5Center of Functionally Integrative Neuroscience (CFIN) and MINDLab, Department of Clinical Medicine, Aarhus University, Aarhus, Denmark
Synopsis
Cerebral white matter tissue perfusion measured with gradient echo dynamic susceptibility contrast (DSC) imaging exhibits a strong dependency on the angle between white matter fibres and the main magnetic field. Here, we investigate how spin echo DSC depends on the orientation of white matter and explain orientation effects by a model of diffusion within a magnetically inhomogenous environment created by a vascular bed with isotropic and anisotropic components. We found that the change in $$$R_2$$$ value for the SE DSC is 20% larger in WM fibres perpendicular to $$$B_0$$$ than for those parallel, compared with 100% larger in GRE DSC.
Introduction
Cerebral white matter tissue perfusion measured with gradient echo dynamic susceptibility contrast (DSC) imaging exhibits a strong dependency on the angle between white matter fibres and $$$B_0$$$[1]. This effect is due to large vessels running parallel with the fibre tracts, resulting in orientation dependent field inhomogeneities on top of the orientation independent effects from the capillary bed. Therefore, the change in T2* induced by the contrast agent depends on fibre orientation. In spin echo DSC the dephasing due to static field inhomogeneities is reversed. However, spins still lose coherence because they diffuse in a magnetic inhomogeneous environment, resulting in an irreversible loss of coherence, that increases with increased contrast agent concentration, i.e. increased paramagnetism of the vessels.
Here, we investigate how spin echo DSC depends on the orientation of white matter, and explain orientation effects by a model of diffusion within a magnetically inhomogenous environment created by a vascular bed with isotropic and anisotropic components.
Methods
Data from 13 healthy subjects were acquired at 3T. DSC was acquired with spin echo EPI (TE=60ms, voxel volume=3x3x3mm3). Fibre orientation was calculated from a diffusion tensor scan as described in[2]. The DSC signal in each WM voxel was sorted into bins according the local angle $$$\alpha$$$ with respect to $$$B_0$$$, with $$$\alpha$$$ ranging from 2.5° to 87.5° in 5° increments. The data was then averaged across all voxels in each bin for all subjects and $$$\Delta{R_2}=-\frac{1}{TE}ln(\frac{S}{S_0})$$$ was calculated, where $$$S_0$$$ is the signal before the arrival of the CA, and $$$S$$$ is the signal at the time corresponding to $$$\text{CA}_{\text{PEAK}}$$$.
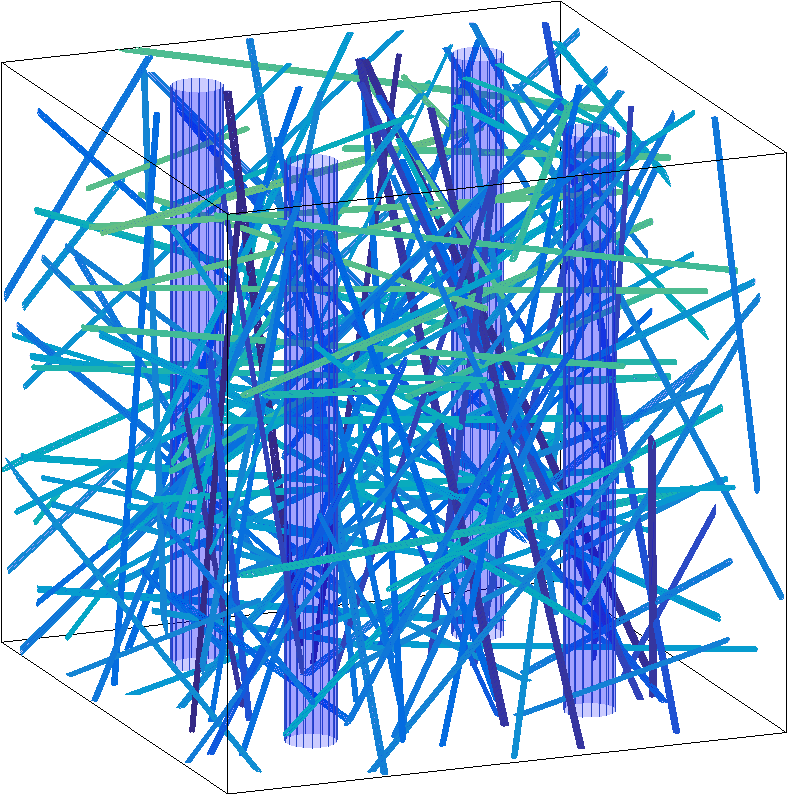
The magnetization within a 3D voxel was simulated for TE=60ms. Inside this voxel we place an isotropic vascular bed of small vessels with mean radii of 13.7mm and a standard deviation of 2.1mm[3] , as well as a variable number of large anisotropic vessels parallel to the containing WM along the $$$\hat{z}$$$-direction. The total blood volume fraction $$$\text{BVF}$$$ determines the total number of vessels present, with a relative blood fraction $$$\text{iRBVF}$$$ in the isotropic vasculature, and the remaining blood fraction $$$\text{aRBVF}=1-\text{iRBVF}$$$ in the anisotropic vasculature. The simulation is performed both with and without CA in order to calculate $$$S_0$$$ and $$$S$$$ for each $$$\alpha$$$.
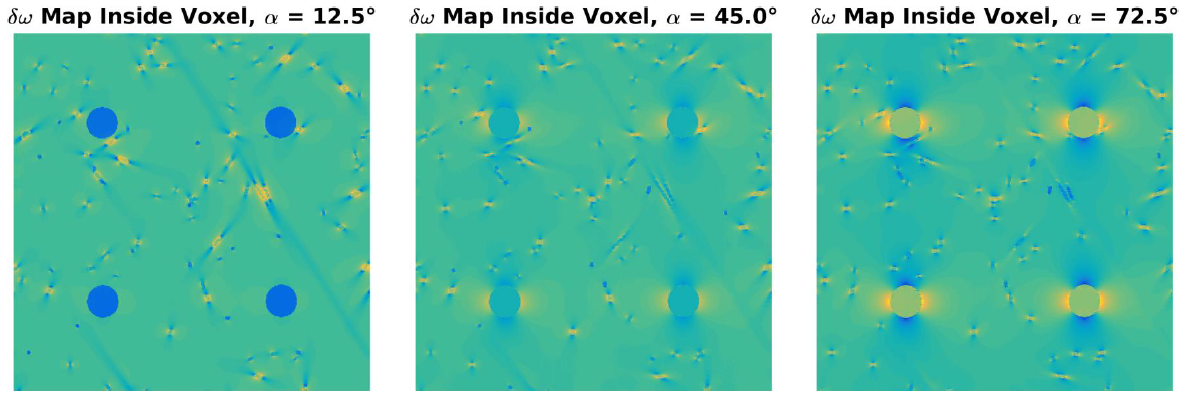
The Bloch-Torrey equation $$$\frac{dM}{dt}=D\Delta{M}-\Gamma(\vec{r})M$$$ is solved numerically for the complex transverse magnetization $$$M$$$ using a discrete time-stepping method with step size ΔTE=2ms and D=3.037mm2/s[4]. The magnetization is computed at time TE=60ms, with the complex conjugate taken at TE/2 to represent the inversion pulse. The complex decay rate $$$\Gamma$$$ is given by $$$\Gamma(\vec{r})=R_2(\vec{r})+i\delta\omega(\vec{r})$$$; $$$\delta\omega(\vec{r})=\gamma{B_0}\cdot{G_{\alpha}}(r,\theta)\ast\delta\chi(\vec{r})$$$ is the local frequency shift. These frequency shifts $$$\delta\omega$$$ encode the WM fibre orientation dependency.
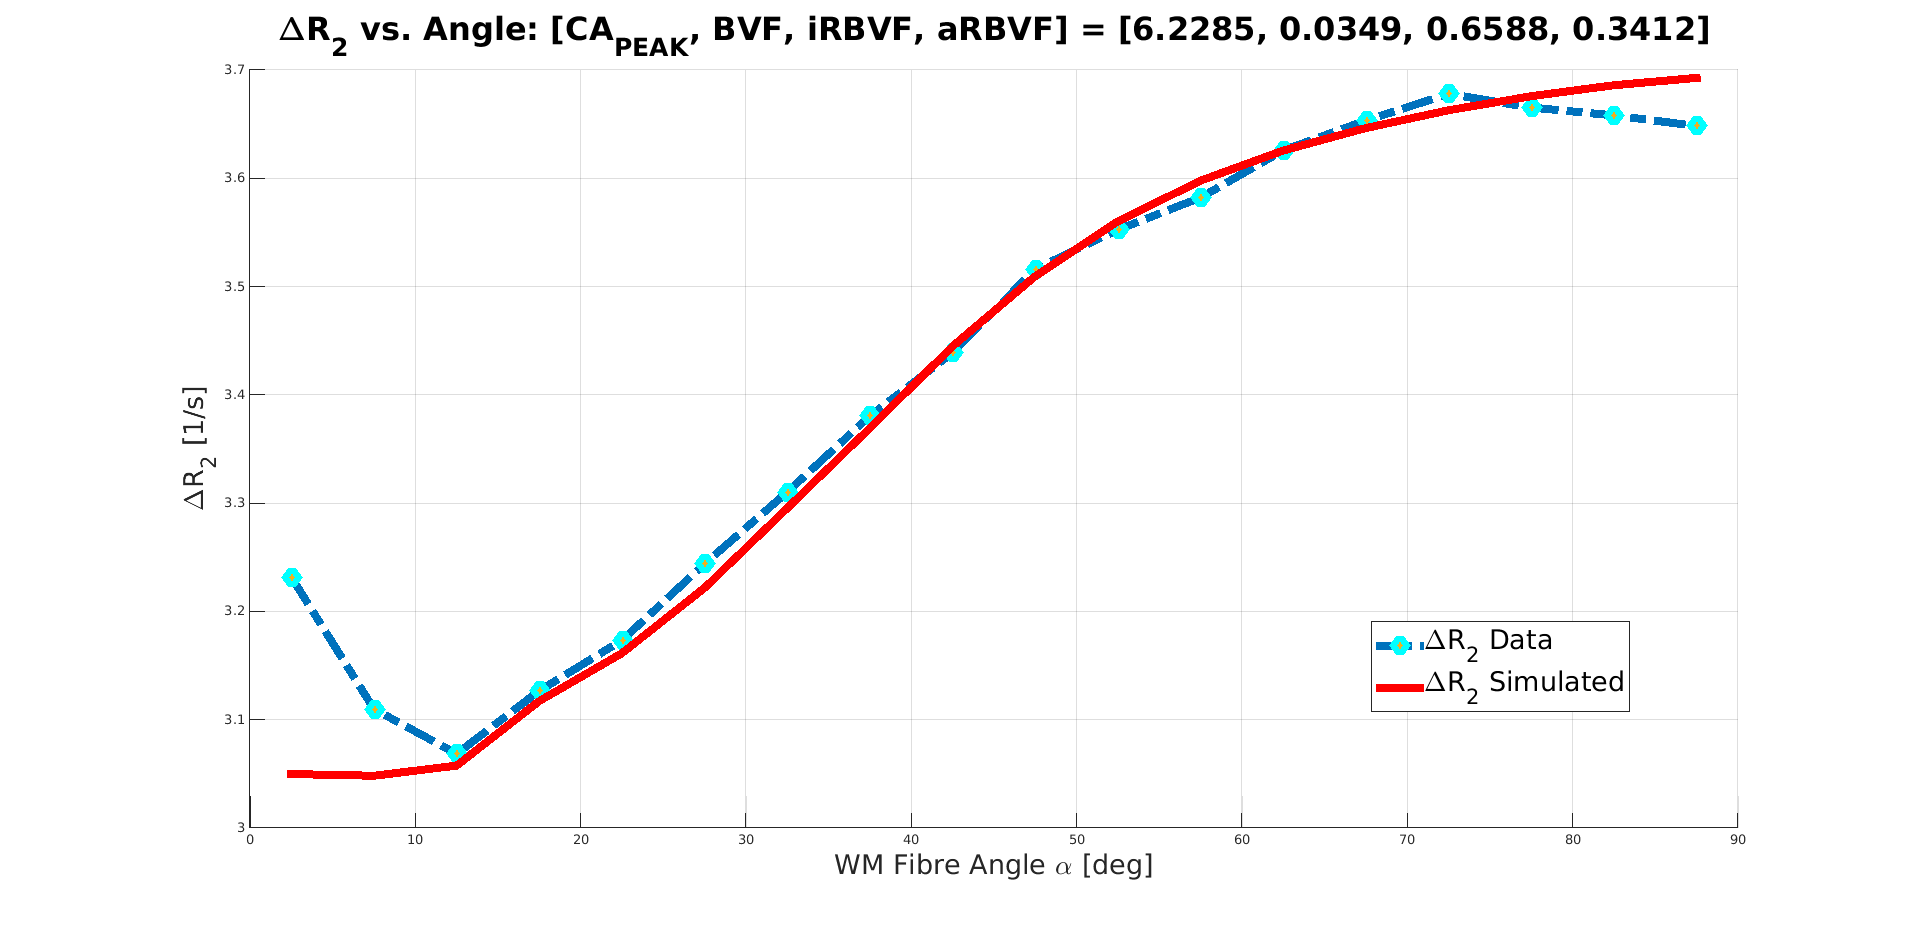
The simulation parameters $$$\text{BVF}$$$, $$$\text{iRBVF}$$$, and $$$\text{CA}_{\text{PEAK}}$$$ are determined through a gradient descent based $$$L_2$$$-norm minimization algorithm using MATLAB's lsqcurvefit to match the simulated $$$\Delta{R_2}$$$ vs. $$$\alpha$$$ curve with the observed curve. This process is repeated for differing numbers of large anisotropic vessels. An example voxel geometry and corresponding frequency shift map are shown in Figures 1 and 2.
Results
$$$\Delta{R_2^*}$$$ was found to be 20% larger for fibres perpendicular to the main magnetic field compated to parallel fibres. The resulting $$$\Delta{R_2}$$$ vs. $$$\alpha$$$ curve and fitted simulation parameters are shown in Figure 3 for N = 5 anisotropic blood vessels.Discussion and Conclusion
$$$\Delta{R_2}$$$ shows a 20% difference between parallel and perpendicular fibres, compared to 100% in $$$\Delta{R_2^*}$$$ presented earlier[1]. It is important to emphasize that T2 shortening of the signal via direct interaction between spins and the local fields created by the CA molecules within vessels is not sufficient for the observed signal reduction. Rather, it is the fact that the field inhomogeneities occupy a much larger volume than the blood vessels that create these inhomogeneities, thereby affecting a large fraction of the signal originating from an imaging voxel and also creating an orientation dependency. Despite the substantial increase of R2 within the blood vessels, it is actually the diffusion outside the blood vessels that creates most of the signal loss observed in the presence of a CA.
We found an anisotropic vessel volume fraction of 35%, compared to 50% for gradient echo EPI experiment[1]. One explanation may be that the spatial frequencies of field inhomogeneities created by large vessels are locally low and diffusion happens within a locally more homogeneous environment. Signal attenuation is therefore small and large vessels become less visible to the spin echo experiment. In gradient echo DSC, however, most of the signal loss is due to static dephasing where the size of the vessel plays no role, as long as it much smaller than the voxel.
Acknowledgements
No acknowledgement found.References
1. Hernández-Torres E, Kassner N, Forkert ND, Wei L, Wiggermann V, Daemen M, Machan L, Traboulsee A, Li D, Rauscher A. Anisotropic cerebral vascular architecture causes orientation dependency in cerebral blood flow and volume measured with dynamic susceptibility contrast magnetic resonance imaging. J Cereb Blood Flow Metab. 2016
2. Hernandez-Torres E, Wiggermann V, Hametner S, et al. Orientation dependent MR signal decay differentiates between people with MS, their asymptomatic siblings and unrelated healthy controls. PLoS One 2015; 10: e014095
3. Jochimsen TH, Ivanov D, Ott DV, et al. Whole-brain mapping of venous vessel size in humans using the hypercapnia-induced BOLD effect. NeuroImage 2010; 51: 765–774.
4. Holz, Manfred and Heil, Stefan R. and Sacco, Antonio.Temperature-dependent self-diffusion coefficients of water and six selected molecular liquids for calibration in accurate 1H NMR PFG measurements. Phys. Chem. Chem. Phys. 2000; 2:20 4740-4742.
Figures