0203
Measuring transmembrane water exchange in rat brain cortical cells in normal and pathological conditions1Section on Quantitative Imaging and Tissue Sciences, DIBGI, NICHD, National Institutes of Health, Bethesda, MD, United States, 2Advanced Imaging Research Center, Oregon Health & Science University, Portland, OR, United States, 3Section on Critical Brain Dynamics, LSN, NIMH, National Institutes of Health, Bethesda, MD, United States
Synopsis
Knowledge of transmembrane water exchange kinetics is invaluable for the correct interpretation of many MRI experiments, e.g., DCE-MRI, diffusion MRI, etc. Here we quantitatively studied the transmembrane water exchange in organotypic cultures from rat brain cortex with an MR relaxation contrast agent. In normal states, we determined the equilibrium cellular water efflux rate constant [kio] is 2.15 (± 1.28) s-1 at 34 (± 1) °C. In the likely cell-swollen state induced by Ouabain perfusion, we, for the first time, quantitatively measured a global increase of the intracellular volume fraction (~104%) together and a large decrease of kio (~64%).
Purpose
Water in the intra- and extracellular spaces is in steady-state exchange. Knowledge of the exchange kinetics is invaluable for correctly interpreting findings obtained in many MRI experiments, e.g., DCE-MRI,1 diffusion MRI,2,3 etc. Moreover, the exchange rate constant itself might provide important physiological and pathological information, e.g., about metabolic activity.4 Dominating over the passive pathways based on diffusion across membranes, transmembrane water cycling enjoys a metabolically active pathway via the Na+-K+-ATPase (NKA) pump, which is essential for all mammalian cells and is primarily responsible for maintaining the K+ and Na+ gradient in vivo.1,5 Dysfunction of the NKA pump is also reported involved in many pathological processes, like cerebral ischemia, etc.6 Thus, the determination of transmembrane water exchange kinetics when the NKA-pump is blocked will also provide crucial biological information.Methods
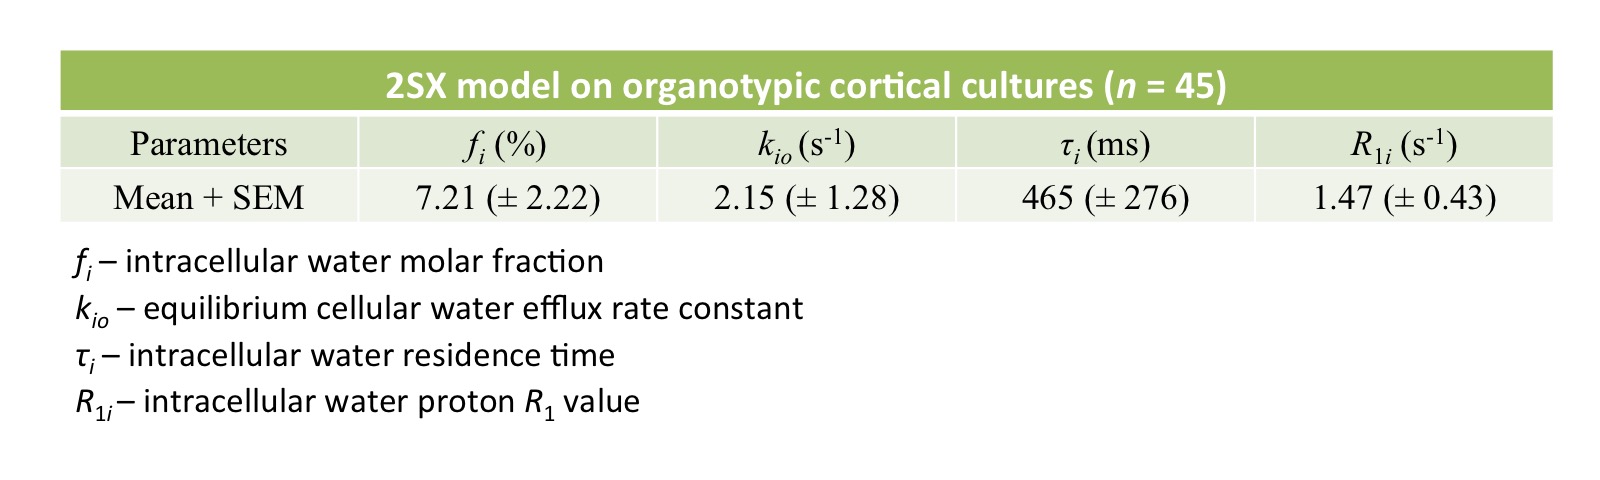
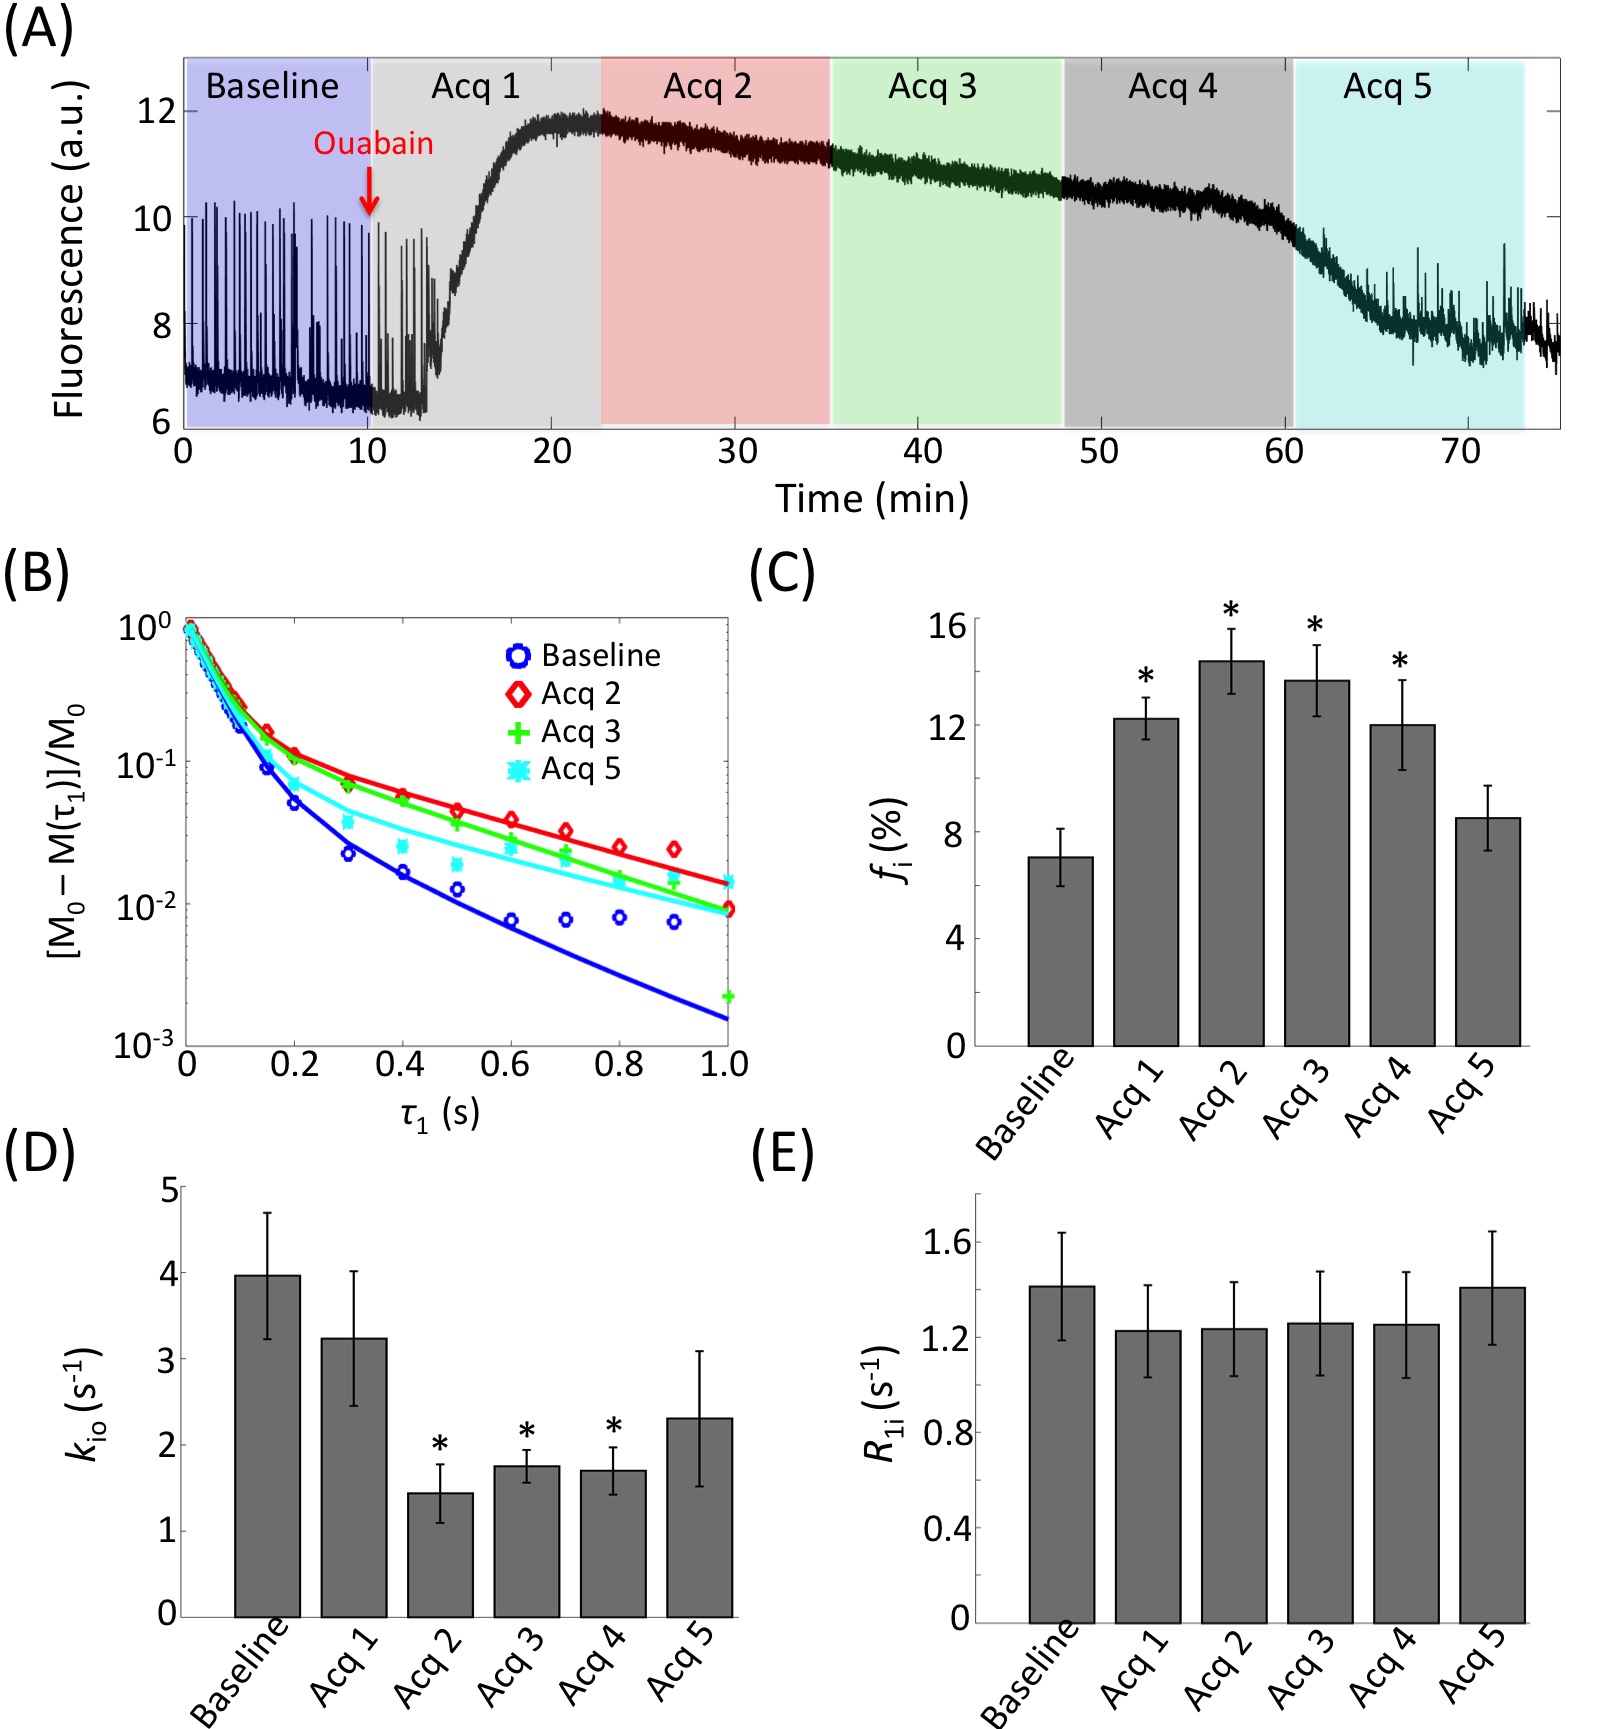
We studied organotypic tissue cultures from rat brain cortex using a novel multimodality imaging test bed with simultaneous intracellular calcium fluorescence imaging and MR acquisition capabilities.7,8 The organotypic cortical cultures were kept perfused with artificial CSF (ACSF) at a constant temperature 34.0 (± 1.0) °C. Longitudinal MR relaxometry with an extracellular gadolinium-based MR relaxation contrast agent (CA), Gadoteridol (Prohance (PH)), was used to distinguish intracellular and extracellular water compartments by increasing the extracellular water’s longitudinal relaxation rate constant. A saturation-recovery MR sequence with 21 recovery times was used to measure sample R1 values at three different PH concentrations: 0, 2.5 and 5.0 mM. Data were further analyzed with a two-sites-exchange (2SX) model4 to determine the transmembrane water exchange kinetics with the following parameters: fi – intracellular water molar fraction; kio – the equilibrium cellular water efflux rate constant [where τi [= 1/kio] is the intracellular water residence time]; and R1i – the intracellular water R1. NKA pump blockage was induced by adding 1mM Ouabain (an NKA pump inhibitor) into the perfusing medium.Results
Evidence of Exchange. In Figure 1, the R1 data from ACSF is fit well by single-exponential functions at the three PH concentrations. The organotypic culture R1 data were also fit well by a single-exponential function when [PH] = 0 mM, but required at least a bi-exponential function at [PH] = 2.5 and 5.0 mM. A significant decrease of the apparent fraction of the signal (f' sm) with a small apparent R1 (R'1,sm) from [PH] = 2.5 to 5 mM was observed (p < 0.005, Figure 2). This demonstrated the presence of transmembrane proton exchange. 2SX Model. The 2SX model was applied to the data obtained on a single concentration ([PH] = 5.0 mM) with constraints obtained from single-exponential fit on the data collected at [PH] = 0 mM. The 2SX model well fit the R1 data without any systematic bias in the residuals and reported the intracellular water residence time ~465 (± 276) ms (Figure 3 and Figure 4). NKA Blockage. As shown in Figure 5, the intracellular calcium content increased and reached its maximum around ~10 min after starting Ouabain perfusion, and then slowly decreased while Ouabain perfusion continued. The fi values showed almost synchronous behavior – it increased and reached its maximum (from 7.1% to 14.4%) around ~ 20 min after starting Ouabain perfusion. On the other hand, kio showed opposite changes – significantly decreasing (from 4.0 s-1 to 1.4 s-1) after 20-min Ouabain perfusion. The R1i also showed small decrease (from 1.4 s-1 to 1.2 s-1).Discussion
Brain tissue transmembrane water exchange has been measured only with intracerebroventricular Gd(DTPA)2- infusion into rat brain; kio = 1.81 (±0.89) s-1.9 Our kio value measured under normal conditions agrees with this. This information will be useful to model and interpret many MRI experiments, e.g., time-series analysis in DCE-MRI, inter-compartment exchange effects on diffusion MRI, etc. Ouabain has been used to presumably induce cell swelling by blocking the NKA pump for decades,10 but this phenomenon has never been directly characterized by MR. This study, for the first time, quantitatively measured a global fi increase during NKA blockage. If the mean cellular volume is <V>: fi = ρ<V>fw/(1–ρ<V>fM); where ρ is the cell number density, fW is the volume fraction accessible to mobile aqueous solutes, and fM = 1 – fW. R1i ~ <V>-1.] Interestingly, a large decrease of the transmembrane water exchange is also observed during NKA blockage. In addition, the simultaneous cellular calcium uptake also indicates the calcium might play an important role in this pathological process.11 These new findings may provide important clues to not only for the interpretation of some MRI biomarkers on disease, but also to understand some essential physiological processes underlying these diseases, e.g., in cerebral ischemia.Acknowledgements
This work was supported by the Intramural Research Program (IRP) of the Eunice Kennedy Shriver National Institute of Child Health and Human Development, National Institutes of Health. Charles S. Springer, Jr. is supported by the National Institutes of Health under Awards No. UO1-CA154602 and R44-CA180425References
1. Springer CS, Li X, Tudorica LA, et al. Intratumor mapping of intracellular water lifetime: metabolic images of breast cancer? NMR Biomed. 2014; 27:760-773.
2. Nilsson M, Lätt J, Nordh E, Wirestam R, Ståhlberg F, Brockstedt S. On the effects of a varied diffusion time in vivo: is the diffusion in white matter restricted? Magn Reson Imaging. 2009;27(2):176-187.
3. Lee J-HH, Springer CS. Effects of equilibrium exchange on diffusion-weighted NMR signals: The diffusigraphic “shutter-speed.” Magn Reson Med. 2003;49(3):450-458.
4. Zhang Y, Poirier-Quinot M, Springer CS, Balschi JA. Active Trans-Plasma Membrane Water Cycling in Yeast Is Revealed by NMR. Biophys J. 2011;101(11):2833-2842.
5. Zhang Y, Balschi JA. Water Exchange Kinetics in the Isolated Heart Correlate with Na + /K + ATPase Activity: Potentially High Saptiotemporal Resolution. Proc Intl Soc Mag Reson Med. 2013;1(21):4045.
6. Rudolphi KA, Schubert P. Adenosine and Brain Ischemia. In: Adenosine and Adenine Nucleotides: From Molecular Biology to Integrative Physiology. Boston, MA: Springer US; 1995:391-397.
7. Bai R, Klaus A, Bellay T, et al. Simultaneous calcium fluorescence imaging and MR of ex vivo organotypic cortical cultures?: a new test bed for functional MRI. NMR Biomed. 2015;28:1726–1738.
8. Bai R, Stewart C V, Plenz D, Basser PJ. Assessing the sensitivity of diffusion MRI to detect neuronal activity directly. Proc Natl Acad Sci U S A. 2016;113(12):E1728-1737.
9. Quirk JD, Bretthorst GL, Duong TQ, et al. Equilibrium water exchange between the intra- and extracellular spaces of mammalian brain. Magn Reson Med. 2003;50(3):493-499.
10. Buckley DL, Bui JD, Phillips MI, et al. The effect of ouabain on water diffusion in the rat hippocampal slice measured by high resolution NMR imaging. Magn Reson Med. 1999;41(1):137-142.
11. Dirnagl U, Iadecola C, Moskowitz MA. Pathobiology of ischaemic stroke: an integrated view. Trends Neurosci. 1999;22(9):391-397.
Figures
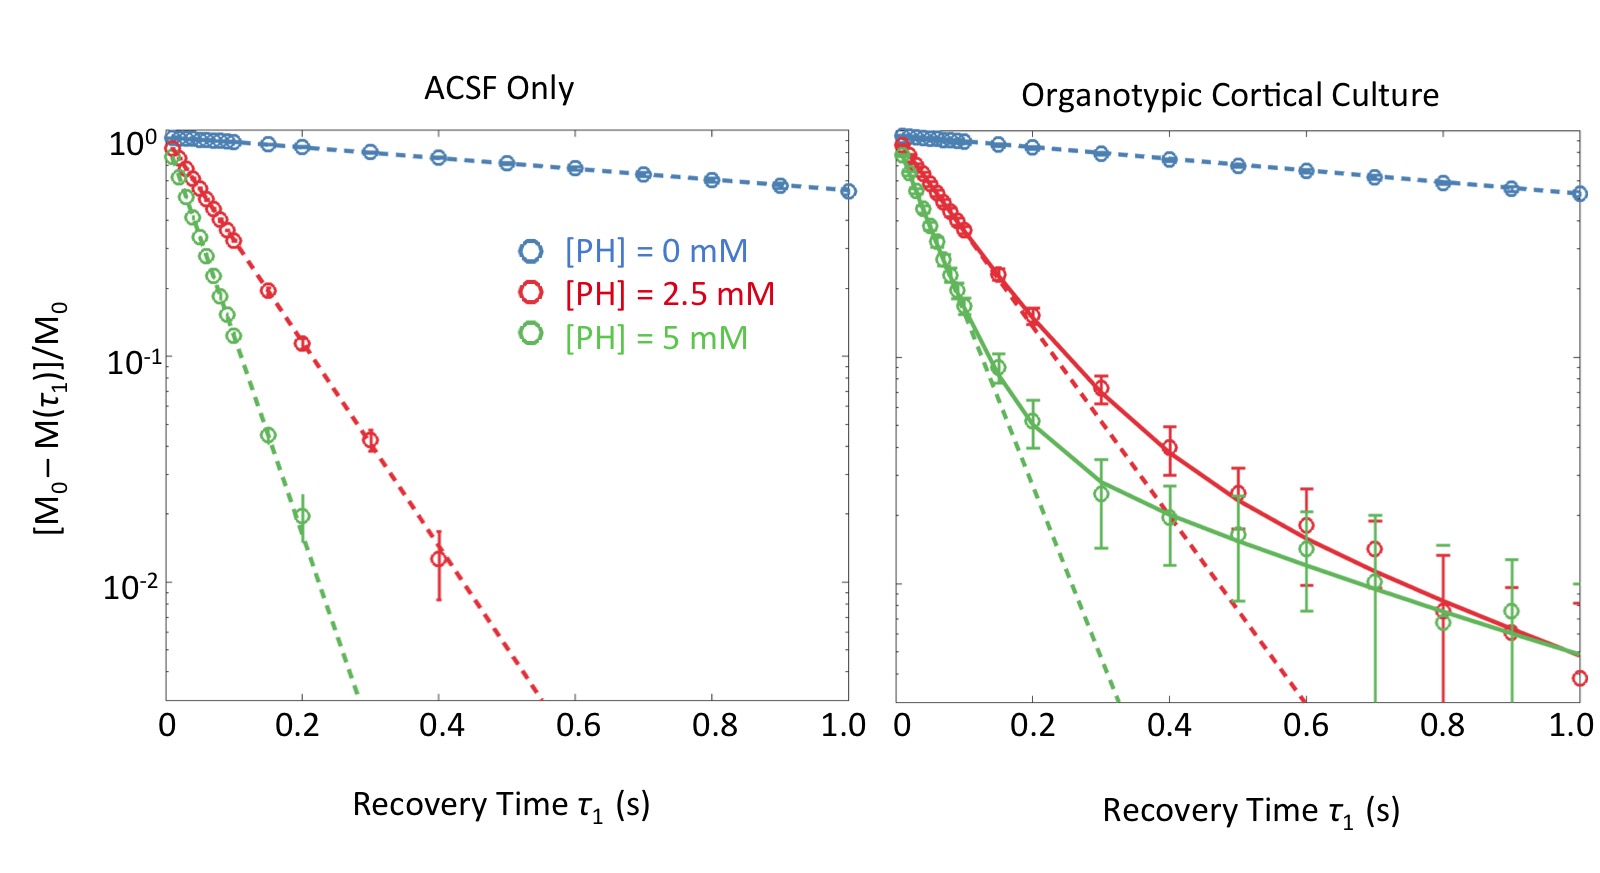
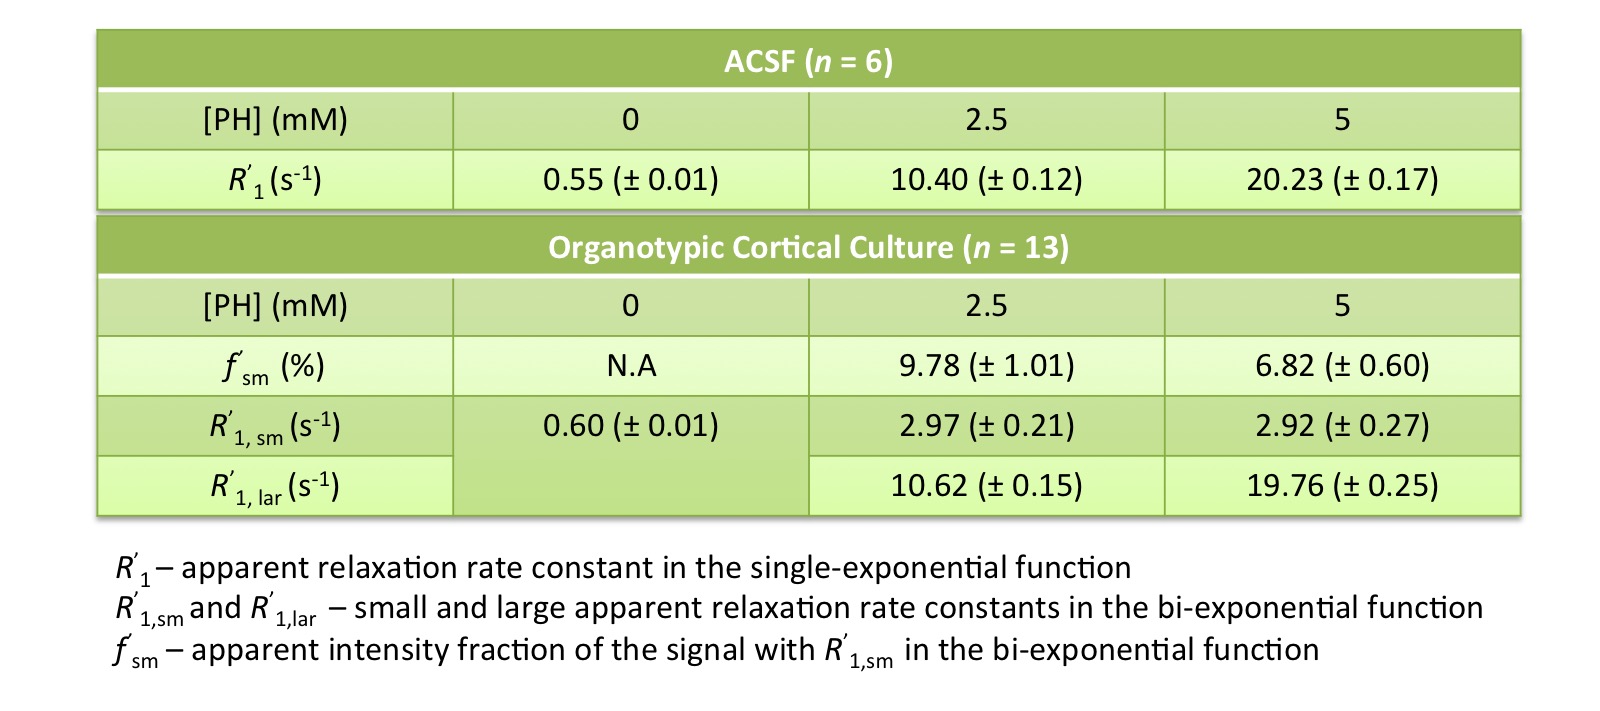
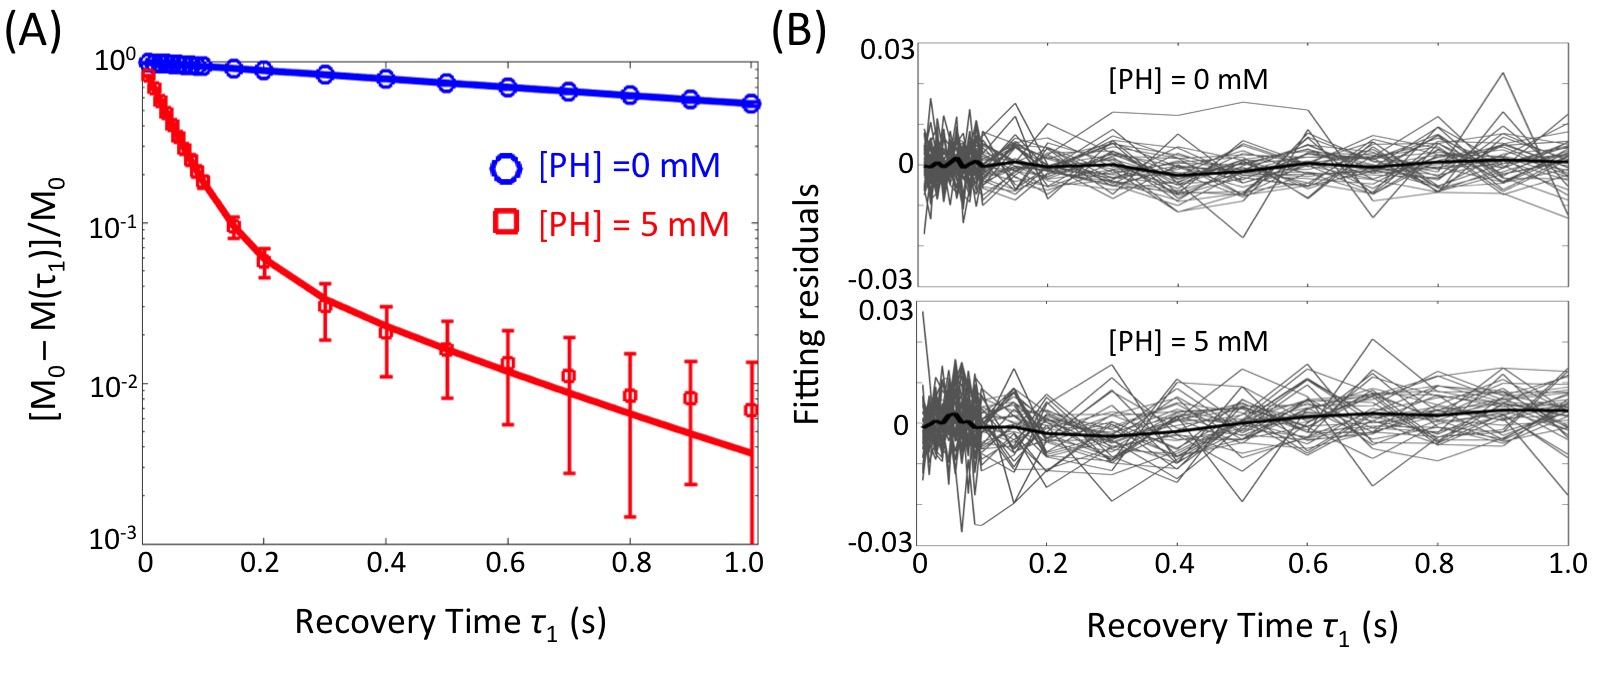
Figure 3. The results (A) and residuals (B) of 2SX fittings of the saturation recovery data from organotypic cortical cultures (n = 45) at [PH] = 0 mM and 5 mM. M(τ1) is the magnetization at recovery time τ1 and M0 is the equilibrium magnetization. In (A), the errorbars represent the standard deviation on each measurement. In (B), the light gray curves are residuals of 2SX fitting of each sample and the black curve is the average of all samples.