0202
D2O Perfusion MRI of Brain Tumor on a Mouse Model: A Preliminary Study1Department of Biomedical Engineering and Environmental Sciences, National Tsing Hua University, Hsinchu, Taiwan, 2Nuclear Medicine, Chang Gung Memorial Hospital, Taoyuan, Taiwan
Synopsis
Recently, deuterium oxide (D2O) has been proposed as an alternative contrast agent on rodent brain perfusion by monitoring the attenuation of 1H signal. Since D2O is a highly diffusible contrast agent, the revealed information of Gd chelates and D2O are different. In this study, we aimed to re-investigate the perfusion information carried by D2O with advanced spatial resolution. We speculated that D2O slowly diffused into tumor area and continuously exchanged with tissue water until a balanced concentration. Inside the tumor region, the heterogeneity shown by D2O and Gd-DTPA are somewhat different.
Introduction
In perfusion MRI, researchers often use contrast agents to observe the signal change of contrast enhancement. The most commonly used contrast agents in clinical are Gd-based chelates. Recently, deuterium oxide (D2O) has been proposed as an alternative contrast agent on rodent brain perfusion by monitoring the attenuation of 1H signal1. The indirect detection of D2O achieved better SNR and image resolution than previously used direction detection2. Since D2O is a highly diffusible contrast agent, the revealed information of Gd chelates and D2O are different. In literature, the D2O has been utilized to observe the tumor perfusion on mouse model by direct detection3. In this study, we aimed to re-investigate the perfusion information carried by D2O with advanced spatial resolution.Materials and Methods
ALTS1C1 tumor cells prepared by cell culture medium containing 10% fetal bovine serum (FBS), which would grow glioma in mouse brain. 105 cells/mL of ALTS1C1 cell (~2μL) was intracerebrally inoculated into C57BL/6J mice (N=5, weight:18~30g). After fourteen days of tumor growth, MRI scanning were performed. All procedures comply with norms of animal experiments. Mice were scanned under 3% isoflurane anesthesia with oxygen on 7T Bruker Clinscan scanner. Isotonic D2O contained 0.9% w/w NaCl with 2mL/100g dose was administered through tail vein within 20 s with syringe pump. Turbo spin-echo (TSE) was used to dynamically scan. Imaging parameters were: TR/TE=1000/14ms, turbo factor=8, matrix size=128*64, FOV=20 mm, 6 slices with thickness=1mm, measurement=120, temporal resolution=9s. The relative concentration of D2O could be calculated as: . Where S0 is the average signal of 20 baseline measurements before D2O injection of single pixel. After using D2O as contrast agent, Gd-DTPA with 0.2mmol/Kg dose was subsequently implemented at the same perfusion slice position and scanned with 2D-FLAIR under the assumption that the subsequent experiment is unaffected by D2O. Imaging parameters were: TR/TE= 4.9/1.97ms, FA=20, matrix size=128*128, FOV=20 mm, 3 slices with thickness=1mm, measurement=160, temporal resolution=2.2s. Data processing were performed by MATLAB and image were analyzed with several different DCE-MRI quantitative models to calculate the kinetic parameters which can provide perfusion information.Result
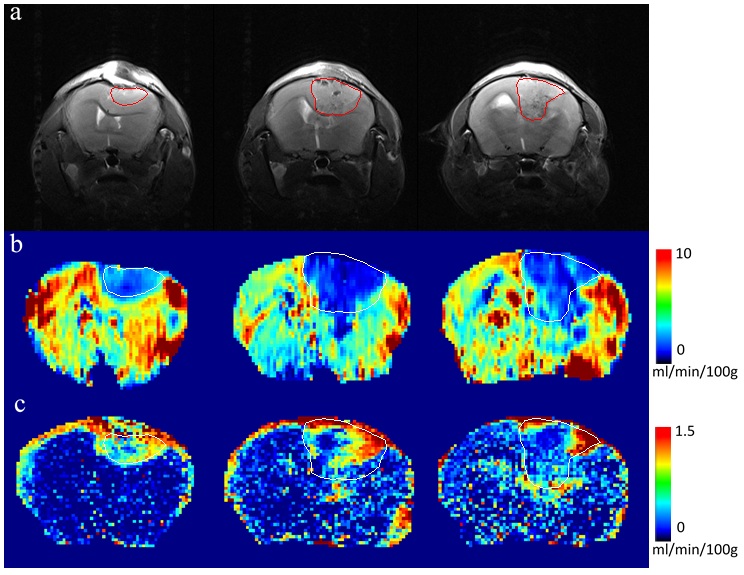
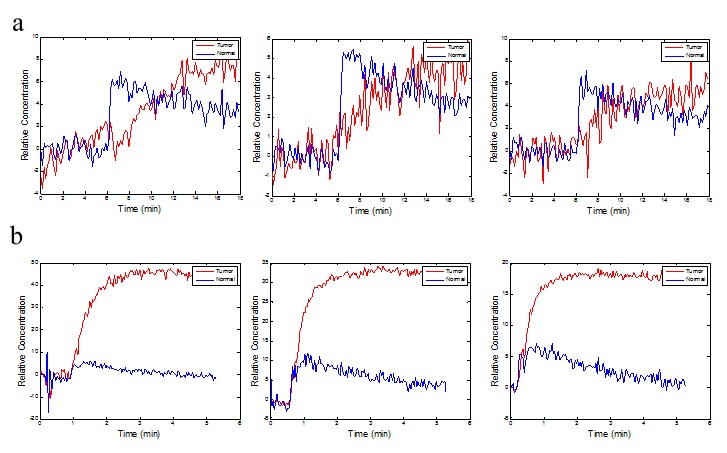
Fig 1’s row a shows three slices of TSE image of a glioma mouse model, and the tumor ROI shown as red line was plotted according to the heterogeneity of intensities. Row b and row c represent Ktrans parametric maps of D2O and Gd-DTPA, respectively. Both were generated from Toft’s model, and the same tumor ROI shown with white line overlapping on the maps. Theoretically, Ktrans can provide mixed information of vascular permeability and flow. In Ktrans maps of D2O, the Ktrans values are heterogeneously distributed and are lower inside the tumor than in the normal brain tissue. It is obviously different from the Ktrans maps of Gd-DTPA, where Ktrans maps of Gd-DTPA are higher inside the tumor in some hot regions than in the normal brain tissue. Fig. 2’s row a and row b show the relative concentration time courses of D2O and Gd-DTPA, respectively. Red lines represent the mean concentration curve of tumor ROI, and blue lines represent the mean concentration curve of contralateral (nontumor) region. Note that the curve of D2O in normal region concentration curves have steep wash-in slope, and then gradually declining. However, the tumor concentration curves are slowly increasing until a steady value.Discussion
In DCE-MRI with Gd-based contrast agent, the tracer is perfused into the limited extracellular-extravascular space. Gd-DTPA is only leaky in lesion tissues in brain tissue. Theoretically, the Ktrans is determined by the permeability, surface area of microvessels, and flow. In theory, due to freely diffusible property, Ktrans value of D2O may represents the flow property rather than the vascular permeability or leakage condition. In our result, tumor Ktrans of Gd-DTPA is higher than normal tissue. This result revealed the high permeability of the immature neovascularization in tumor. However, the Ktrans maps of D2O showed lower tumor Ktrans value. The D2O seems easier to reach the normal tissue than to reach the tumor region. We speculated that it is because of the high osmotic pressure of tumor edema. Therefore, D2O slowly diffused into tumor area and continuously exchanged with tissue water until a balanced concentration. The osmotic gradient may play a significant role when using D2O perfusion as diffusible tracer. Inside the tumor region, the heterogeneity shown by D2O and Gd-DTPA are somewhat different. Further studies are needed to extract potential complementary information of tumor.Acknowledgements
No acknowledgement found.References
1. Fu-Nien Wang et al. NMR Biomed. ;26: 692–698, 2013.
2. Ackerman JJH et al., Proc Natl Acad Sci ; 84:4099-102, 1987.
3. Bogin L et al., J Magn Reson Imaging 16:289:99, 2002.
Figures