0200
Understanding concomitant effects between CEST and ASL contrast.1Institute of Neurology, UCL, London, United Kingdom, 2Centre for Medical Imaging, University College London, London, United Kingdom, 3Institute of Nuclear Medicine, UCLH, London, United Kingdom, 4Medical Physics and Biomedical Engineering, UCLH, London
Synopsis
This study aims to assess the relationship between brain perfusion and CEST measurements. For this purpose, an oxygen-carbogen challenge experiment was designed in order to compare CEST measurements of the rat brain in low and high perfusion conditions.
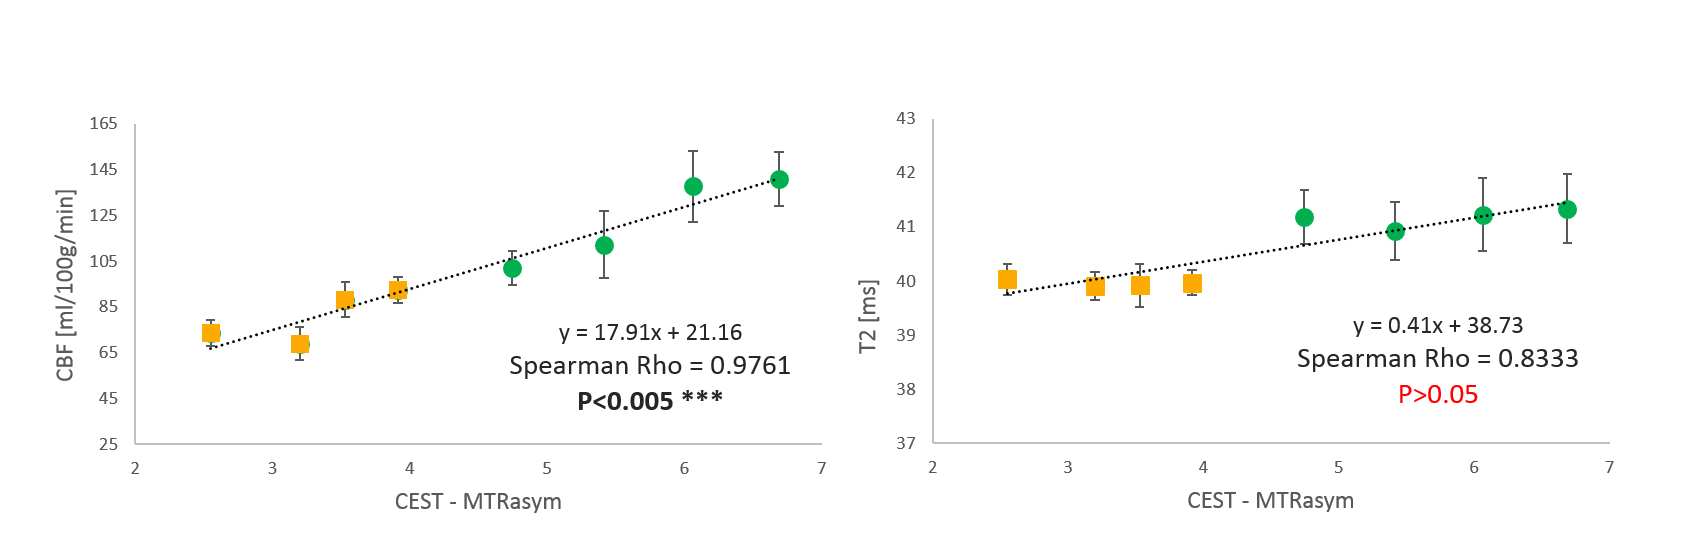
Comparison of the CEST with CBF measurement show strong correlation (p<0.005 with Spearman Rho=0.976). From the results of the study it is notable that blood perfusion is a strong modulator of the observed CEST signal in the rat brain.
Introduction
Chemical Exchange Saturation Transfer (CEST) MRI shows great promise in clinical diagnosis for its sensitivity to a wide range of physiological parameters such as pH, ion and metabolite 1.
However, these same parameters are also confounding factors which prevent accurate interpretations of the measured signal. Until the effects of these confounding factors are clarified, CEST-MRI is condemned to be forever “promising”.
As a further step in that direction this study aims to assess the relationship between brain perfusion and CEST measurements.
Breathing of carbogen gas (95% O2 + 5% CO2) induces an elevation of blood flow due to the vasodilating action of carbon dioxide and has been extensively used in oncology to overcome diffusion-limited hypoxia2,3,4,5. In this study an oxygen-carbogen challenge experiment was designed in order to compare CEST measurements of the rat brain in low and high perfusion conditions.
Methods
Sprague-Dawley rats were anaesthetised and maintained with 1.75% isoflurane throughout. Body temperature was controlled at 36oC using a warm air circulation system. Respiration and cardiac rates were also monitored (SAII).
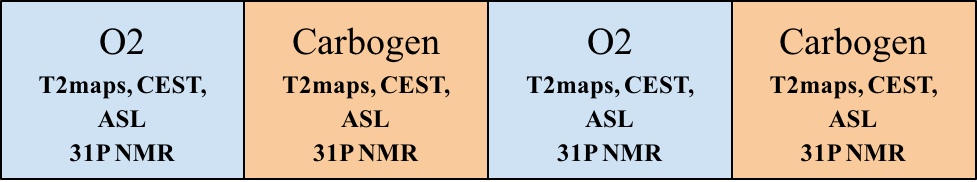
Animals (n=5) were positioned and images acquired (9.4T MRI scanner, Agilent technologies) while breathing either pure oxygen or carbogen. An additional set of (n=2) animals were scanned for 31P-MRS (global hard pulse, TR=10s) under same conditions. See Figure 1.
In each gas challenge phase, CEST, pseudo-continuous arterial spin labelling (pCASL) and T2 maps were collected with the following acquisition parameters.
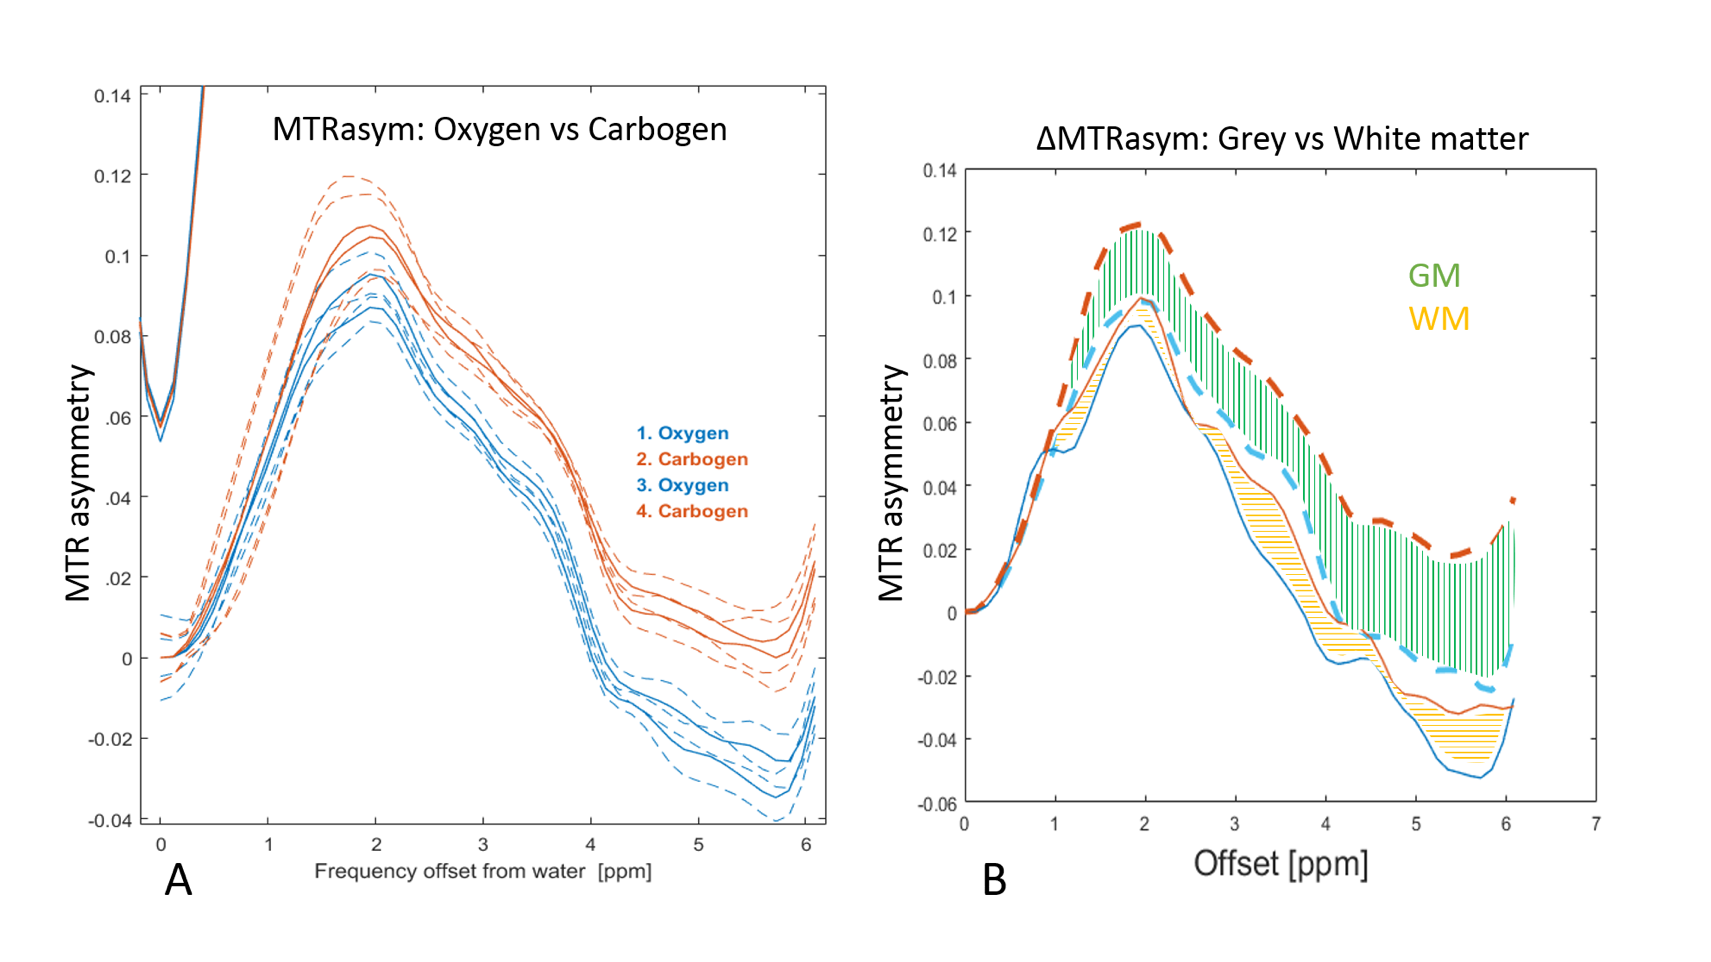
CEST: saturation comprised of 80 Gaussian pulses (B1=2.1µT, pulse duration=50ms, FA=900o ,99% DC). Z-spectra were sampled every 0.25ppm within a range of ±6ppm. Saturation was followed by a center-out turbo-flash. Following B0 correction, CEST signal was calculated as the MTR asymmetry (MTRasym) between 2.5-3.5ppm.
pCASL: gradient echo EPI readout (TR=3s, TE=18ms), followed a pCASL preparation. 20 label-control pairs were acquired (labelling duration 1.4s, pulse labelling delay 1s) Cerebral Blood Flow (CBF) maps were calculated using the general kinetic model6.
T2maps: multi-echo multi-slice spin echo (ETL=20, TR=3.3s, TEmin=6.9ms). T2 maps were calculated by fitting the even echoes to a mono-exponential decay function.
All MRI acquisitions were acquired with the same matrix readout (FOV=20x20mm2, thickness=2mm, matrix size=64x64).
All procedures were conducted under an approved protocol from the Home Office.
Results
During carbogen breathing phases CEST signal was significantly higher than during oxygen phases (Figure 2A). The effect was independent of the order in which gases were delivered and consistent across all animals.
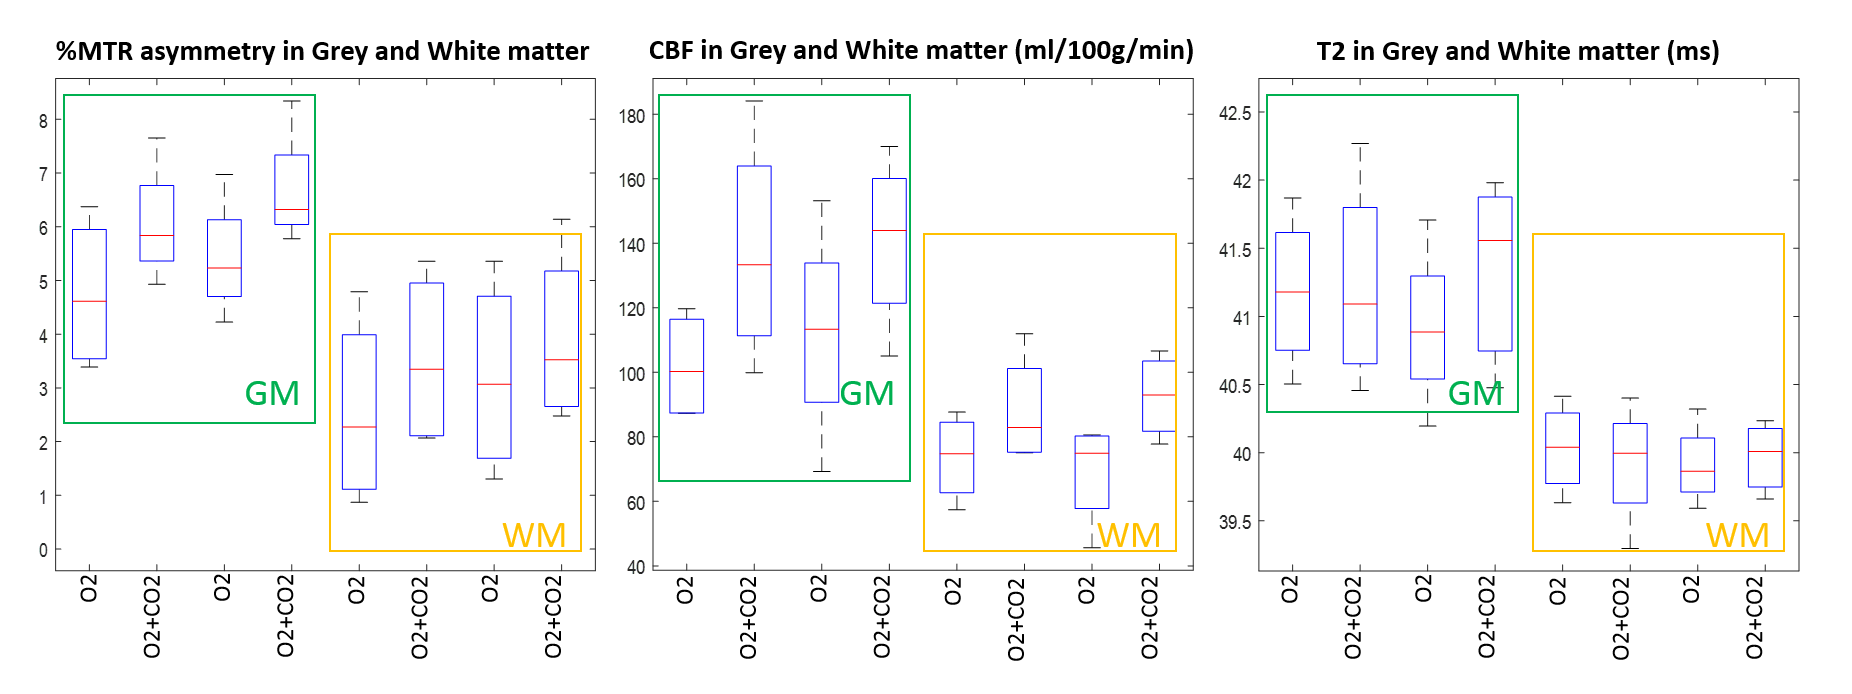
As expected, ASL showed significantly higher perfusion levels during the carbogen phase than during oxygen phase (Figure 3). Notably, the largest changes in the CEST signal (ΔMTRasym ) correspond to areas with high ΔCBF (Figure 2,3).
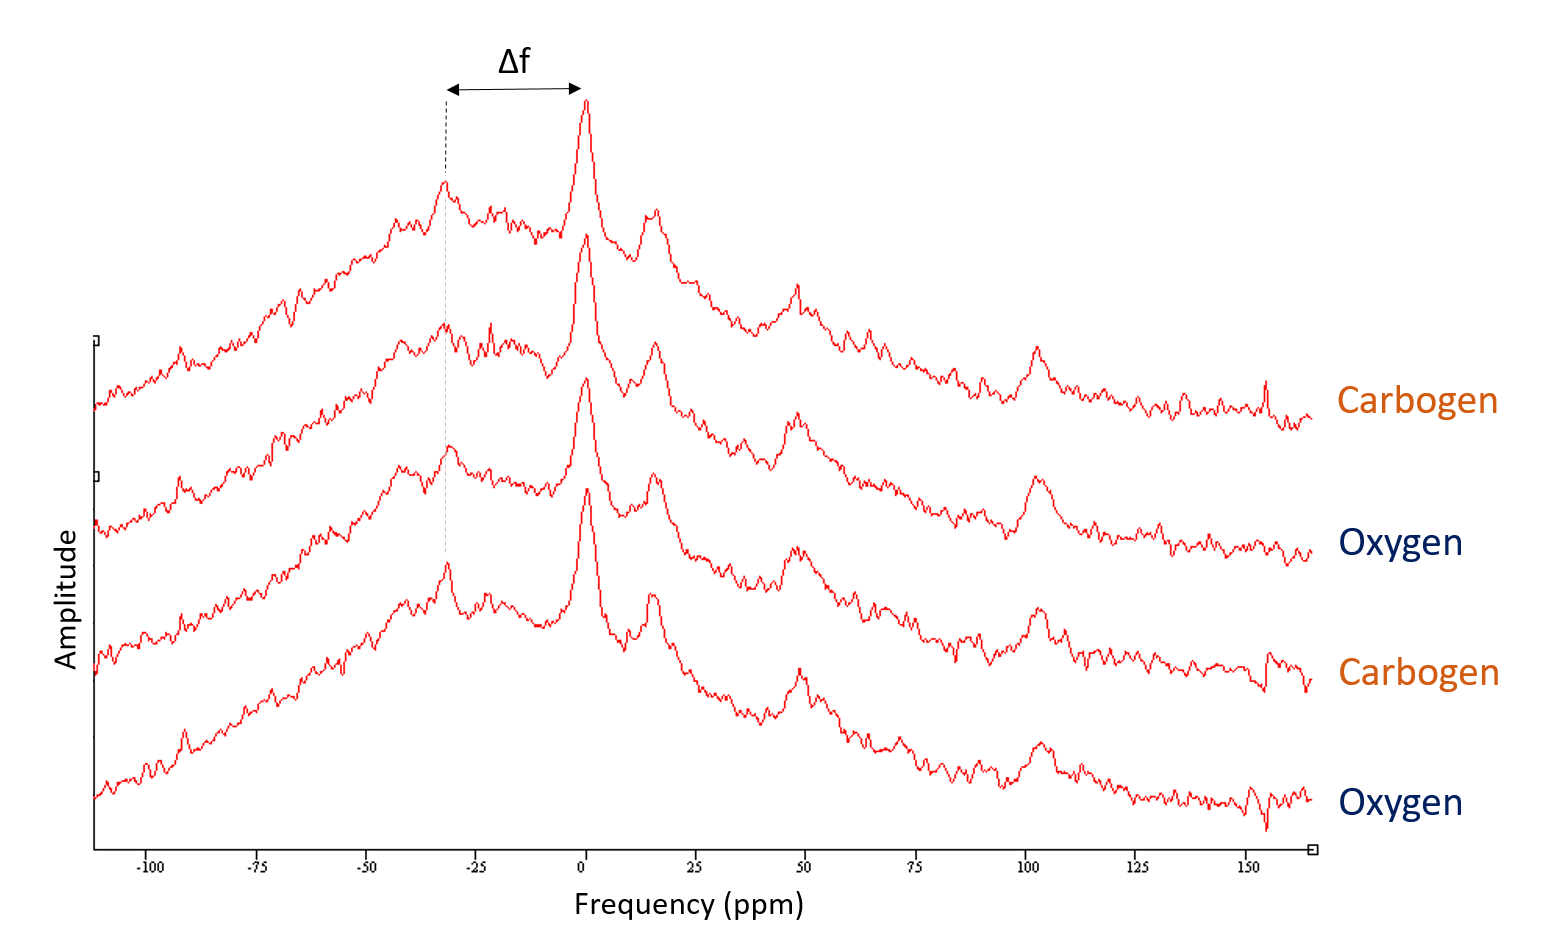
On the other hand, no significant changes in the transverse relaxation time T2 were observed (Figure 4). In agreement with reports in the literature7,8, 31P MRS showed no change in intracellular brain pH (Figure 5).
Discussion
During the oxygen-carbogen challenge, both CEST and perfusion measurement followed analogous trends. Moreover, brain areas with large and small changes in cerebral blood flow (ΔCBF) also displayed larger and smaller changes in the CEST signal (ΔMTRasym), respectively.
Potential increases in tissue oxygenation due to vasodilation5,9,10 did not appear to be considerable as T2 maps showed no significant change (p>0.5) during carbogen challenge.
Comparison of the CEST with CBF measurement show strong correlation (p<0.005, Spearman Rho=0.976) whereas CEST with T2maps show no correlation (p>0.05).
Intracellular pH also remained unaffected by carbogen and cannot account for the variation in the CEST signal. Hence not the tissue oxygen content nor the intracellular pH are likely to be driving the variations observed in CEST signal during perfusion changes.
However, blood (and possible interstitial) pH has been reported to acidify during carbogen breathing8. It is unclear at this point whether a change in extracellular pH (vascular and interstitial) could be responsible for the changes seen in CEST, via a reduction of the proton exchange rate. If this was the case it could be concluded that CEST signal has a strong extracellular component despite its small fractional volume (~20% of the brain volume).
Alternatively, a different equilibrium of pH buffering ions inside the cell can alter proton exchange rates (with no change in pH) which would manifest as a change in CEST signal.
Conclussion
From the results of the study it is notable that blood perfusion is a strong modulator of the observed CEST signal in the rat brain. The mechanisms by which this coupling occurs are still unknown. However, these results suggest that factors other than 'tissue oxygenation' and 'intracellular pH' must be responsible for the strong correlation between perfusion and CEST measurementsAcknowledgements
No acknowledgement found.References
1. van Zijl PC, Yadav NN. Chemical exchange saturation transfer (CEST): what is in a name and what isn't. Magn Reson Med. 2011;65(4):927-48.
2. Jordan BF, Sonveaux P. Targeting Tumor Perfusion and Oxygenation to Improve the Outcome of Anticancer Therapy. Frontiers in Pharmacology. 2012;3(94).
3.Powell ME, Hill SA, Saunders MI, et al. Human tumour blood flow is enhanced by nicotinamide and carbogen breathing. Cancer Res. 1997;57(23):5261-5264.
4. Kaanders JH, Bussink J, van der Kogel AJ. ARCON: a novel biology-based approach in radiotherapy. Lancet Oncol. 2002;3(12)728-737.
5. Baddeley H, Brodrick PM, Taylor NG, et al. Gas exchange parameters in radiotherapy patients during breathing of 2%, 3.5% and 5% carbogen gas mixtures. The British Journal of Radiology. 2000;73(874):1100-1104.
6. Buxton RB, Frank LR, Wong EC, et al. A General Kinetic Model for Quantitative Perhsion Imaging with Arterial Spin Labeling. Magn Reson Med. 1988;40(3):383-396.
7. Nasrallah FA, Pages G. Kuchel P, et al. Imaging brain deoxyglucose uptake and metabolism by glucoCEST MRI. J Cereb Blood Flow Metab. 2013;33(8):1270–1278.
8. Stubbs DM, Robinson LM, Rodrigues CS, et al. The effects of host carbogen (95% oxygen/5% carbon dioxide) breathing on metabolic characteristics of Morris hepatoma 9618a.M. Br J Cancer. 1998;78(11): 1449–1456.
9. Brizel DM, Lin S, Johnson JL, et al. The mechanisms by which hyperbaric oxygen and carbogen improve tumour oxygenation. British Journal of Cancer. 1995;72(5):1120–1124.
10. Ashkanian M, Borghammer P, Gjedde A, et al. Improvement of brain tissue oxygenation by inhalation of carbogen. Neuroscience. 2008;156(4):32-938.
Figures