0199
B1+ inhomogeneity mitigation in CEST using parallel transmission: pTxCEST1Institute of Neuroscience and Medicine - 4, Forschungszentrum Jülich, Jülich, Germany, 2Faculty of Psychology and Neuroscience, Maastricht University, Maastricht, Netherlands, 3Department of Neurology, Faculty of Medicine, RWTH Aachen University, JARA, Aachen, Germany, 4Department of Electrical and Computer Systems Engineering, and Monash Biomedical Imaging, School of Psychological Sciences, Monash University, Melbourne, Australia
Synopsis
To demonstrate the benefits from the increased spectral bandwidth at ultra-high field (UHF) by using parallel transmission (pTx) to mitigate flip-angle inhomogeneity in chemical exchange saturation transfer (CEST) imaging. A pTx basis pulse is homogenised by magnitude least-squares (MLS) optimisation and expanded to form a frequency-selective saturation pulse for CEST. The pTx saturation pulse was validated by both Bloch-McConnell simulation and in vivo imaging at 7T. Improved homogeneity in contrasts and relaxation-compensated CEST metrics were observed in our in vivo data when the pTx saturation pulse was used instead of the standard CP-mode Gaussian pulse.
Purpose
To demonstrate the benefits from the increased spectral bandwidth at ultra-high field (UHF) by using parallel transmission (pTx) to mitigate flip-angle inhomogeneity in chemical exchange saturation transfer (CEST) imaging.Methods
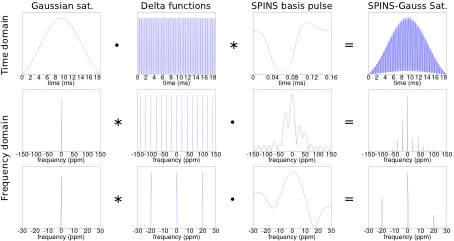
Flip-angle homogenised pTx basis pulse designed by magnitude least-squares (MLS) optimisation1,2,3 was expanded to form a frequency-selective pulse for CEST in a two-step process (Fig. 1). The saturation pulse was simulated with a three-pool Bloch-McConnell equation to evaluate its CEST contrast properties4. Experiments were performed on a 7T whole-body MR scanner (MAGNETOM, Siemens Healthineers, Erlangen, Germany) with an 8-channel transmit/32-channel receive head coil (Nova Medical, Wilmington, MA, USA). B0 and B1+ maps for pulse optimisation were obtained from a dual-echo 3D GRE and a transmit phase-encoded5, T2 and T2* compensated version of DREAM6, respectively. PreSat-TFL7 was used to map the flip-angle of the designed pulses8. In vivo CEST imaging performance of the pTx saturation pulse (pTxCEST) and the standard Gaussian saturation in CP-mode were compared. 2-spokes pTx homogeneous excitation was used to ensure fair comparison of the two saturation pulses9. A 2D GRE (single-shot centric-acquisition, TE=4.39ms, TR=9.2ms, matrix size = 80×80, flip-angle=10˚, slice-thickness=6.5mm) with a train of 120 saturation pulses (50% duty-cycle) was used as the CEST imaging sequence. Z-spectra were sampled from -300 to 300ppm at 69 unevenly distributed points using an effective power of 0.6µT 10. Magnetisation transfer ratio and inverse Z-spectrum analyses were used as metrics in evaluating the data from three healthy volunteers11.Results
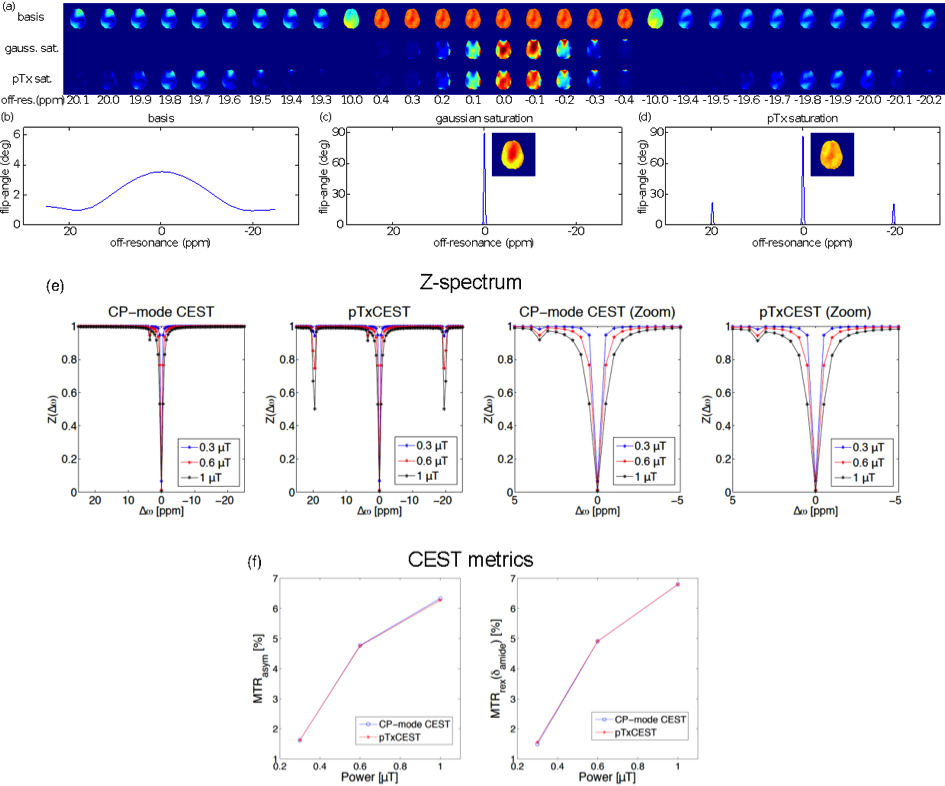
The results of Bloch
simulations of the two saturation pulses, CP-mode CEST and pTxCEST, as well as
the pTx basis pulse are presented in Fig. 2(a-d). Small side bands at ± 20 ppm
can be seen in the pTxCEST saturation. The inserts in Fig. 2 (c) and (d) are the
spatial distribution of the normalised flip-angle integrated over the central
peak (± 0.5 ppm), which show a more spatially homogeneous saturation provided
by the pTxCEST (NRMSE 0.042) in comparison to the CP-mode CEST pulse (NRMSE
0.122). Bloch-McConnell simulations (Fig. 2e-f) showed that side bands of the
pTx saturation pulse at ± 20 ppm did not affect any CEST contrast. The B0
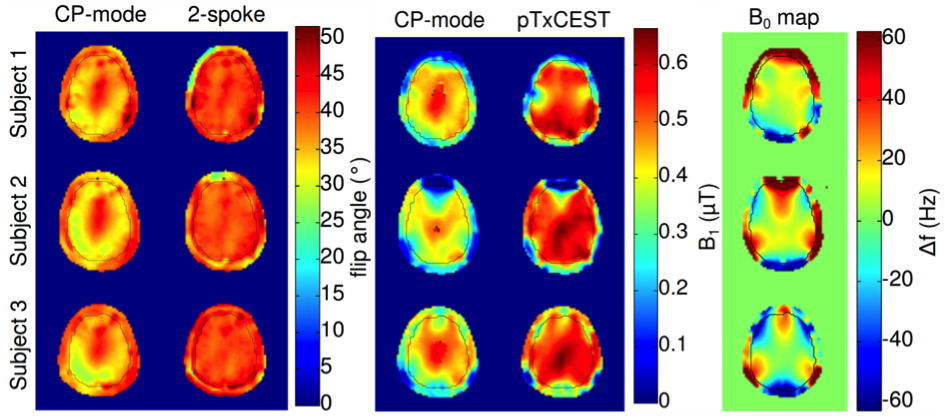
off-resonance maps, the PreSat-TFL flip-angle maps of the CP-mode and 2-spokes
excitations, as well as the CP-mode CEST and pTxCEST saturations at the
position of the CEST imaging slice from three healthy volunteers are presented
in Fig. 3. The average excitation NRMSE across the three volunteers reduced
from 0.11 (CP-mode) to 0.05 (2-spokes). The CP-mode CEST saturation pulse only
reached the desired 0.6 μT effective B1+ power in the
central brightening spot, while the pTxCEST pulse managed to homogeneously
deliver the desired saturation power across the entire brain region within the
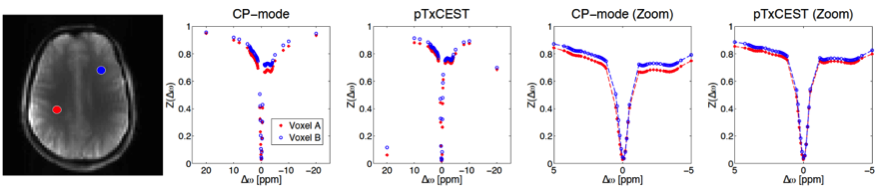
imaging slice. Fig. 4 shows the Z-spectra from both CP-mode CEST and pTxCEST
saturations from two different locations in white matter. The spectra from
CP-mode CEST saturation display noticeable differences, caused by the B1+
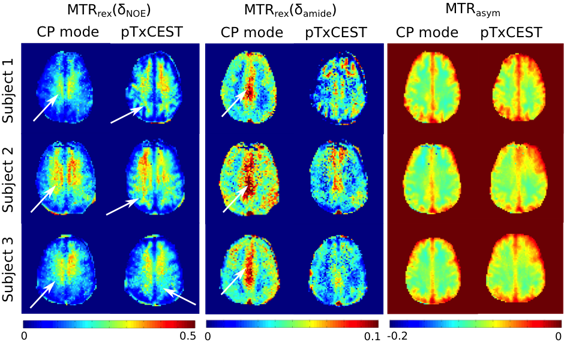
inhomogeneity. CEST parametric maps are presented in Fig. 5. Undesired contrast
variations, e.g. due to B1+ inhomogeneity rather than
tissue difference, can be observed in the maps acquired with the CP-mode CEST
saturation, but not in those with the pTxCEST saturation.Discussion
This work presents a method to design a parallel-transmit saturation pulse for CEST to mitigate undesired contrast variations caused by the B1+ inhomogeneity at UHF. The homogeneous pTxCEST saturation pulse was evaluated by simulations as well as in vivo human brain imaging at 7T. The pTxCEST saturation was designed in two steps which combine the benefits of the spatially homogenised flip from the pTx basis pulse with the frequency selectivity of a Gaussian pulse, a typical choice for saturation in CEST experiments. While the pTx saturation preserves the bandwidth of the Gaussian envelope, it creates side bands as shown in Figs. 1-2. This leaves a usable range of ± 10 ppm, which exceeds the typical saturation range in CEST experiments using MTRasym and hence poses no practical constraints. Furthermore, no influence in CEST contrasts was found in the Bloch-McConnell simulations (Fig. 2). Both Bloch simulations (Fig. 2) and in vivo mapping (Fig. 3) show that pTxCEST provided spatially more homogeneous saturation than CP-mode, which translated into more reliable CEST contrast. This is indicated by the reduced variability in the white matter Z-spectra between ± 5 ppm (Fig. 4) when pTxCEST saturation was used. Also, the same improvements can be seen in the CEST parametric maps (Fig. 5).Conclusion
A pTx-based pulsed CEST pre-saturation scheme is proposed and validated by simulations and 7T in vivo imaging.Acknowledgements
We thank Christopher Wiggins for the helps on various technical issues at the scanner. Scan hours were funded under Scannexus/Brains Unlimited development project dev_b0_b1 and intramural MBIC funding projects (F8000C09 and F8015). NJS is funded in part by the Helmholtz Alliance ICEMED - Imaging and Curing Environmental Metabolic Diseases, through the Initiative and Network Fund of the Helmholtz Association. Further, NJS is supported in part by TRIMAGE, an EU FP7 project (grant agreement n° 602621)References
1. Setsompop K, Wald LL, Alagappan V, Gagoski BA, Adalsteinsson E. Magnitude least squares optimization for parallel radio frequency excitation design demonstrated at 7 Tesla with eight channels. Magn Reson Med 2008; 59 (4):908-915
2. Grissom W, Yip C-y, Zhang Z, Stenger VA, Fessler JA, Noll DC. Spatial domain method for the design of RF pulses in multicoil parallel excitation. Magn Reson Med 2006; 56 (3):620-629
3. Sbrizzi A, Hoogduin H, Lagendijk JJ, Luijten P, Sleijpen GLG, van den Berg CAT. Time efficient design of multi dimensional RF pulses: Application of a multi shift CGLS algorithm. Magn Reson Med 2011; 66 (3):879-885
4. Jones CK, Polders D, Hua J, Zhu H, Hoogduin HJ, Zhou J, Luijten P, van Zijl PCM. In Vivo 3D Whole-Brain Pulsed Steady State Chemical Exchange Saturation Transfer at 7T. Magn Reson Med 2012; 67 (6):1579-1589
5. Tse DHY, Poole MS, Magill AW, Felder J, Brenner D, Shah NJ. Encoding methods for mapping in parallel transmit systems at ultra high field. J Magn Reson 2014; 245:125-132
6. Nehrke K, Versluis MJ, Webb A, Bornert P. Volumetric B1 (+) mapping of the brain at 7T using DREAM. Magn Reson Med 2014; 71 (1):246-256
7. Chung S, Kim D, Breton E, Axel L.Rapid B1+ mapping using a preconditioning RF pulse with TurboFLASH readout. Magn Reson Med 2010; 64 (2):439-446
8. Tse DHY, Wiggins CJ, Ivanov D, Brenner D, Hoffmann J, Mirkes C, Shajan G, Scheffler K, Uludag K, Poser BA. Volumetric imaging with homogenised excitation and static field at 9.4 T. Magn Reson Mater Phy 2016; 29 (3):333-345
9. Tse DHY, Wiggins CJ, Poser BA. High-resolution gradient-recalled echo imaging at 9.4T using 16-channel parallel transmit simultaneous multislice spokes excitations with slice-by-slice flip angle homogenization. Magn Reson Med 2016; 10.1002/mrm.26501
10. Zu Z, Li K, Janve VA, Does MD, Gochberg DF. Optimizing pulsed-chemical exchange saturation transfer imaging sequences. Magn Reson Med 2011; 66 (4):1100-1108
11. Windschuh J, Zaiss M, Meissner JE, Paech D, Radbruch A, Ladd ME, Bachert P. Correction of B1-inhomogeneities for relaxation-compensated CEST imaging at 7T. NMR Biomed 2015; 28:529-537
12. Malik SJ, Keihaninejad S, Hammers A, Hajnal JV. Tailored excitation in 3D with spiral nonselective (SPINS) RF pulses. Magn Reson Med 67 2012; (5):1303-1315
13. Zhou J, Lal B, Wilson DA, Laterra J, Zijl PCMv. Amide proton transfer (APT) contrast for imaging of brain tumors. Magn Reson Med 2003; 50:1120-1126
14. Xu J, Zaiss M, Zu Z, Li H, Xie J, Gochberg DF, Bachert P, Gore JC. On the origins of chemical exchange saturation transfer (CEST) contrast in tumors at 9.4T. NMR Biomed 2014; 27 (4):406-416
15. Zaiss M, Bachert P. Exchange-dependent relaxation in the rotating frame for slow and intermediate exchange modelling off-resonant spin-lock and chemical exchange saturation transfer. NMR Biomed 2013; 26 (5):507-518
Figures