0198
Measuring APT contrast in the lung using CEST FT-phase MRI and a retrospective gating technique1Biomedical Engineering, University of Arizona, Tucson, AZ, United States, 2Medical Imaging, University of Arizona, Tucson, AZ, United States, 3Medicine, University of Arizona, Tucson, AZ, United States
Synopsis
We have developed a CEST FT-phase MRI method that can measure endogenous Amide Proton Transfer (APT) contrast in lung tumors and other tissues that are affected by lung motion. The method monitors the breathing cycle based on the relative phase angle between adjacent pixels, and selects a subset of images during the quiescent period between breaths. The resulting MTRasym contrast of an oscillating egg white phantom, volunteers, and patients with lung tumors showed that CEST FT-phase MRI produced more precise quantitative assessments of APT.
Purpose
Tumor tissues typically have higher Amide Proton Transfer (APT) contrast compared to normal tissue,1 and APT signal correlates with tumor grade.2,3 Thus, measuring APT contrast in tumor tissue could be used to grade tumors. A noninvasive test that differentiates lung tumor grade would reduce the need for an invasive needle biopsy or lung cancer resection. An acquisition and analysis method that avoids complications from respiratory motion is desired to generate high quality results in the lung in free-breathing patients. We have employed retrospective gating to develop a novel respiratory compensated CEST technique called CEST Fourier transform (FT)-phase MRI.Methods
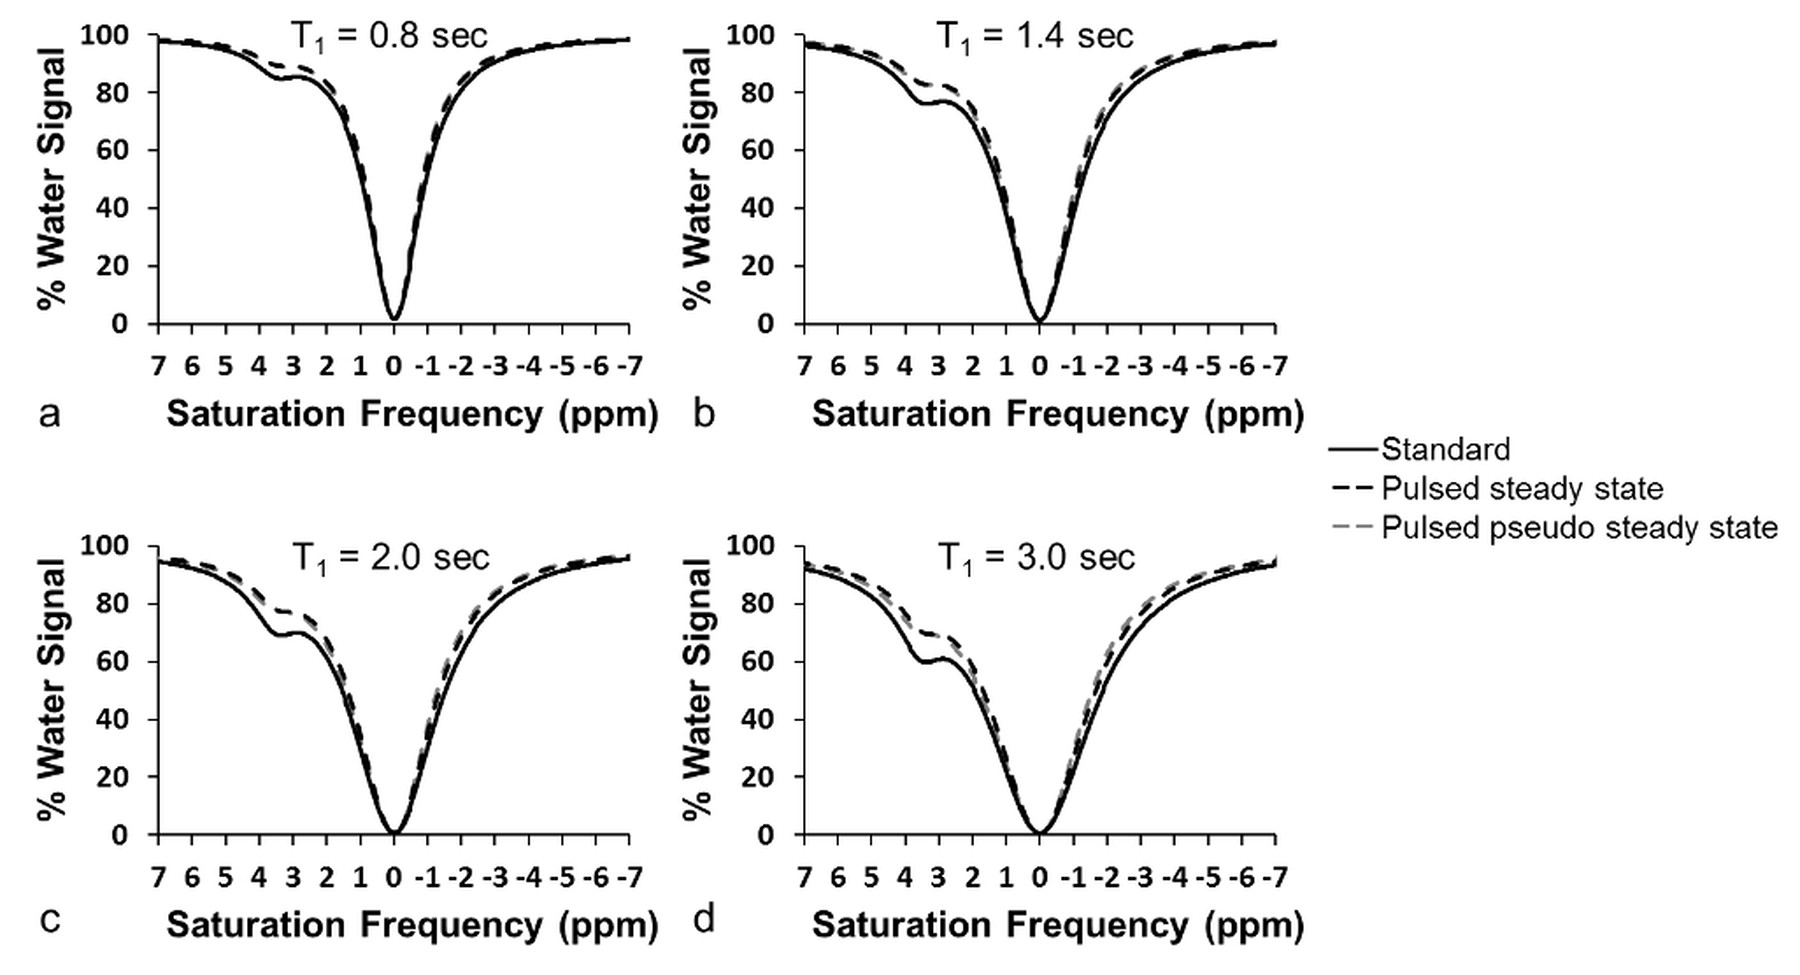
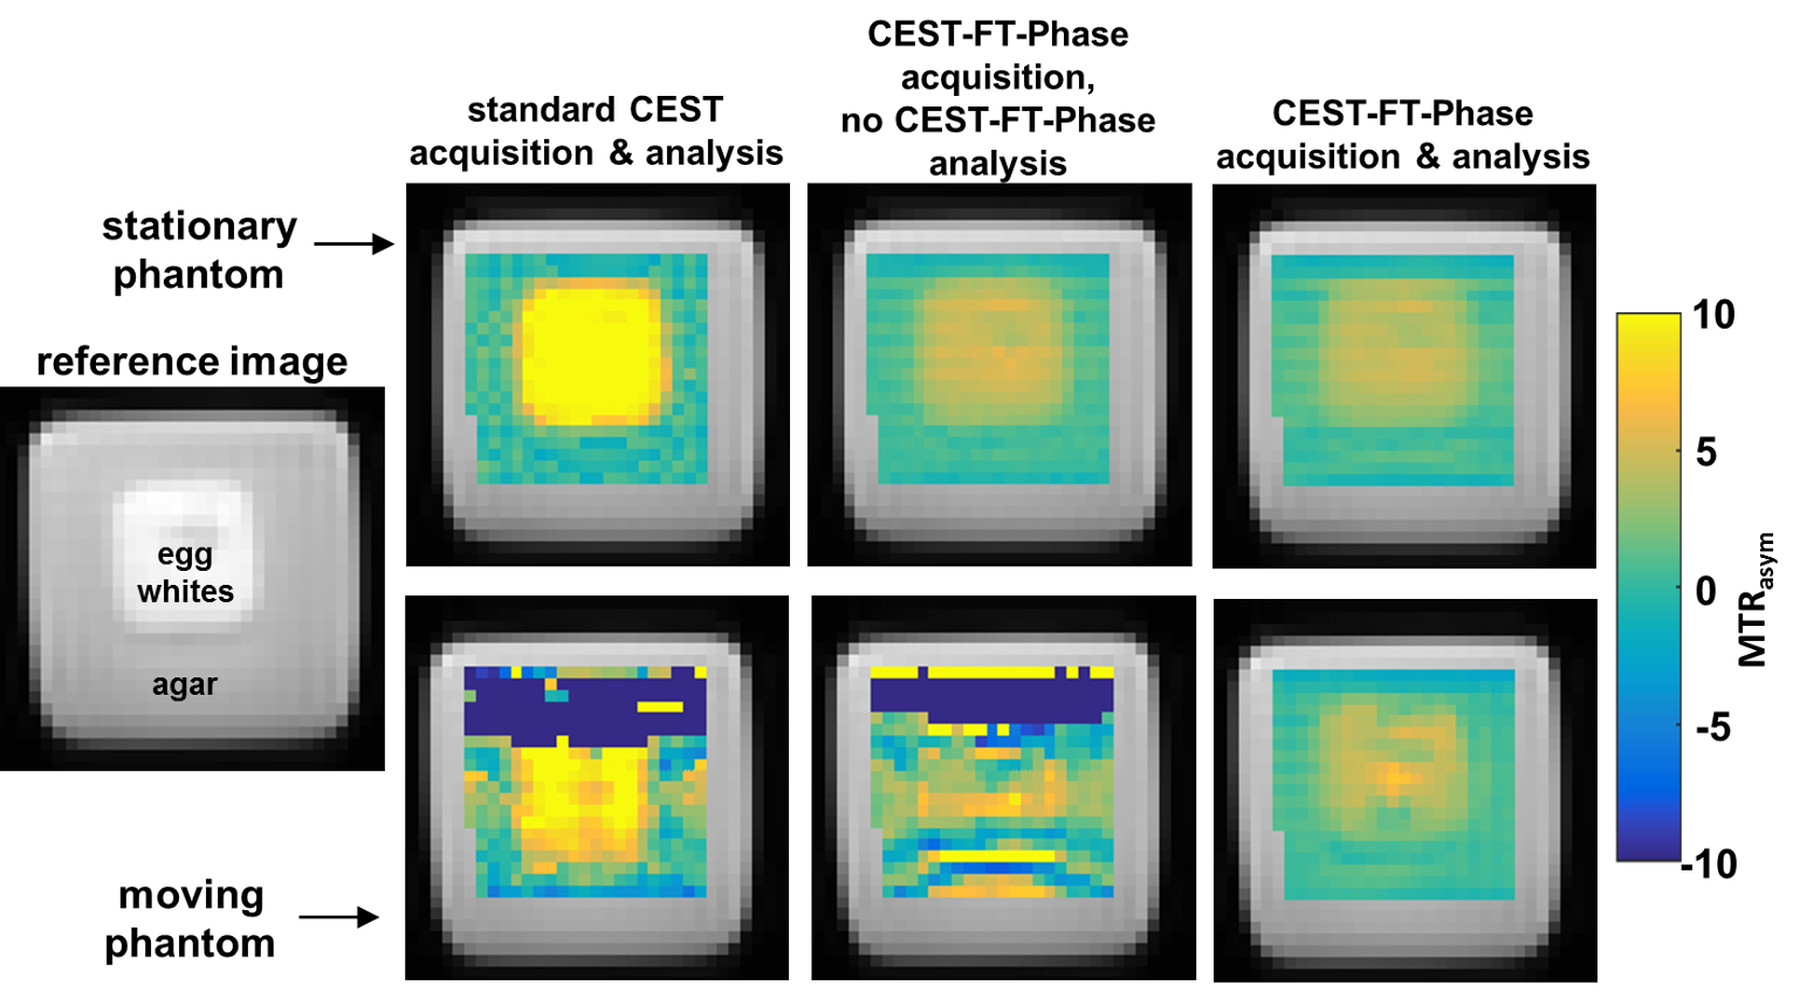
We shortened the APT saturation pulse to 200 msec to adequately sample stages of a normal breathing cycle. We shortened the interval between saturation frequencies to 0.1 ppm so that saturation frequencies next to the saturation frequency being irradiated would be partially saturated. We hypothesized that the CEST spectrum from our pseudo-steady-state CEST FT-phase method would be similar to a standard CEST spectrum acquired with longer steady state saturation, except for the first few saturation points. We performed simulations using the Bloch equations modified for chemical exchange to evaluate this approach, using a range of T1 relaxation times characteristic of human tissues. We tested a phantom of egg whites in a customized motion device that was moved 3 cm/sec, moved back to the original location, paused for 3 sec, and repeated to simulate breathing motion. We also tested a stationary phantom. Three healthy volunteers and three patients diagnosed with lung cancer were scanned using the same CEST FT-phase method. We acquired images with an CEST FT-phase MRI protocol with steady state saturation using a 3 sec saturation at 1 µT and data points from -7 ppm to +7 ppm in 0.2 ppm units, using FISP to acquire each image. Then a CEST-FT phase MRI protocol with pseudo-steady-state saturation was acquired with a 200 msec saturation at 1 µT and data points from -7 ppm to +7 ppm in 0.03 ppm units.
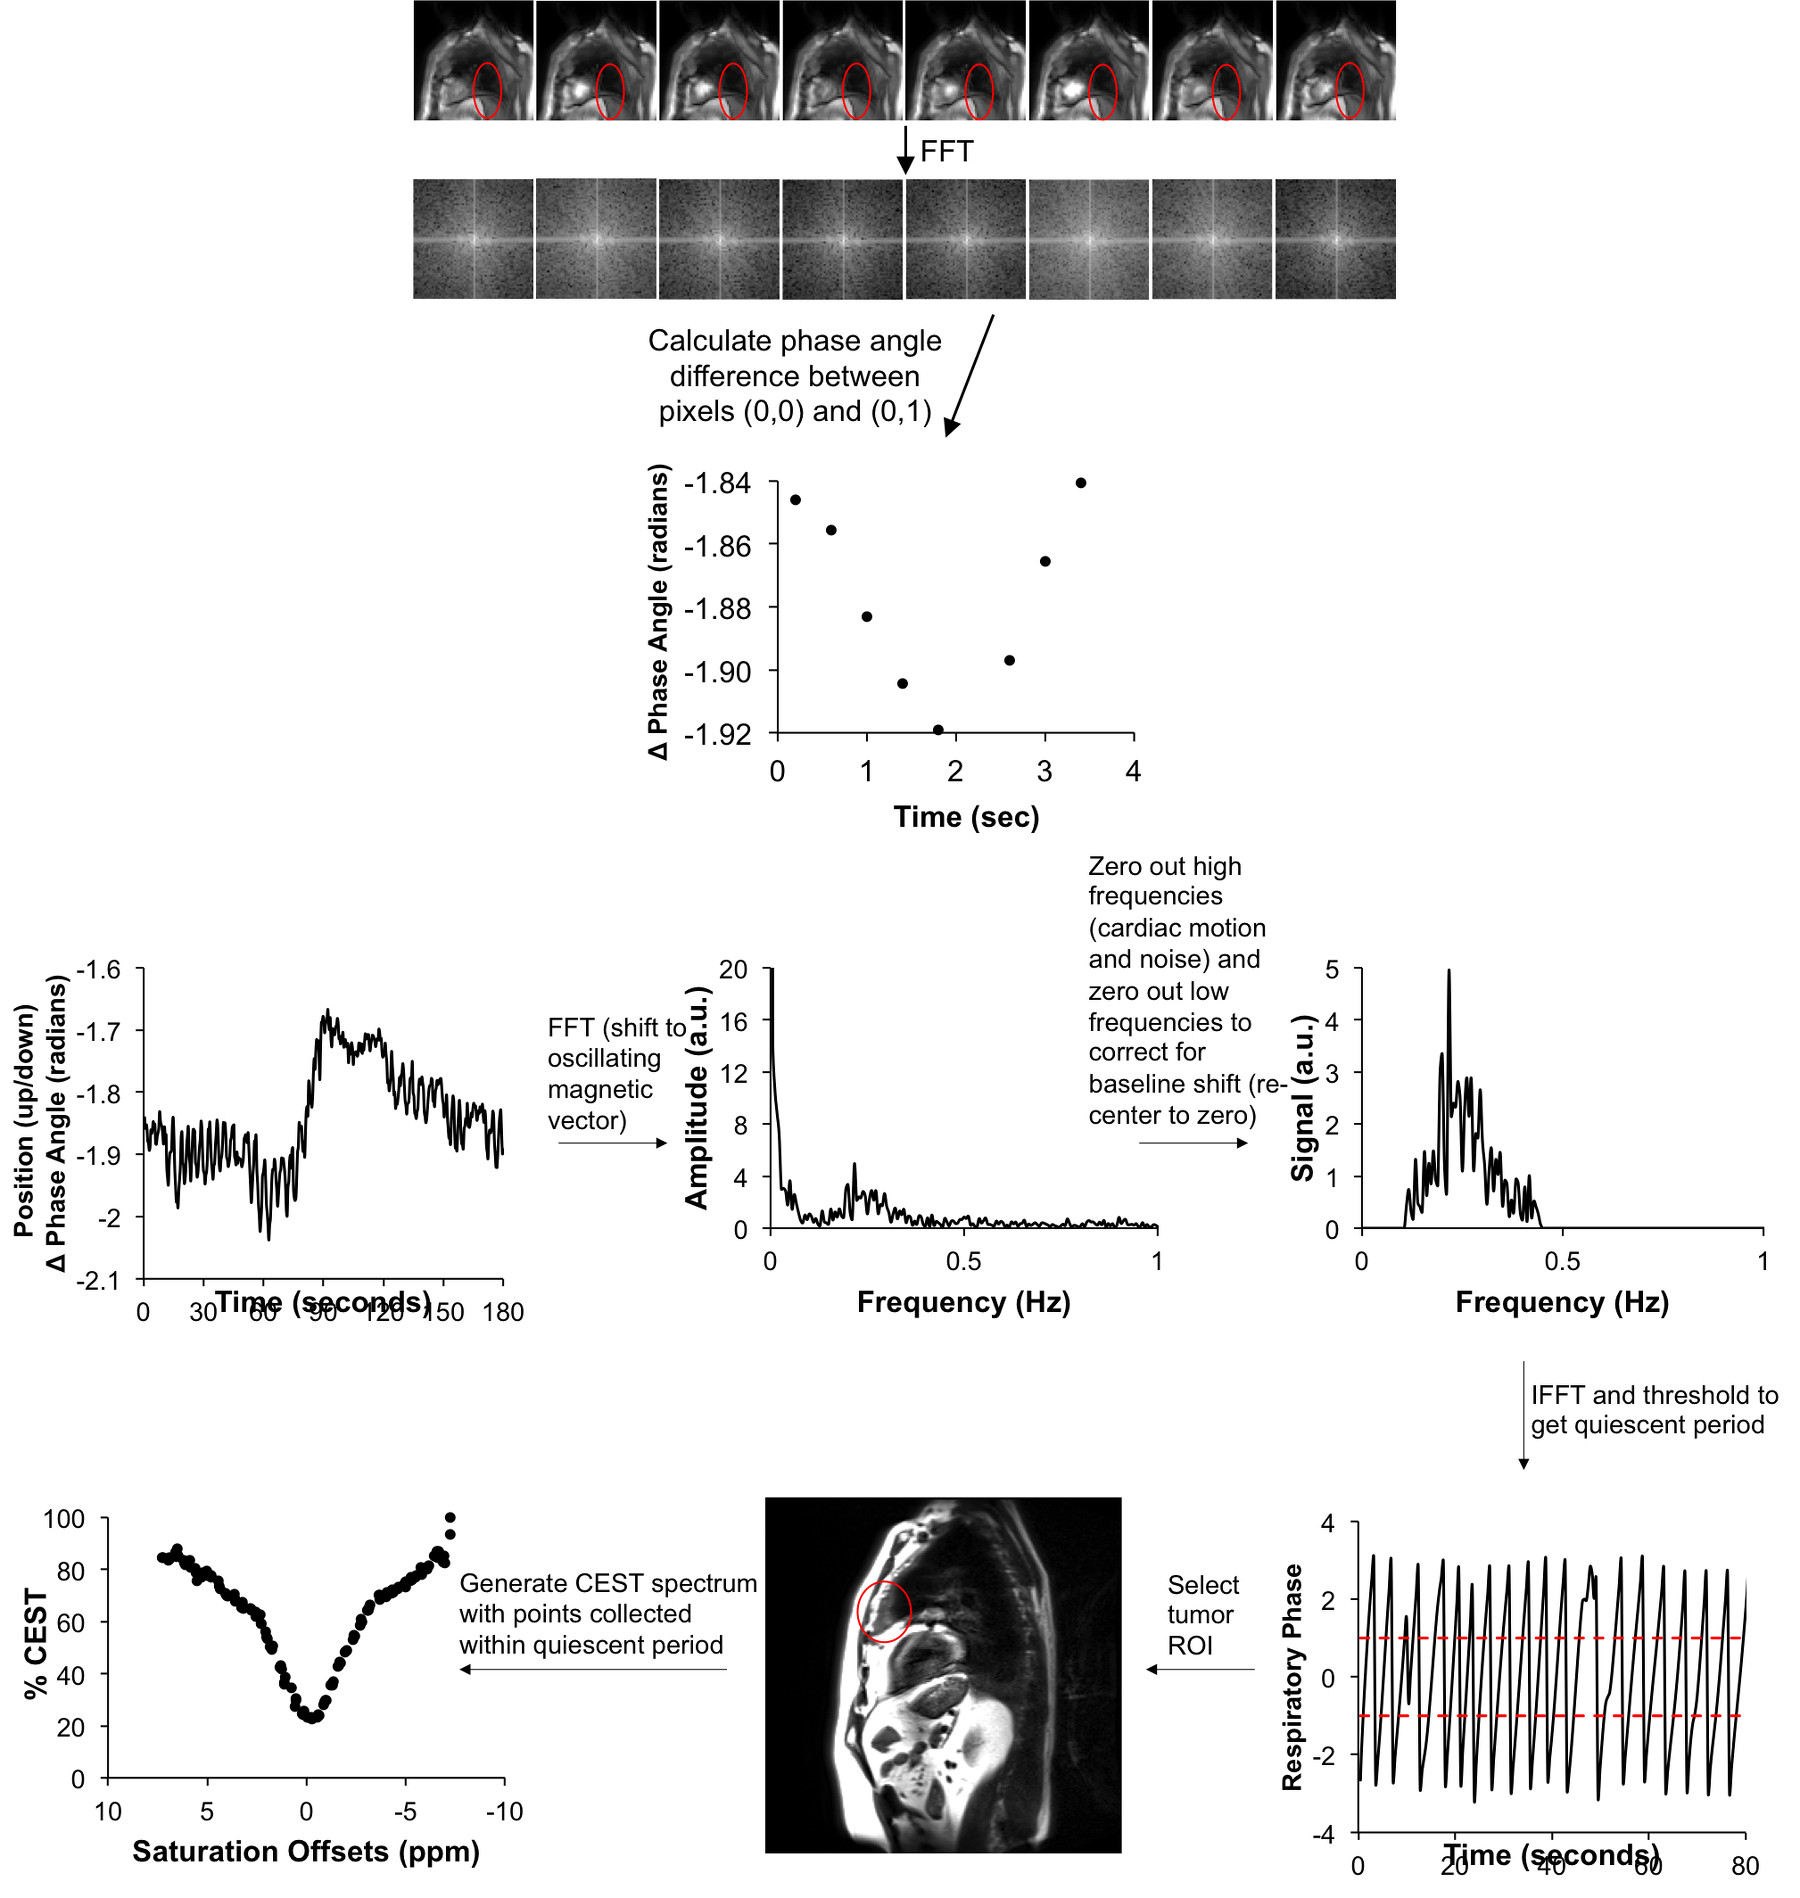
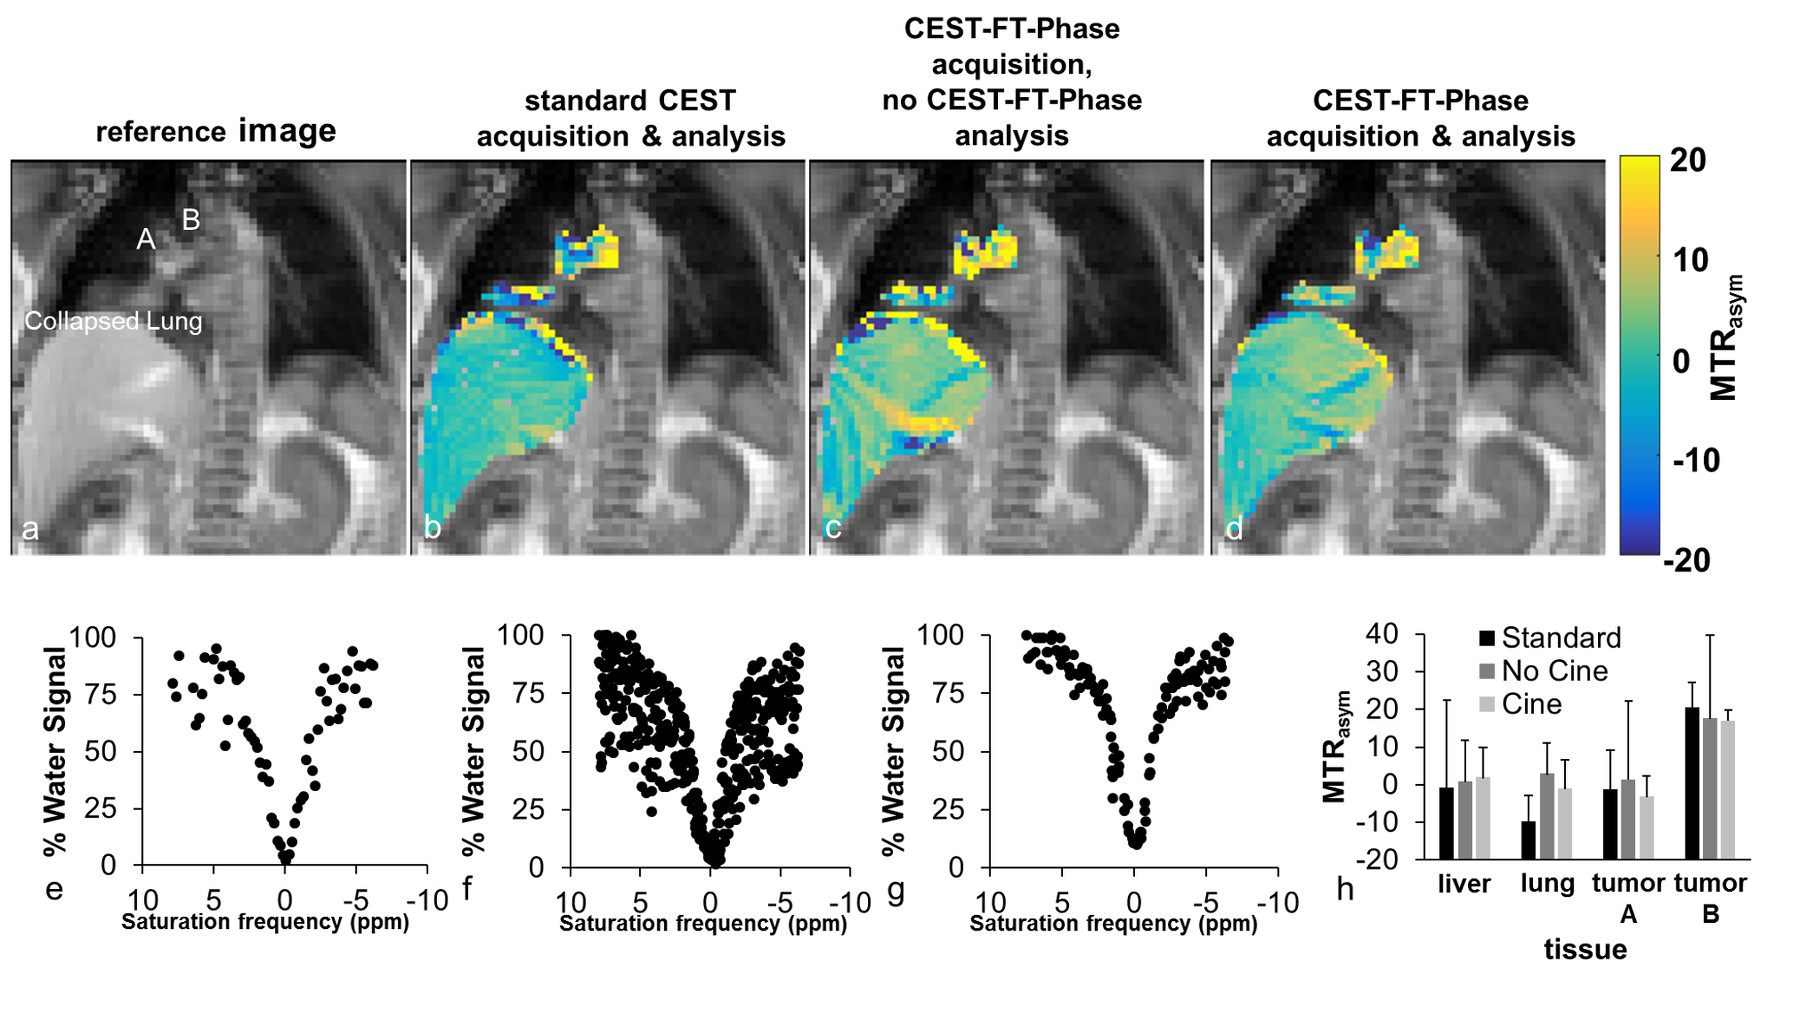
We segmented the temporal series of CEST spectra based on the quiescent period of the breathing cycle (Figure 1). To obtain the breathing cycle, we selected a Region of Interest (ROI) around the liver dome, applied a Fourier transform to the ROI, determined the phase angle difference between the pixel directly above the center of k-space and the center k-space pixel, and applied a series of digital filtering techniques to refine the monitored respiratory cycle. We retained all CEST FT-phase images with a phase angle within one radian of the center of the quiescent period, which corresponded to ~30% of the images. Each CEST spectrum was fit with a single Lorentzian line shape conducive to the spectral shape for direct water saturation to correct for B0 inhomogeneity. Then MTRasym was determined from the final CEST spectrum for each pixel.
Results
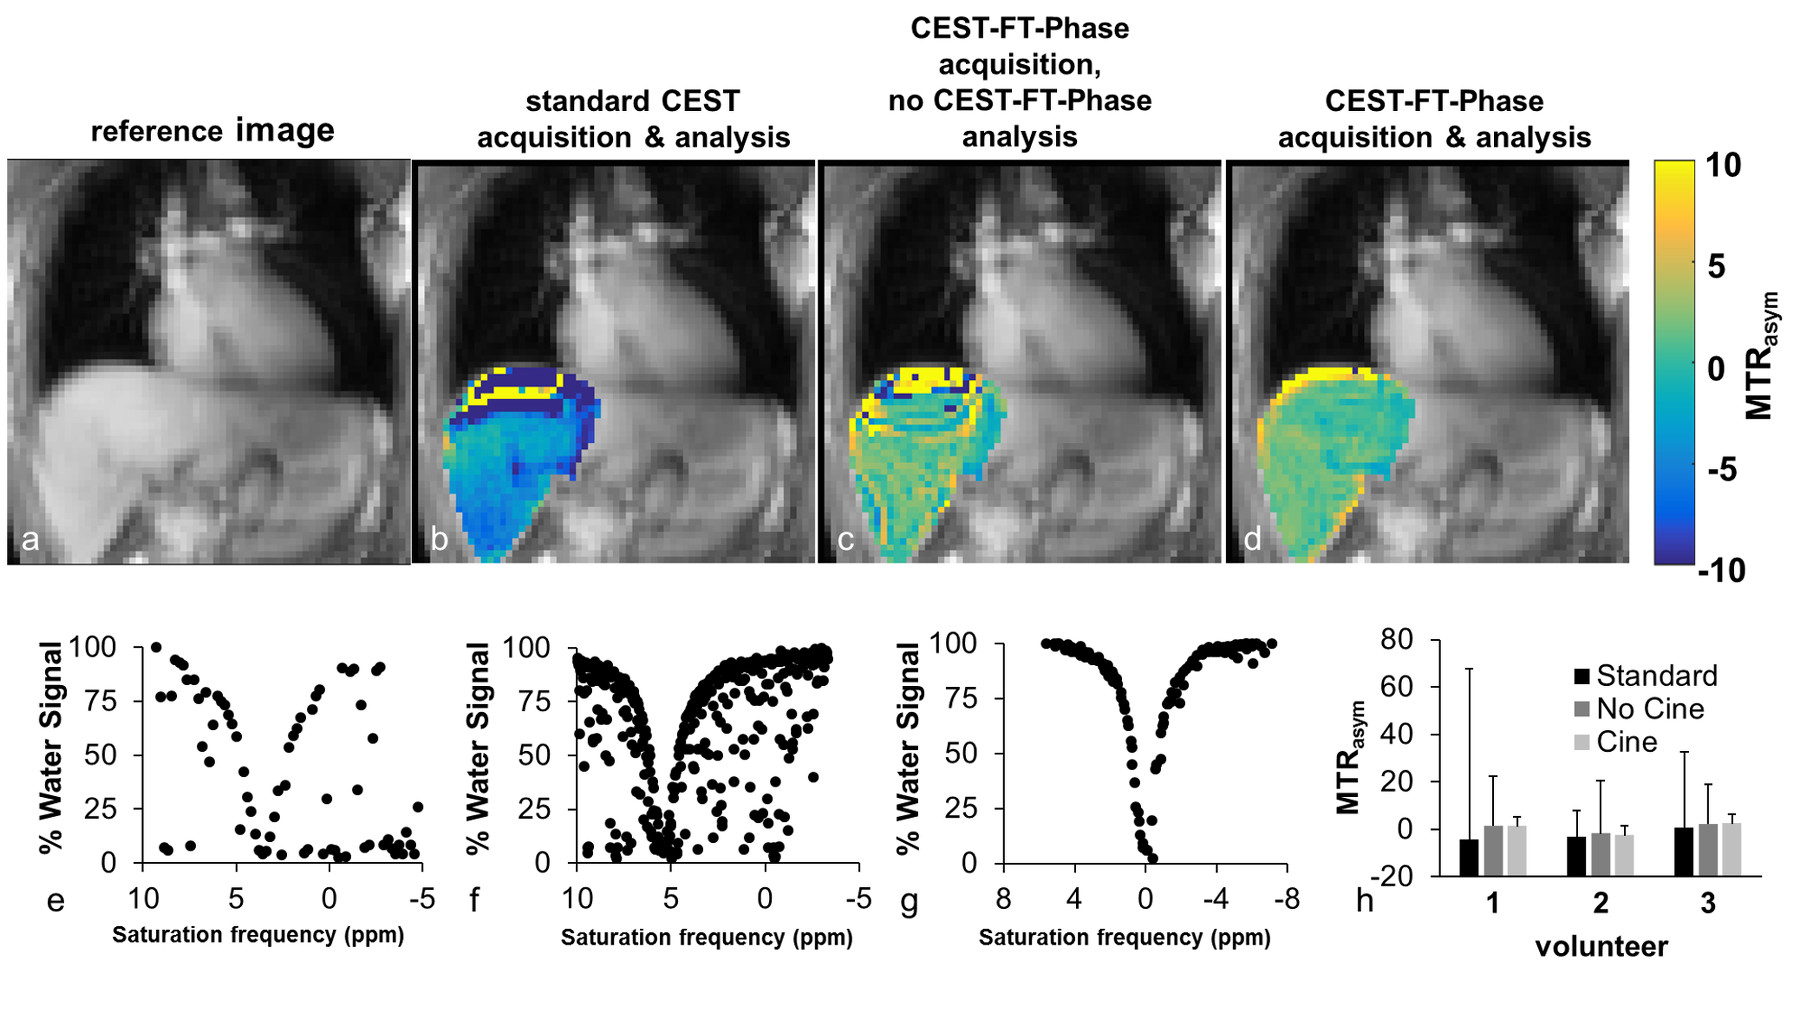
The simulated CEST spectrum constructed with the pseudo pulsed steady state saturation scheme was identical to the simulated CEST spectrum constructed with a steady state saturation scheme at all T1 times tested (Figure 2). A shorter saturation time produced less APT signal than a longer saturation time, as expected. Our moving phantom studies showed that the CEST FT-phase acquisition and analysis generated more accurate and precise MTRasym contrast values (using the stationary phantom as the gold standard) compared to the standard CEST acquisition and the CEST FT-phase acquisition without post processing (Figure 3). Our clinical studies showed that the CEST FT-phase acquisition and analysis method produced more precise MTRasym values compared to the standard CEST acquisition and the CEST FT-phase acquisition without post processing (Figures 4 and 5). This improvement in MTRasym measurements was observed for the liver of healthy subjects as well as the tumor, collapsed lung tissue, and liver of patients diagnosed with lung cancer. Lung tumors subject to lung motion were measured with more precision using CEST FT-phase whereas tumors that experienced only minor lung motion showed comparable results with all acquisition methods.Discussion
We have established a protocol for performing retrospective gating of lung imaging using CEST MRI in a clinically relevant timeframe of 3 minutes. The data quality was comparable to previously reported results.3,4 Because we are acquiring a full Z-spectra, more rigorous and quantitative fitting techniques can be used such as fitting CEST spectra with Lorentzian line shape,5 fitting with the Bloch equations,5 or approximations to the Bloch equations.6,7Acknowledgements
No acknowledgement found.References
1. Zhou J, et al. Nat Med 2003;9:1085-1090.
2. Zhou J, et al. J Magn Reson Imaging 2013;38:1119-1128.
3. Togao O, et al. Neuro-Oncol 2014; 16:441-448.
4. Cai J, et al. Phys Med Biol. 2007;52:365-373.
5. Chappell MA, et al. Magnetic Reson Med 2013;7:556-567.
6. Zaiss M, Bachert P. NMR in Biomed 2013;26:5-7-518.
7. Zaiss M, et al. NMR in Biomed 2015;28:217-230.
Figures