0197
CEST Fingerprinting: A Novel Approach for Exchange Rate Quantification1Biomedical Imaging Research Institute, Cedars-Sinai Medical Center, Los Angeles, CA, United States, 2Department of Bioengineering, University of California, Los Angeles, Los Angeles, CA, United States, 3Department of Engineering Physics, Tsinghua University, Beijing, People's Republic of China
Synopsis
In this work, we developed a CEST fingerprinting technique for exchange rate quantification. This method utilizes CEST saturation with varying B1 amplitudes and durations to create uniqueness of signal evolution for different exchange rates. The acquired signal was matched to a predefined dictionary. Preliminary studies were performed in phantoms to show the feasibility.
Introduction
There are increasing interests to determine the exchange rate using CEST MRI to estimate pH. Current methods fit the CEST signal acquired with different B1 amplitudes to the steady-state analytical solution of Bloch-McConnell equation1,2. Long CEST saturation time is required to achieve steady state of the CEST signal and very long TR is needed for the signal to fully recover to equilibrium, resulting in long scan time, which hinders the clinical application of these methods.
MR Fingerprinting is a new method for simultaneous multi-parametric mapping3. Instead of using repeated, serial acquisitions of data to fit to a particular equation, it uses a pseudorandomized acquisition that creates unique signal evolutions for different tissue properties and matches that signal to a predefined dictionary. Applying this concept to CEST quantification, the acquired signal can be matched to a simulated dictionary instead of fitting to the analytical solution. This can eliminate the need for long CEST saturation time and long TR.
In this work, we developed a CEST fingerprinting technique for exchange rate quantification. This method utilizes CEST saturation with varying B1 amplitudes and durations to create uniqueness of signal evolution for different exchange rates. Preliminary studies were performed in phantoms.
Methods
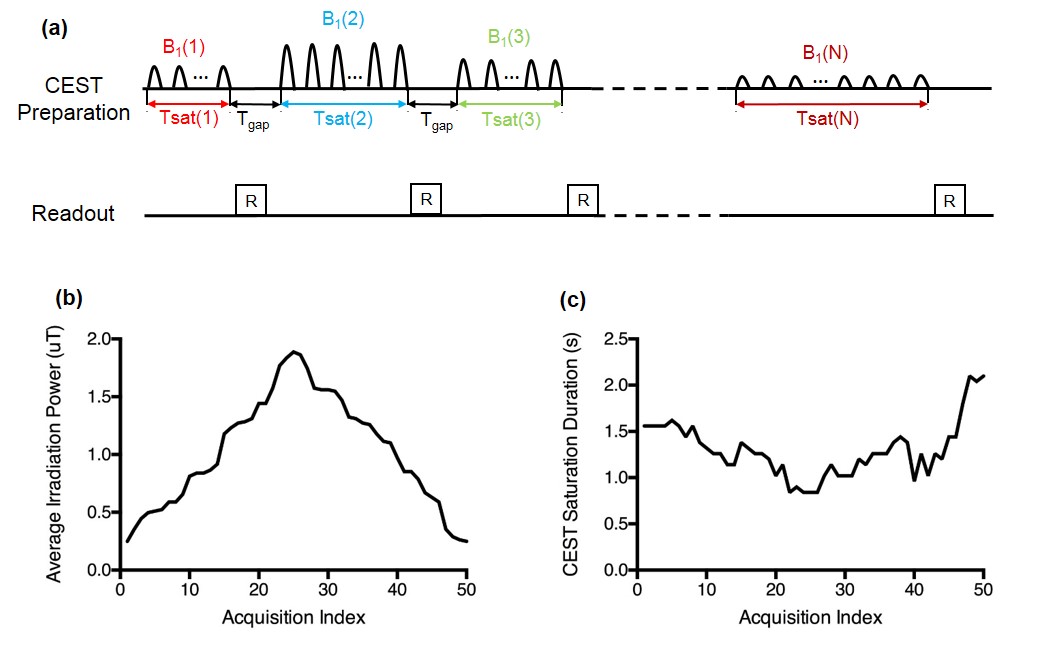
Sequence design: To show the generality of CEST fingerprinting, this study was performed on a 3T clinical scanner with Gaussian-shaped CEST saturation pulses. Fig. 1a illustrates the acquisition sequence diagram of CEST fingerprinting. In each subsequent acquisition block, RF irradiation power and duration of the CEST preparation module are varied in a pseudorandom pattern. The readout is performed in the gap between acquisition blocks and the gap time is fixed.
Dictionary design: A separate scan was conducted to measure T1 and T2. With known T1 and T2 values, dictionary was simulated using two-pool Bloch-McConnell model. A total of 600 signal time courses, each with 50 time points, with different exchange rates from 10 s-1 to 500 s-1 were simulated for the dictionary for each T1, T2 combination. Each dictionary entry was defined as the difference between the reference signal evolution simulated without the presence of CEST effects and the label signal evolution simulated with corresponding exchange rate. Similar to the regular CEST analysis, this difference indicates how much water signal loss is caused by CEST effects.
For each pixel, one dictionary entry that has highest vector dot-product with the measured signal was selected. In this case, the labile proton fraction ratio fr (the ratio of solute protons over water protons) is just a multiplicative constant which will not affect the matching result.
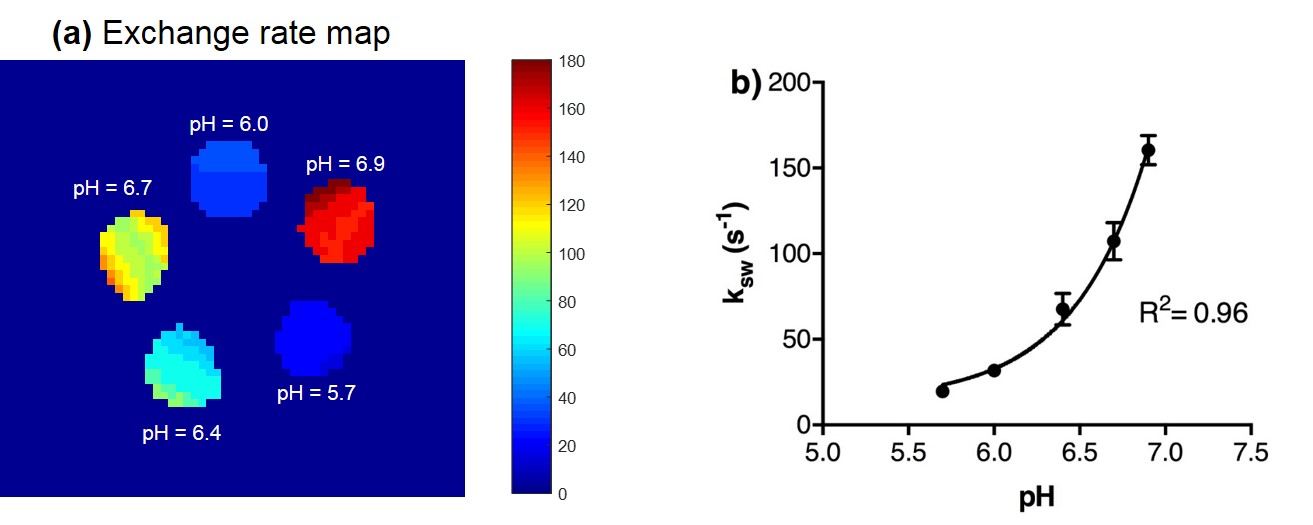
Phantom study: Phantom experiments were performed at room temperature on a 3T clinical scanner (Verio; Siemens Healthcare) with a standard 32-channel head receiver coil. Five 40-mL PBS phantoms were prepared containing creatine with concentration 60 mM. The pH was adjusted to 5.7, 6.0, 6.4, 6.7, 6.9. CEST fingerprinting scan was performed as shown in Fig.1 with EPI readout (FOV: 125x125 mm2; matrix size: 64x64; resolution: 2.0x2.0 mm2; parallel imaging acceleration factor: 3; flip angle: 45°; gap time: 300 ms). Fig 1b and 1c represent the RF irradiation power B1 (from 0.25 uT to 2 uT) and the total CEST saturation time (from 0.8s to 2.1s), respectively. CEST preparation module consists of 30 ms Gaussian saturation pulses (flip angle ranging from 200° to 1500°) with 50% duty cycle. The scan was repeated at five different CEST saturation frequency offsets: +2.6 ppm, +2.3 ppm, +2.0 ppm, +1.7 ppm and +1.4 ppm. Total scan time is 7.5 min. B0 field was corrected using WASSR method. T1 mapping was acquired by IR TSE with varying TI and T2 mapping was acquired by TSE with varying TE. The dictionary matching was performed pixel-by-pixel based on the T1 and T2 measured separately.
Results
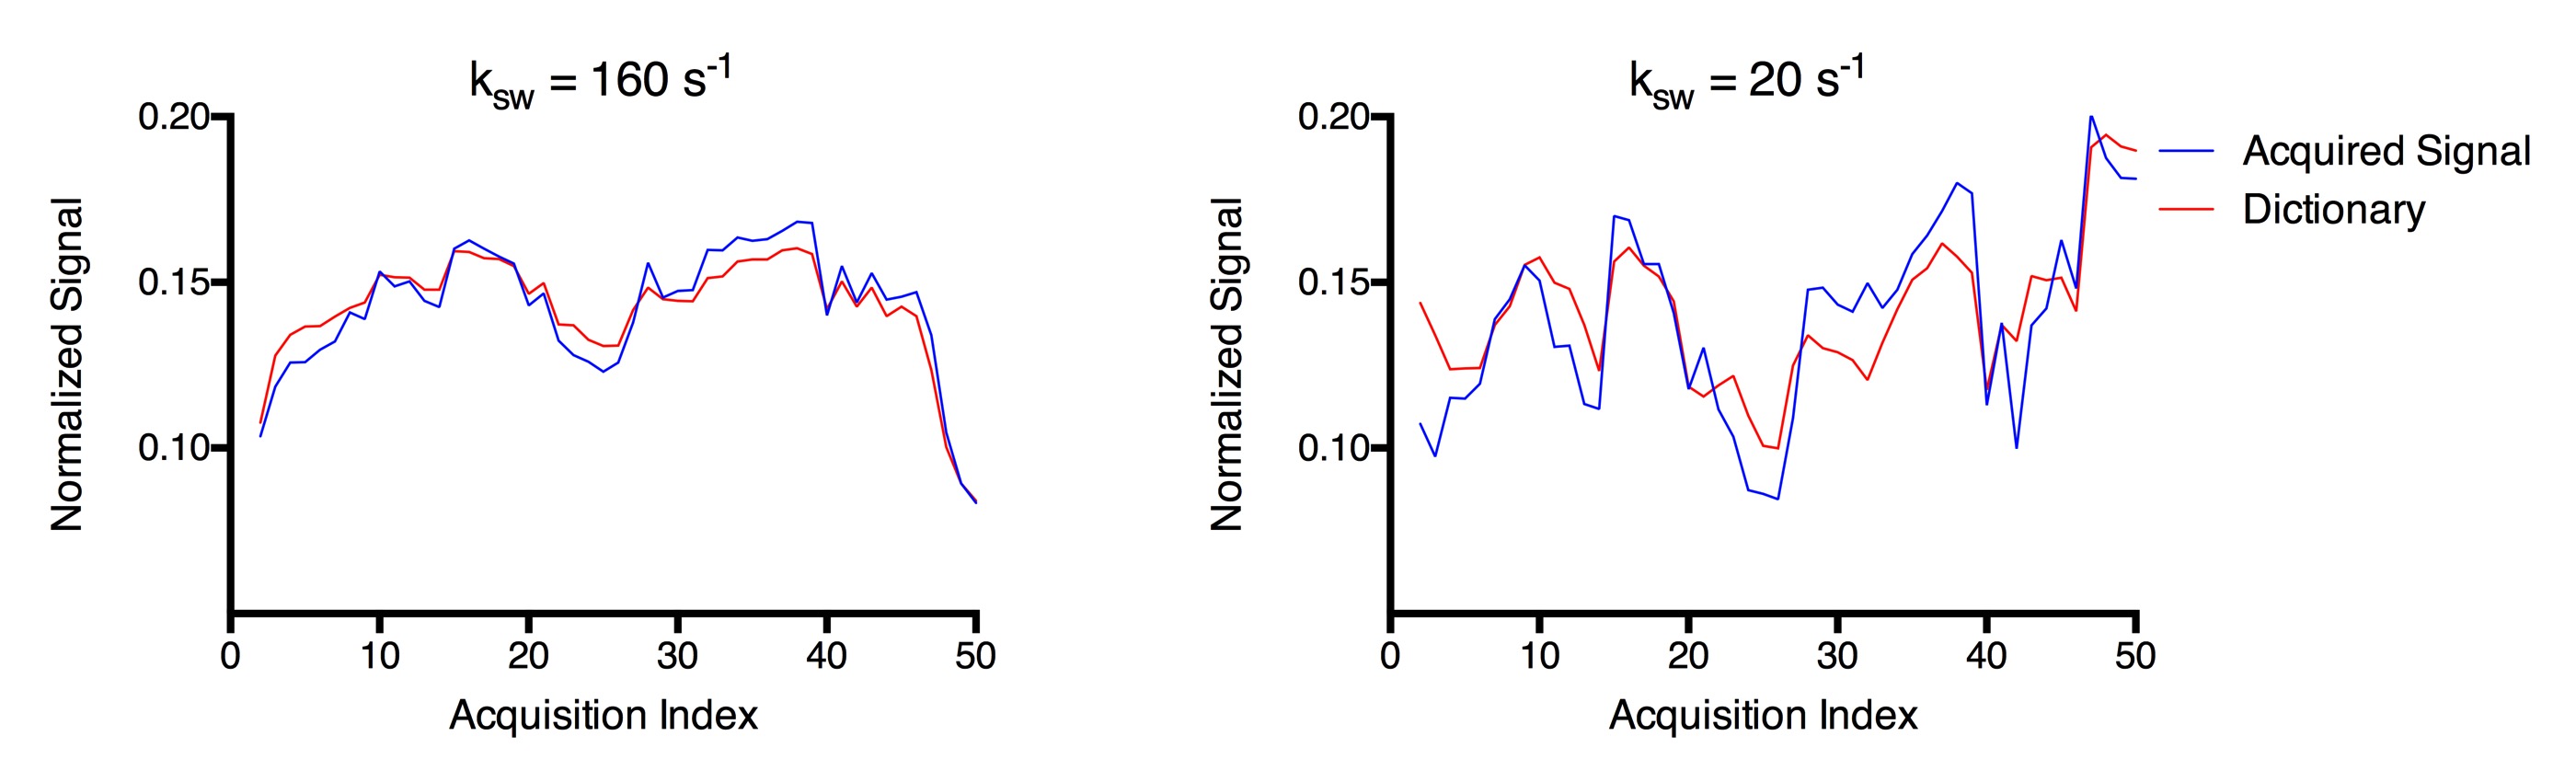
Fig. 2 shows representative signal evolution curves acquired in phantoms with different pH values and the corresponding matching dictionary entries. The signal evolutions of different pH values have different shapes and can be differentiated from each other.
The pixel-wise exchange rate map was presented in Fig. 3a. Quantitatively, the exchange rate can be described as ksw = 1.59 x 10pH-5 + 14.13, R2 = 0.96 (shown in Fig. 3b). This is consistent with previous finding.
Conclusion
In this work, we show that CEST fingerprinting is feasible for exchange rate quantification on a clinical 3T scanner. It can be potentially used to provide pH information in vivo.Acknowledgements
No acknowledgement found.References
1. Wu R, Xiao G, Zhou IY, Ran C, Sun PZ. Quantitative chemical exchange saturation transfer (qCEST) MRI - omega plot analysis of RF-spillover-corrected inverse CEST ratio asymmetry for simultaneous determination of labile proton ratio and exchange rate. NMR in Biomedicine. 2015;28(3):376–383.
2. Meissner J-E, Goerke S, Rerich E, Klika KD, Radbruch A, Ladd ME, Bachert P, Zaiss M. Quantitative pulsed CEST-MRI using Ω-plots. NMR in Biomedicine. 2015;28(10):1196–1208.
3. Ma D, Gulani V, Seiberlich N, Liu K, Sunshine JL, Duerk JL, Griswold MA. Magnetic resonance fingerprinting. Nature. 2013;495(7440):187–192.
Figures