0196
Quantitative Chemical Exchange Saturation Transfer (CEST) Imaging with Magnetic Resonance Fingerprinting (MRF)1Athinoula A. Martinos Center for Biomedical Imaging, Department of Radiology, Massachusetts General Hospital, Charlestown, MA, United States, 2Radiology, Harvard Medical School, Boston, MA, United States, 3The Russel H. Morgan Department of Radiology and Radiological Science, The Johns Hopkins University, Baltimore, MD, United States, 4F.M. Kirby Research Center for Functional Brain Imaging, Kennedy Krieger Institute, Baltimore, MD, United States, 5Department of Physics, Harvard University, Cambridge, MA, United States
Synopsis
CEST MRI suffers from several limitations including long image acquisition times and the qualitative nature of the CEST contrast. Clinical translation of CEST MRI would benefit greatly from the development of quantitative and rapid CEST methods. Here we build on the recently developed Magnetic Resonance Fingerprinting (MRF) technique and report the first use of a fast CEST fingerprinting method for generating quantitative exchange rate and exchangeable proton concentration maps of L-Arginine phantoms and a permanent MCAO rat stroke model.
Introduction
Chemical Exchange Saturation Transfer (CEST) MRI [1] uses selective radio-frequency pulses to detect exchangeable protons on a variety of molecules including proteins and has been shown to be a powerful tool for imaging different disease states. For example, the amide proton CEST contrast from endogenous proteins has recently been used to distinguish tumor recurrence from radiation necrosis [2] and to detect changes in pH during stroke [3]. In addition, a number of diaCEST pH imaging probes are under clinical evaluation for monitoring tumor acidosis [4] and detecting acute kidney injury [5]. However, traditional CEST MRI suffers from several limitations including long image acquisition times and the qualitative nature of the CEST contrast, which depends on many factors, including the chemical exchange rate, concentration of exchangeable protons, longitudinal relaxation time, and RF saturation power. Clinical translation of CEST MRI would benefit greatly from the development of quantitative and rapid CEST methods. Here we build on the recently developed Magnetic Resonance Fingerprinting (MRF) technique [6] and report the first use of a fast CEST fingerprinting method for generating quantitative exchange rate and exchangeable proton concentration maps of both L-Arginine phantoms and a permanent middle cerebral artery occlusion (MCAO) rat stroke brain.Methods
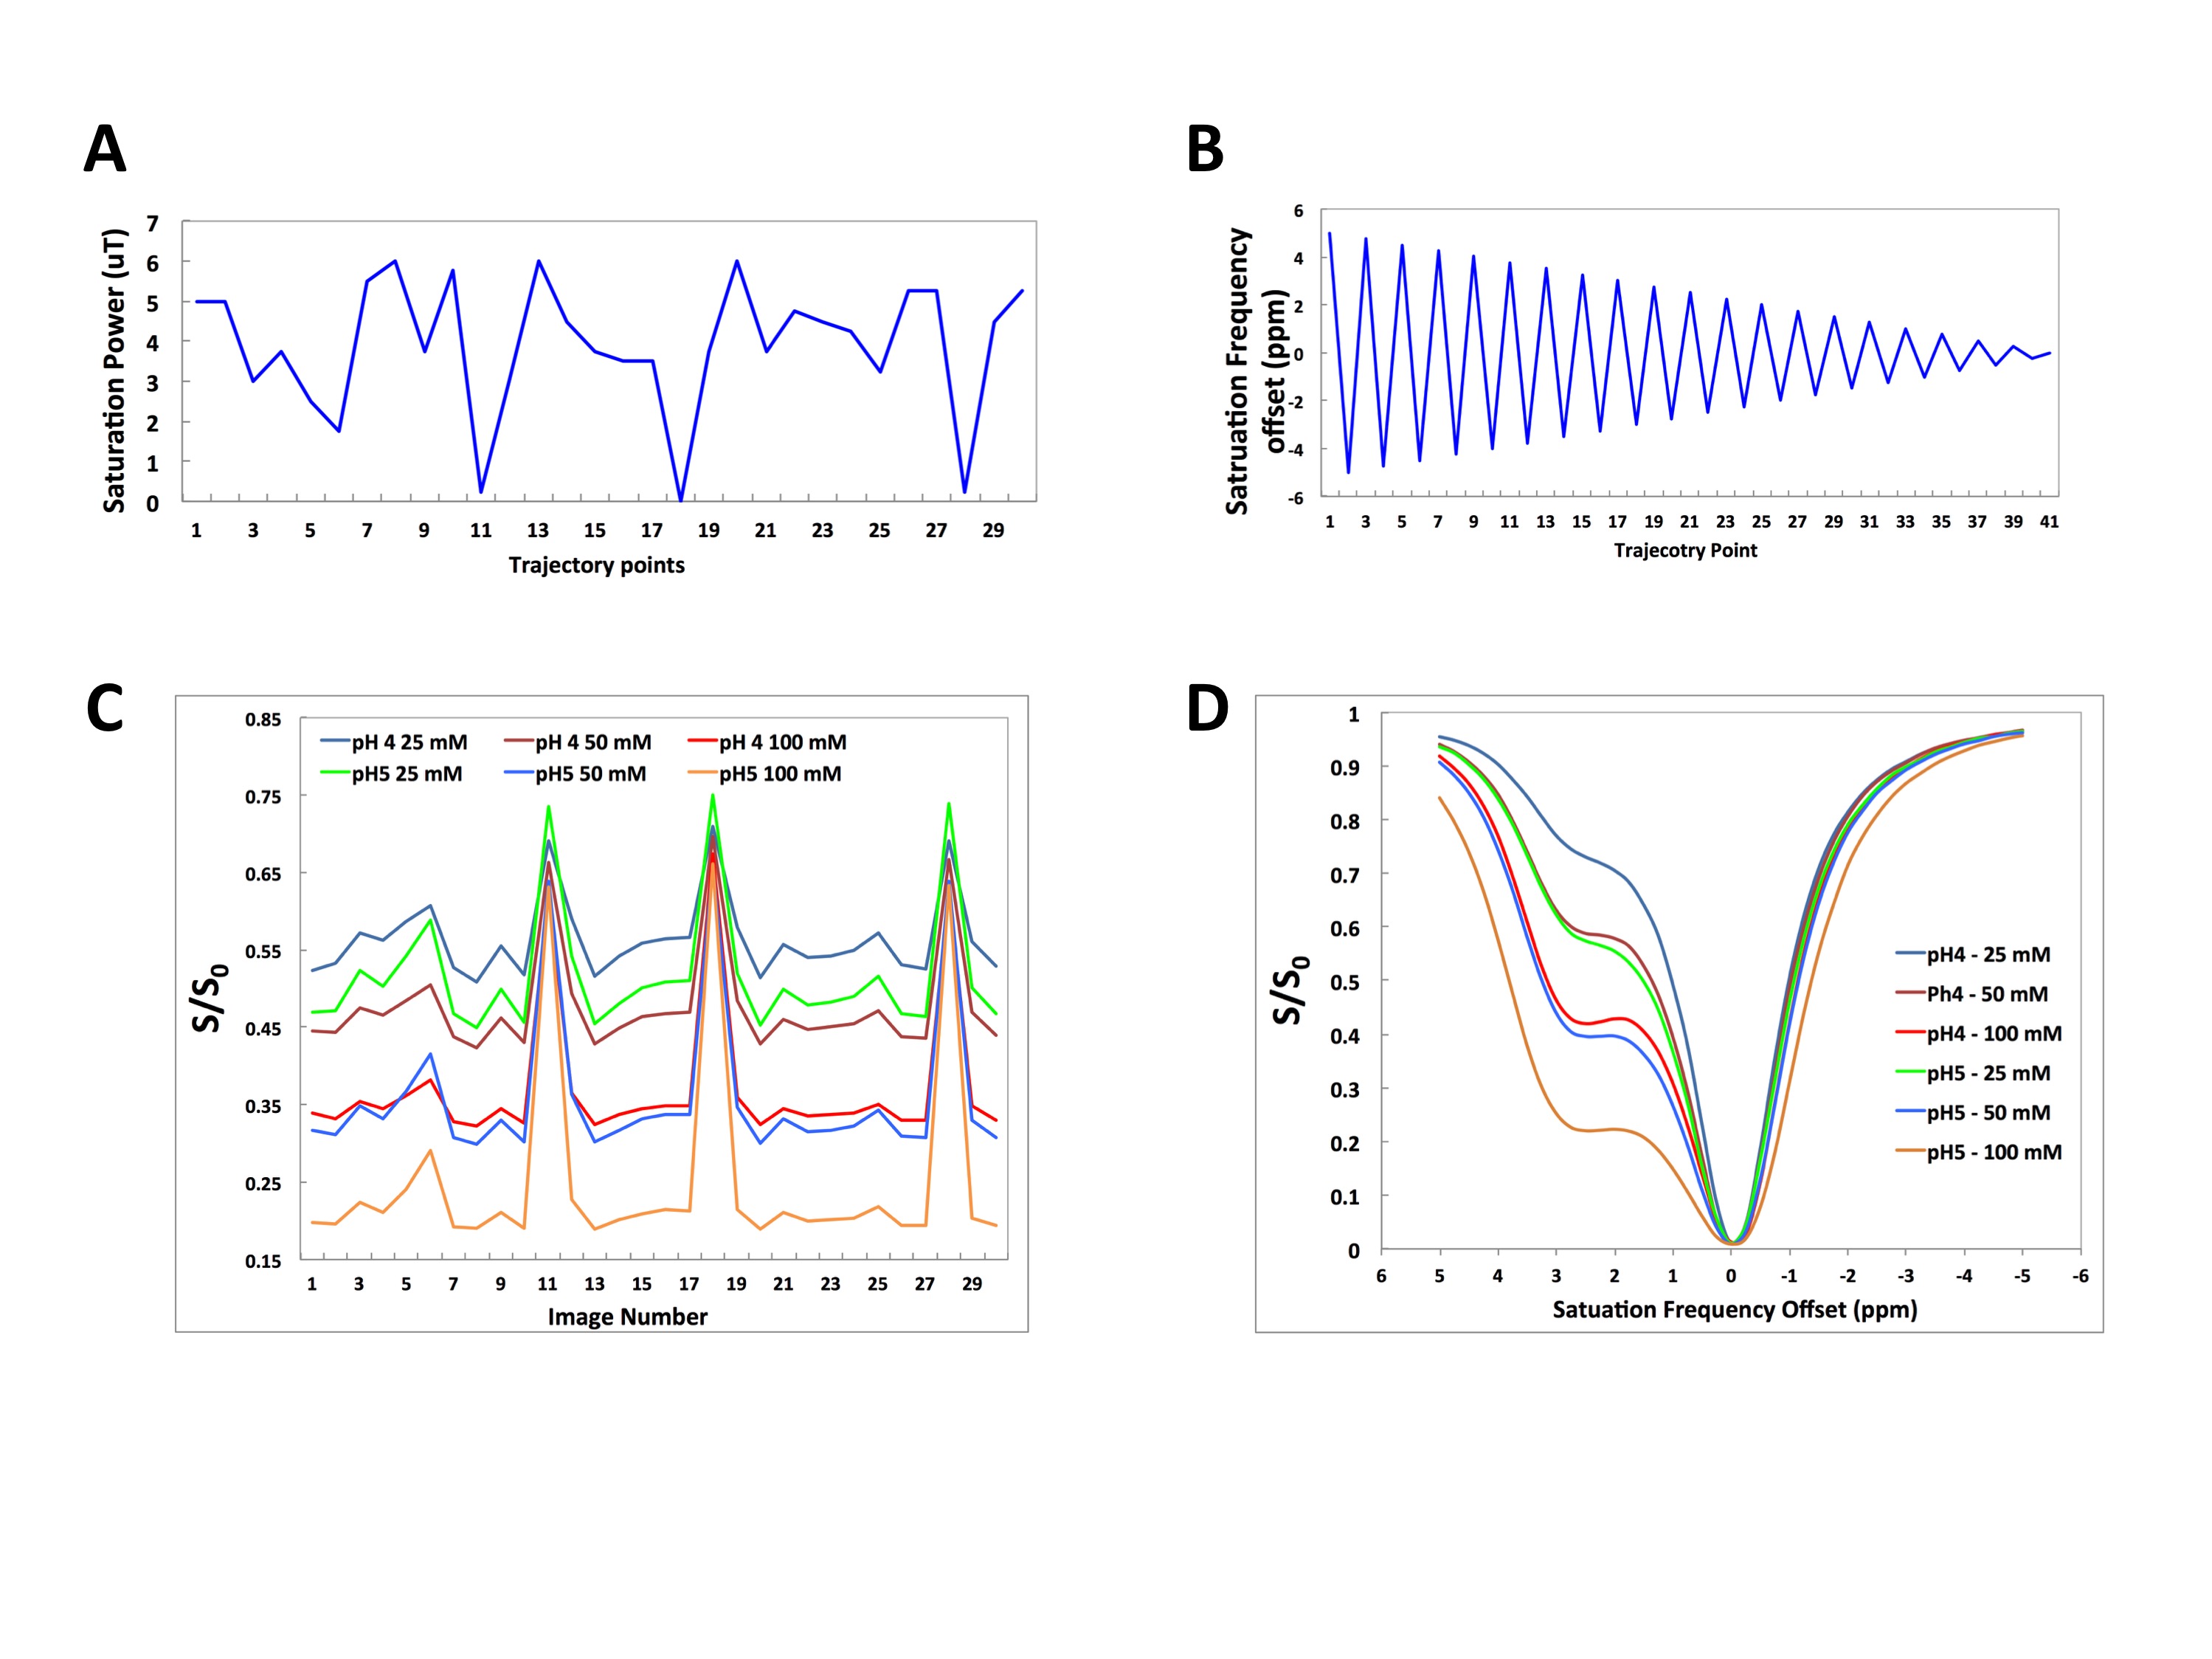
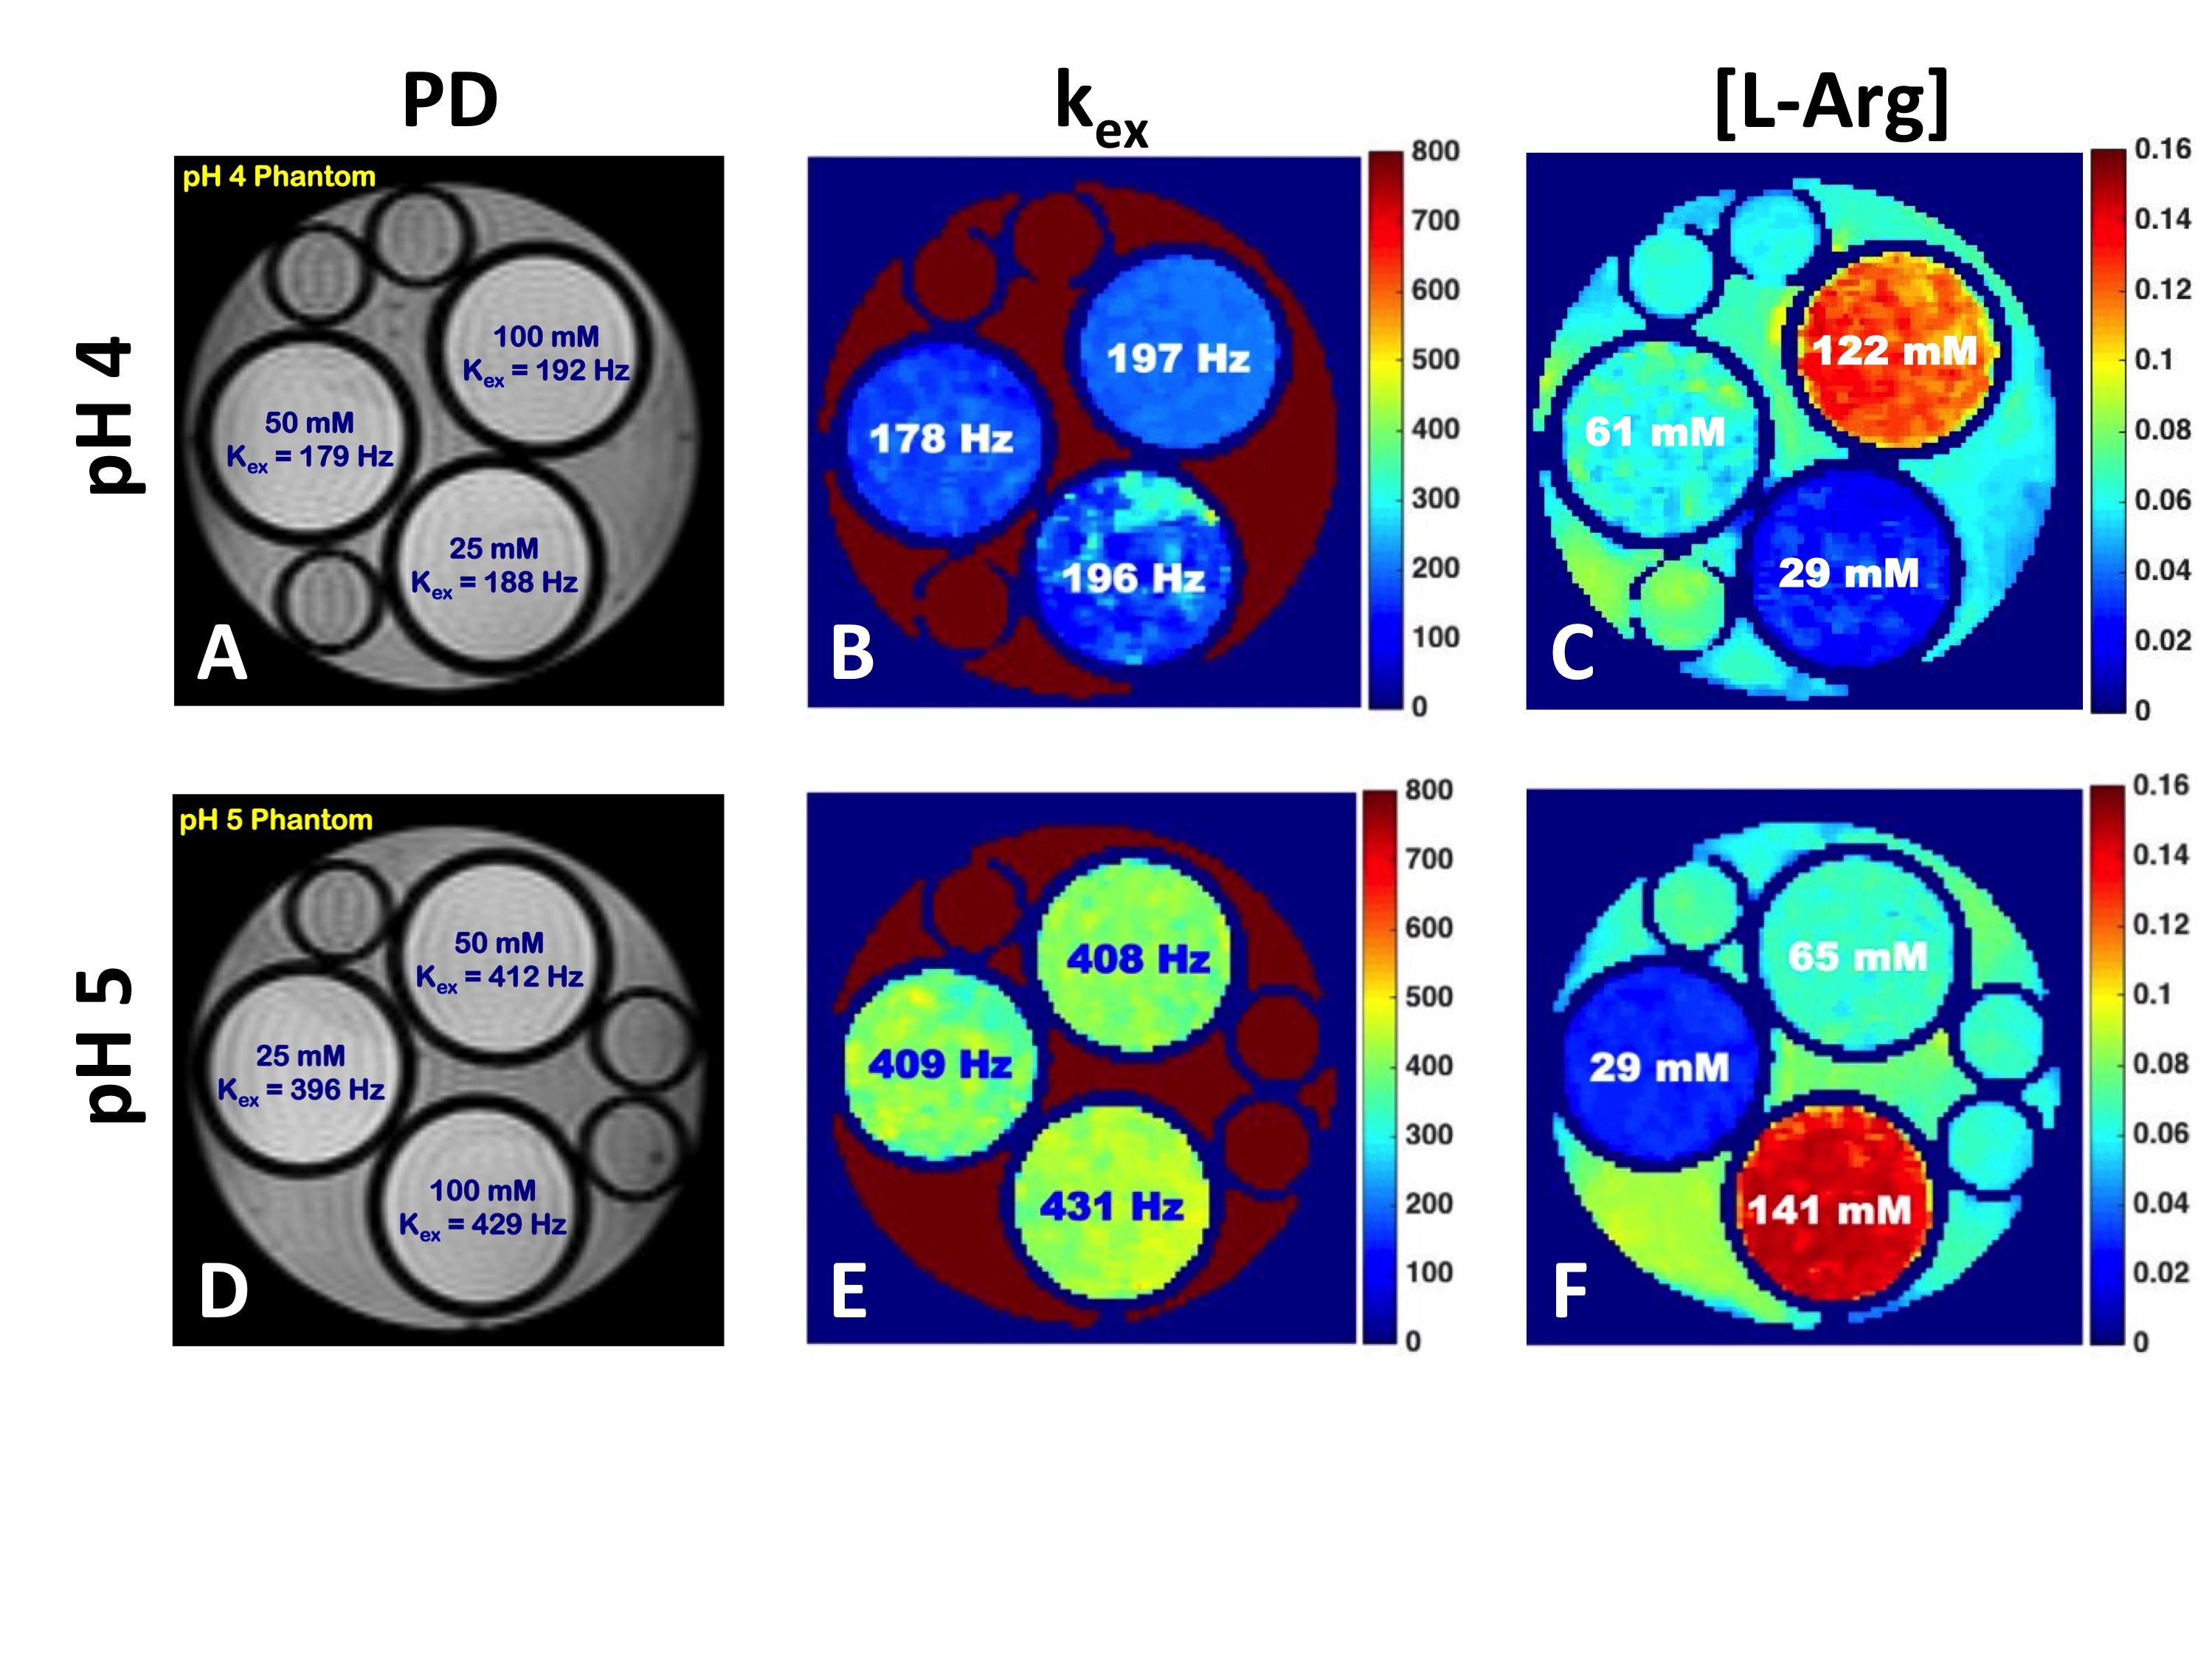
Echo Planar Imaging (EPI) CEST images were acquired on a 4.7 T MRI scanner. Two different CEST-MRF acquisition schedules (Fig 1) were used where either (1) the saturation frequency offset was fixed at +3 ppm and the power was varied from 0-6 μT or (2) the saturation power was fixed at 4 μT and the saturation frequency offset was varied from +5 to -5 ppm, corresponding to a traditional CEST Z-spectrum. CEST phantoms were made consisting of tubes of 25, 50, and 100 mM L-Arginine (L-Arg) at pH 4 and 5 (Fig 2). MRF signal trajectories were normalized by the norm of the trajectory and matched to a large dictionary of simulated signal trajectories with different exchange rates (0-800 Hz) and L-Arg concentrations (10-150 mM). The exchange rates of the amide exchangeable protons, resonating at +3 ppm chemical shift from the water protons, were measured using the QUESP MRI method [7]. In vivo CEST MRF data in a permanent MCAO rat stroke model was acquired using the same saturation power schedule as used for the phantom experiments, but with the saturation pulse fixed at +3.5 ppm offset from water. The total acquisition time for the saturation power CEST-MRF schedule was 2 minutes.Results and Discussion
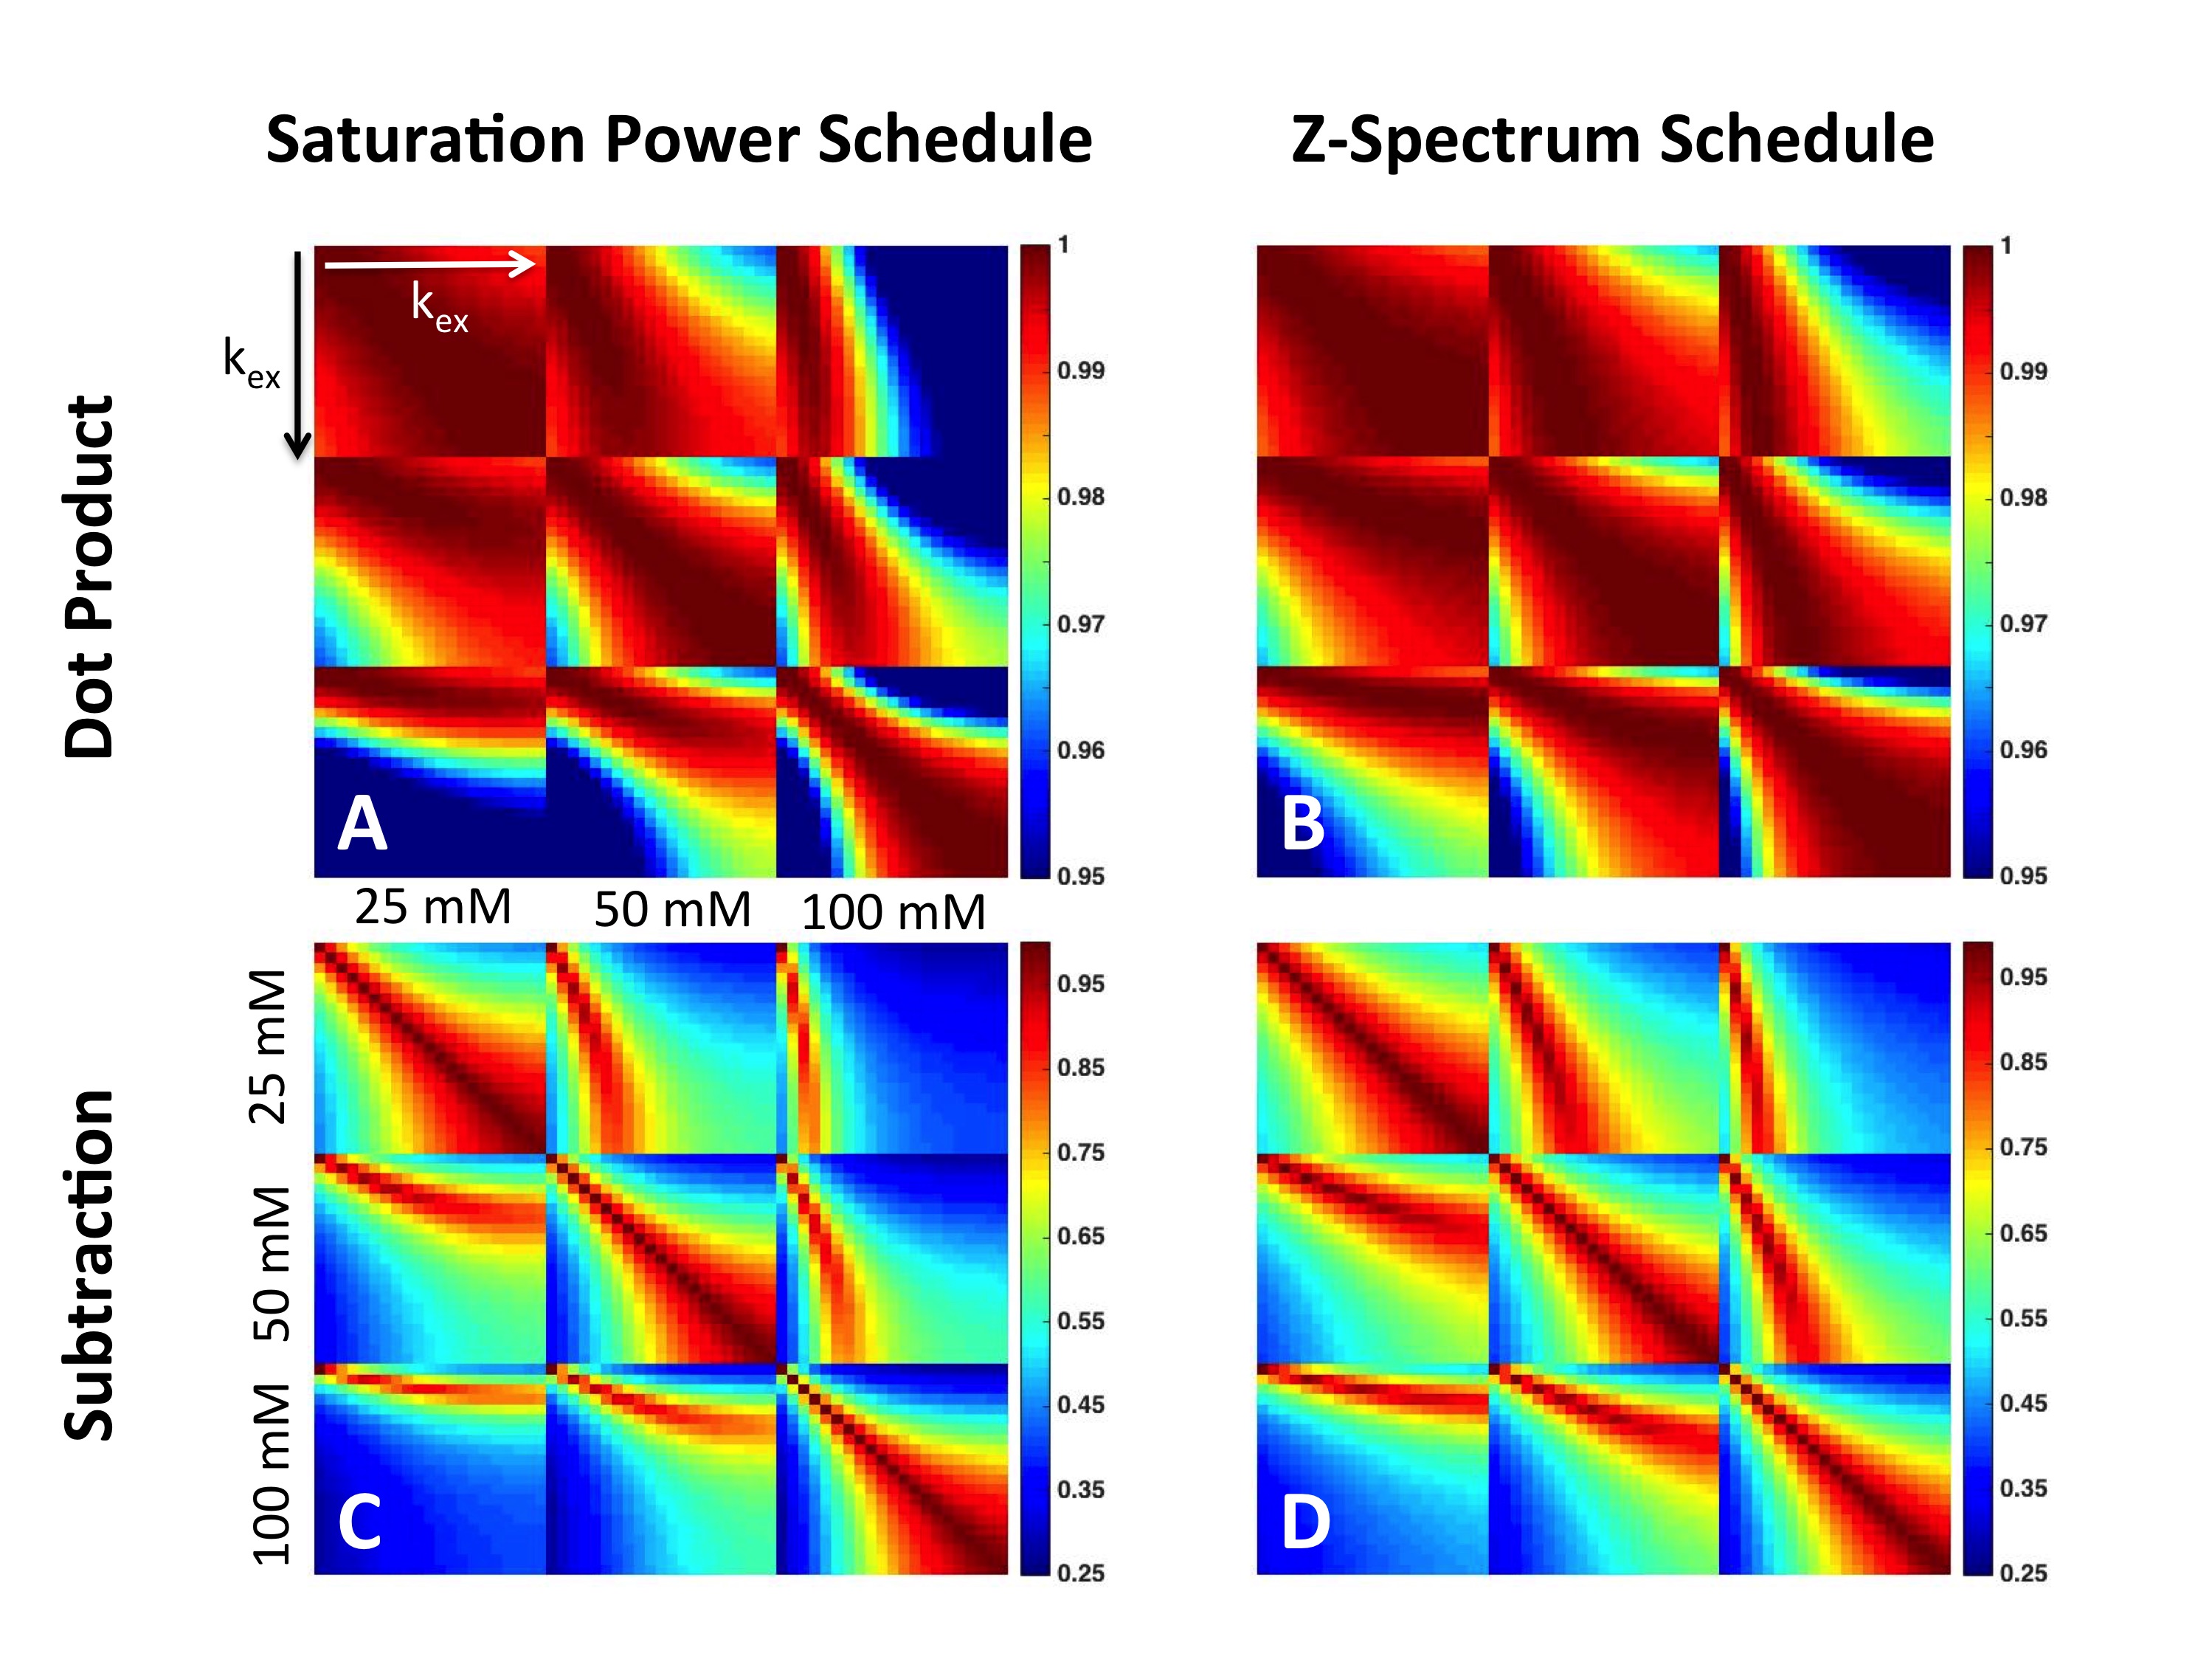
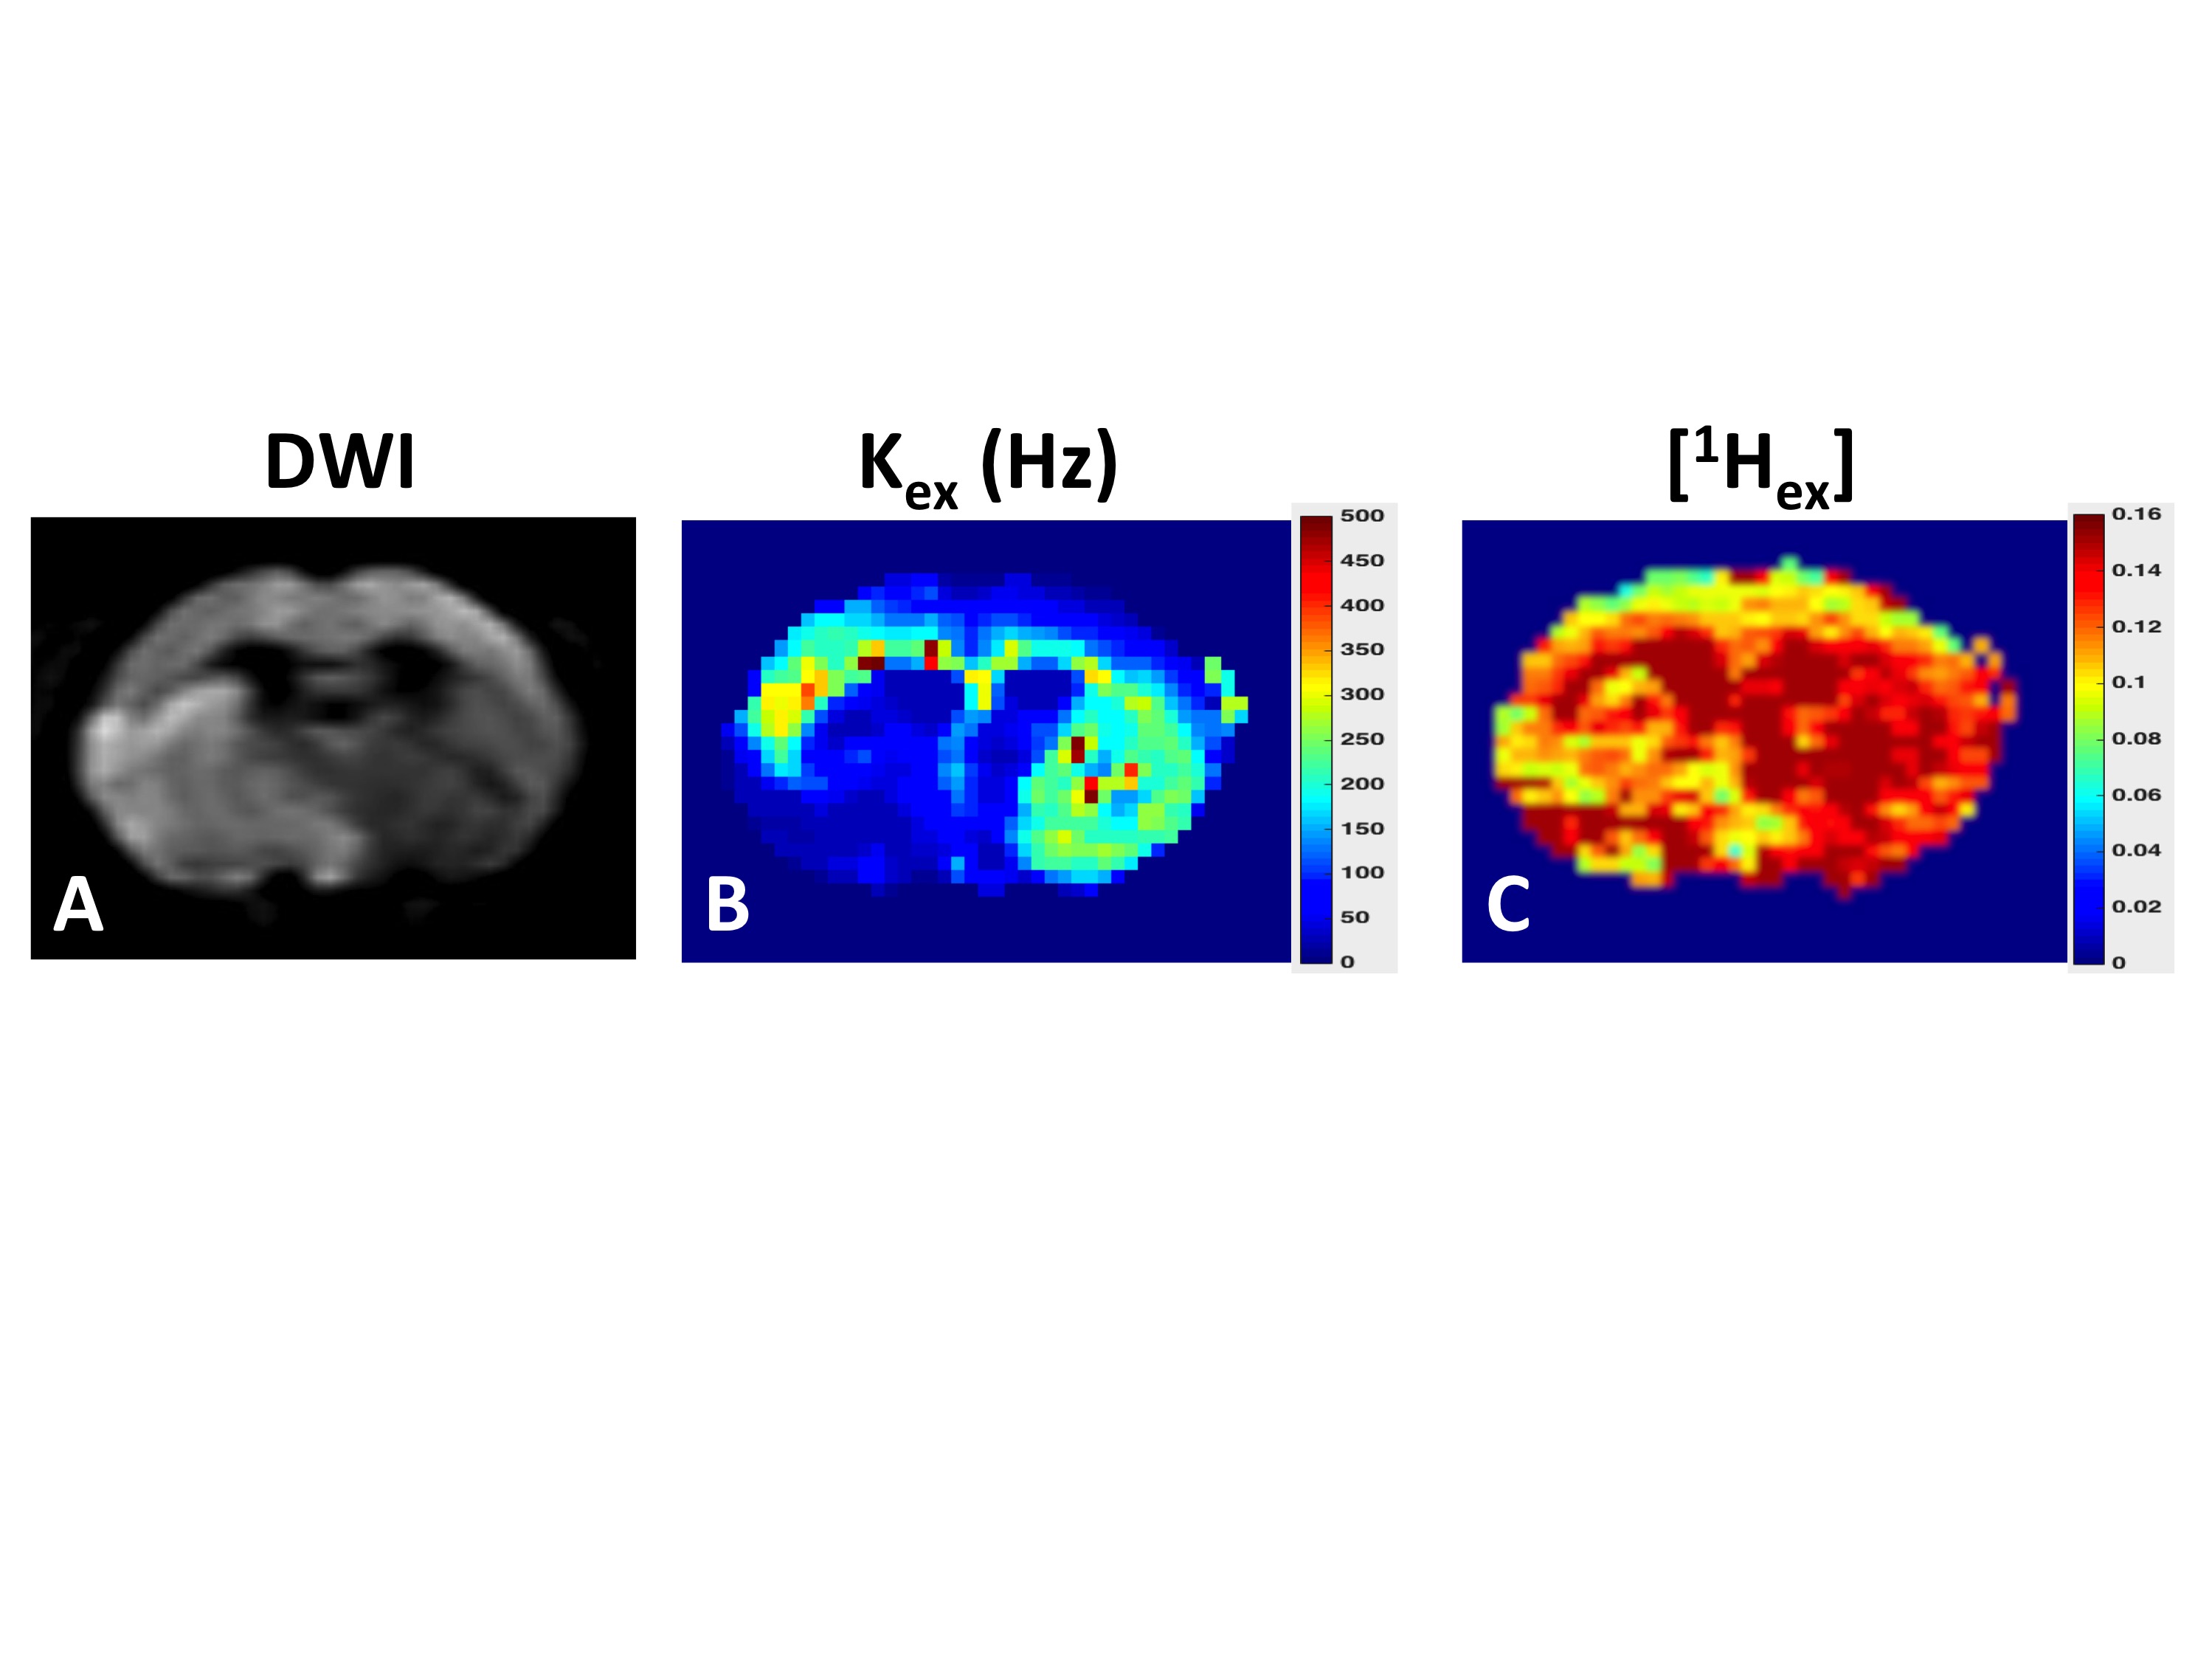
There is excellent agreement between the QUESP (Fig 2A,D) and CEST-MRF (Fig 2B,E) measured amide proton exchange rates, while the CEST-MRF concentrations (Fig 2C,F) somewhat overestimated the known L-Arginine concentrations (Fig 2A,D). The slight discrepancies in the concentrations are likely due to the relatively poor fingerprinting trajectory efficiency. The dot product correlation of the simulated MRF dictionary with itself provides a measure of the trajectory efficiency, or ability to discriminate different concentrations and exchange rates. Shown in Figure 3 are dictionary dot product matrices for both saturation power (Fig 3A) and Z-spectrum (Fig 3B) schedules. The saturation power schedule exhibits improved concentration and exchange rate discrimination compared to the Z-spectrum schedule. This can also be seen in the experimental MRF signal intensity trajectories where the saturation power schedule generates distinct trajectories for samples with different L-Arg concentrations and pH (Fig 1B), while some of the Z-spectrum trajectories for different samples overlay almost exactly (Fig 1D). Significantly improved discrimination should be obtained for both acquisition schedules by not normalizing the signal trajectories by the norm, which normalizes out many of the signal differences, but performing a trajectory subtraction match of the unnormalized trajectory (Fig 3C,D). Preliminary CEST-MRF data acquired with the saturation power schedule in a permanent MCAO rat stroke model (~2.5 hours post stroke) showed decreased exchange rate and exchangeable proton concentrations in the ipsilesional compared to the contralesional hemisphere (Fig 4) consistent with the expected decreased pH and increased water content.Conclusions
CEST-MRF provides a method for fast, quantitative CEST imaging. Further optimization of the CEST-MRF schedule [8] should lead to improved discrimination of exchange rates and concentrations. The use of unnormalized CEST-MRF trajectories and a trajectory subtraction-matching algorithm should significantly improve the concentration and exchange rate discrimination.Acknowledgements
This work was supported by the National Institutes of Health (R01-CA203873). SH and OC contributed equally to this work.References
1. Ward KM, Aletras AH, Balaban RS. A new class of contrast agents for MRI based on proton chemical exchange dependent saturation transfer (CEST). J Magn Reson 2000;143(1):79-87.
2. Zhou J, Tryggestad E, Wen Z, Lal B, Zhou T, Grossman R, Wang S, Yan K, Fu DX, Ford E, Tyler B, Blakeley J, Laterra J, van Zijl PC. Differentiation between glioma and radiation necrosis using molecular magnetic resonance imaging of endogenous proteins and peptides. Nat Med 2011;17(1):130-134.
3. Zhou J, Payen JF, Wilson DA, Traystman RJ, van Zijl PC. Using the amide proton signals of intracellular proteins and peptides to detect pH effects in MRI. Nat Med 2003;9(8):1085-1090.
4. Chen LQ, Howison CM, Jeffery JJ, Robey IF, Kuo PH, Pagel MD. Evaluations of extracellular pH within in vivo tumors using acidoCEST MRI. Magn Reson Med 2014;72(5):1408-1417.
5. Longo DL, Busato A, Lanzardo S, Antico F, Aime S. Imaging the pH evolution of an acute kidney injury model by means of iopamidol, a MRI-CEST pH-responsive contrast agent. Magn Reson Med 2013;70(3):859-864.
6. Ma D, Gulani V, Seiberlich N, Liu K, Sunshine JL, Duerk JL, Griswold MA. Magnetic resonance fingerprinting. Nature 2013;495(7440):187-192.
7. McMahon MT, Gilad AA, Zhou J, Sun PZ, Bulte JW, van Zijl PC. Quantifying exchange rates in chemical exchange saturation transfer agents using the saturation time and saturation power dependencies of the magnetization transfer effect on the magnetic resonance imaging signal (QUEST and QUESP): pH calibration for poly-L-lysine and a starburst dendrimer. Magn Reson Med 2006;55(4):836-847.
8. Cohen O, Sarracanie M, Armstrong BD, Ackerman JL, Rosen MS. In vivo optimized MR fingerprinting in the human brain. Proc Intl Soc Mag Reson Med 2016:4544.
Figures