0194
Effect of Osmolality on Dynamic Glucose Enhanced(DGE) MRI1Center for Neuroscience Imaging Research, Institute for Basic Science (IBS), Suwon, Korea, Republic of, 2Department of Biomedical Engineering Sungkyunkwan University (SKKU), Suwon, Korea, Republic of, 3Samsung Advanced Institute for Health Sciences and Technology, Sungkyunkwan University, Seoul, Korea, Republic of, 4Department of Radiology, University of Pittsburgh, Pittsburgh, PA, United States
Synopsis
Dynamic glucose enhanced(DGE) MRI has shown promise in glucose metabolism studies. In recent studies, a hypertonic dextrose solution was used for reliable detection of glucose in the brain. However, the effects of the hypertonic solution on DGE signal have not been verified yet. This study aimed to investigate the signal contributions from non-glucose related components. We used hypertonic D-, L-glucose, and NaCl solution to identify osmolality effects. Our data show an osmotic shift of water between the extravascular and intravascular space, induced by administering D-glucose(50%), can highly affect the DGE signal but negligible contributions were observed from the intravascular space.
Purpose
The understanding of glucose(Glc) uptake and metabolism is of great importance for basic and clinical metabolic studies1-3. Recently, the glucoCEST technique has been adopted with an intravenous injection of natural D-glucose, thus being dubbed dynamic glucose enhanced(DGE)-MRI4. In preclinical and clinical studies, the van Zjil’s group has used 50% Glc for intravenous injection4,5. Although the decrease in glucoCEST signal(i.e., an increase in chemical exchange) was detected, its signal source is still unclear. Thus, DGE-MRI experiments with 1.2 and -1.2ppm were performed in anesthetized rats. To evaluate the osmolality effect of the hypertonic Glc solution, NaCl solution with the same osmolality was prepared. Non-transportable L-Glc was used with and without blood-pool contrast agent administration to determine the contribution of the intravascular vs. extravascular poolsMethods
Animal Preparation: 23 male Sprague-Dawley rats(weighing between 233~352g) were studied with approval by the Institutional Animal Care and Use Committee of Sungkyunkwan University. Initially, the tail vein was cannulated for glucose administration. Rats were anesthetized with isoflurane(5% for induction and 1.5~2.0% during MRI experiments) with a mixture of O2 and N2(30:70) and the temperature was controlled at 37±0.5°C using a water circulating pad. Injection Protocols: 3.5g/kg 50% D- and L-Glc(2520mOsm/L), and 7.4% NaCl(2520mOsm/L) were infused via the tail vein over a 2~3 minute period. As a control, 0.9% NaCl(304mOsm/L, isotonic solution) was injected. To suppress the intravascular signal, 5mg/kg dextran-coated iron oxide nanoparticles(MION) were injected 40 mins prior to DGE-MRI experiments. In vivo DGE-MRI experiments: All MR measurements were performed on a 9.4T Bruker Biospec MRI. A volume coil(72mm) and 4-channel receiver array coil combination were used. The control image(S0) was acquired without a magnetization transfer(MT) prepulse with the same sequence. The DGE-data was acquired during a 20 min pre-injection period(Sbase) and 40 min post-injection. For DGE contrast, a single continuous-wave prepulse(3s, B1=1.6T) was applied to saturate hydroxyl protons(+1.2ppm) or opposite frequency(-1.2ppm) in an interleaved scheme, yielding a temporal resolution of 20 seconds. After MT preparation, images were read-out by an RF-spoiled TurboFLASH sequence with center-out phase encoding with parameters as follows: matrix size=64x64, slice thickness=1.16mm, FA=15.0°, GRE-readout TR=10.0ms, TE=1.12ms, and image TR=10.0s. Data processing: DGE images were processed by taking the difference between Sbase and each dynamic image, and normalized by S0 (ΔS(t)/S0=[Sbase - S(t)]/S0). Regions of interest(ROI) were drawn in the cortices of both hemispheres for dynamic DGE responses. ΔMTRasym at 1.2ppm was calculated by [ΔS+1.2ppm(t) - ΔS-1.2ppm(t)]/S0 Results & Discussion
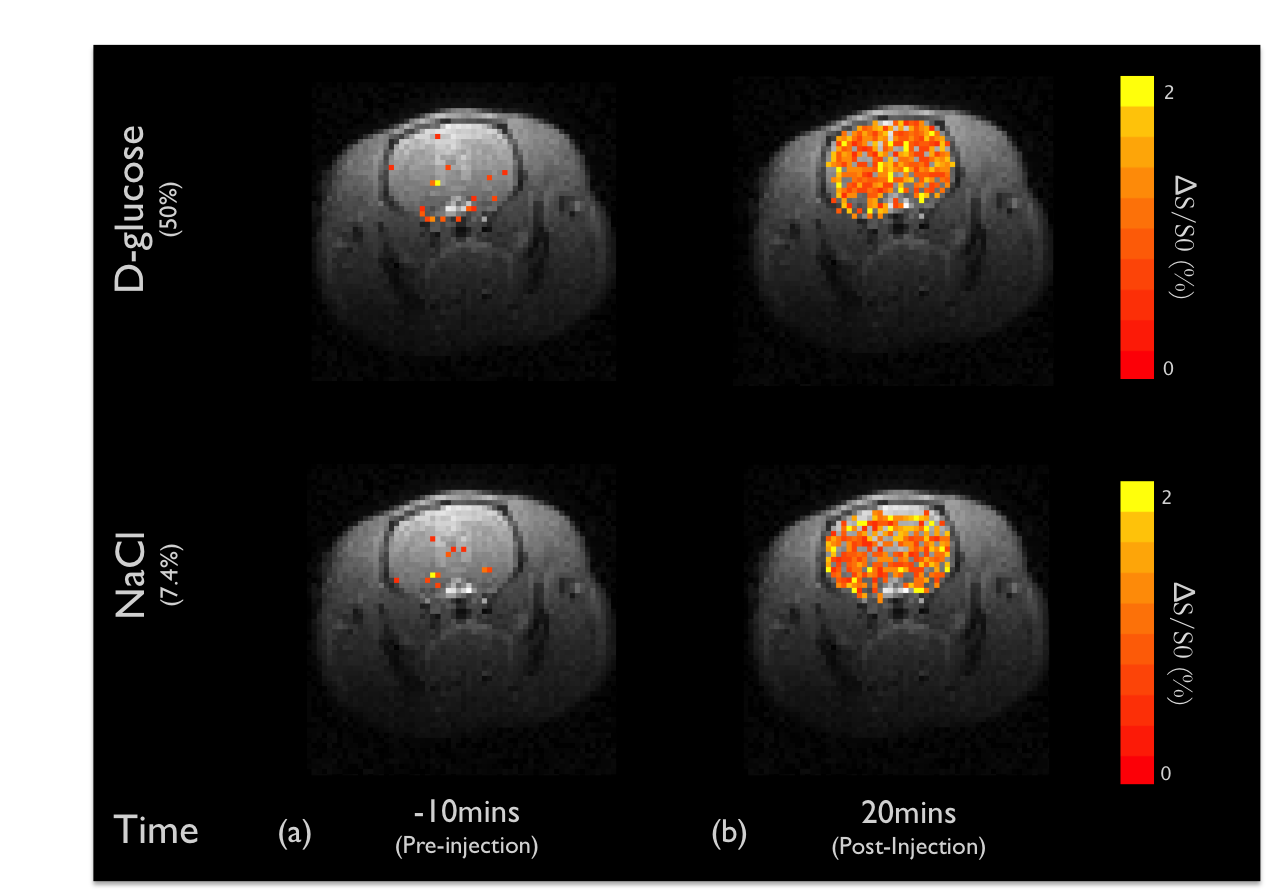
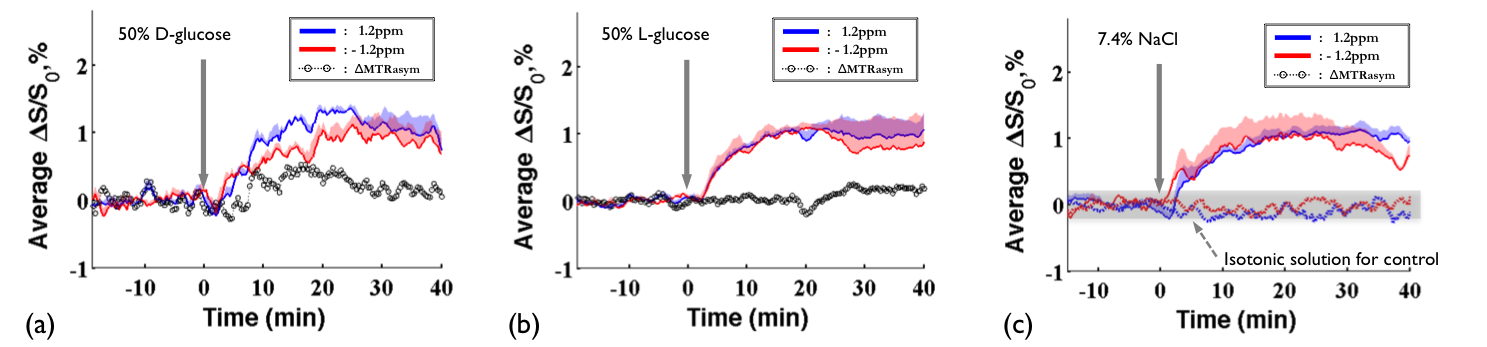
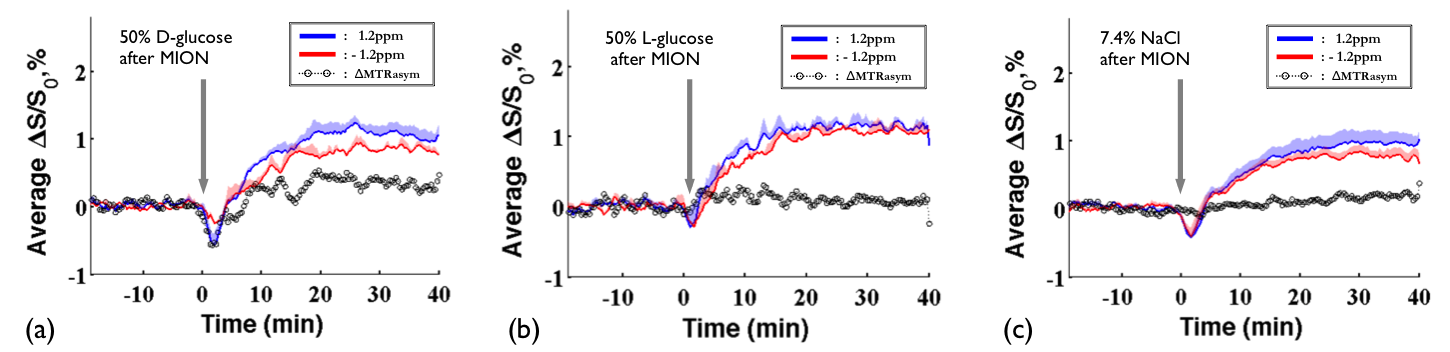
DGE images at 1.2ppm are displayed at 10mins before intravenous injection of D-glucose and NaCl(Fig.1a) as well as at 20 minutes after the injection(Fig.1b). Unexpectedly, similar responses were observed in large brain regions when the NaCl solution was administered. To quantify dynamic responses, ROI analyses were performed. After each hypertonic solution injection(50% D- and L-Glc, and 7.4% NaCl), signals at both frequencies increased slowly over 15mins and reached a plateau afterward(Fig.2). Especially, in the L-Glc and NaCl solution, similar signal changes were seen irrespective of +1.2 and -1.2 pm, indicating a reduction of T2(Fig.2b,c). ΔMTRasym at 1.2 ppm removed the non-exchange contributions, and was significant only for D-Glc injection. The ΔMTRasym in 50% D-Glc gradually increased over 17 mins and slowly decreased thereafter(Fig.2a). One important question is whether a change in intravascular signals can contribute to DGE contrast. To examine this issue, the same DGE experiments were performed again after MION injection(5mg/kg). The dynamic curves with blood suppression(Fig.3) are analogous to those in Fig.2, which implies that the DGE contrast is largely influenced by extravascular water contribution. Note that the initial dip was due to a transient increase of T2 in blood water during the infusion. To detect Glc transport and metabolism, it is important to reduce the osmolality effect. In the previous DGE studies, 0.15 ml of 50% D-Glc was used in mice, which is approximately 3.5~4g/kg body weight4. When a dose was reduced to less than 1 g/kg, the non-chemical exchange component is small and the exchange component is dominant6. In both human and mouse DGE studies4,5, a brief Glc-related peak response was observed but was not detected in our rat studies. Although the discrepancy is not fully understood, the initial peak observed by others may be originated from intravascular Glc signals because of its small contribution in our 9.4T studies. Conclusions
Our results demonstrate that the DGE contrast is strongly influenced by the osmolality effects with minimal contribution from the intravascular space when a large Glc dose is administered. Further understanding about the DGE signal sources is necessary for smaller Glc doses. Acknowledgements
This study was supported by IBS-R015-D1References
[1] Vander Heiden, M. G., Cantley, L. C., & Thompson, C. B. (2009). Understanding the Warburg effect: the metabolic requirements of cell proliferation. science, 324(5930), 1029-1033.
[2] Mosconi, L. (2005). Brain glucose metabolism in the early and specific diagnosis of Alzheimer’s disease. European journal of nuclear medicine and molecular imaging, 32(4), 486-510.
[3] Martin, W. R. W., Beckman, J. H., Calne, D. B., Adam, M. J., Harrop, R., Rogers, J. G., ... & Pate, B. D. (1984). Cerebral glucose metabolism in Parkinson’s disease. Canadian Journal of Neurological Sciences/Journal Canadien des Sciences Neurologiques, 11(S1), 169-173.
[4] Xu, X., Chan, K. W., Knutsson, L., Artemov, D., Xu, J., Liu, G., ... & van Zijl, P. (2015). Dynamic glucose enhanced (DGE) MRI for combined imaging of blood–brain barrier break down and increased blood volume in brain cancer. Magnetic Resonance in Medicine, 74(6), 1556-1563.
[5] Xu, X., Yadav, N. N., Knutsson, L., Hua, J., Kalyani, R., Hall, E., ... & Barker, P. (2015). Dynamic Glucose-Enhanced (DGE) MRI: Translation to Human Scanning and First Results in Glioma Patients. Tomography: a journal for imaging research, 1(2), 105.
[6] Nasrallah, F. A., Pagès, G., Kuchel, P. W., Golay, X., & Chuang, K. H. (2013). Imaging brain deoxyglucose uptake and metabolism by glucoCEST MRI. Journal of Cerebral Blood Flow & Metabolism, 33(8), 1270-1278.
Figures