0193
Dynamic Glucose Enhanced Imaging at 3T: First Human Data1Russell H. Morgan Department of Radiology and Radiological Science, Johns Hopkins University, Baltimore, MD, United States, 2F. M. Kirby Research Center for Functional Brain Imaging, Kennedy Krieger Institute, Baltimore, MD, United States, 3Department of Medical Radiation Physics, Lund University, Lund, Sweden, 4Department of Neurology, Johns Hopkins University, Baltimore, MD, United States
Synopsis
Recently, it has been demonstrated that D-glucose has potential as an MRI contrast agent at 7T for imaging dynamic changes upon glucose infusion in brain tumors using chemical exchange saturation transfer (CEST) MRI. Here we show first data for the possibility of translating such technique to 3T using pseudo-continuous wave saturation and extend the method to acquire a 3D volume (10 slices) for better brain coverage. We present dynamic glucose-enhanced (DGE) data from healthy volunteers and a brain tumor patient with a low grade glioma showing the feasibility of glucose enhanced imaging at clinical field strength.
Target audience:
Those interested in chemical exchange saturation transfer
(CEST) and brain tumor imaging. Purpose:
Recently, D-glucose has shown potential as a biodegradable contrast agent that can be detected using CEST MRI (glucoCEST),1-4 T1ρ-based5,6 or T2-based relaxation7,8 approaches. Glucose derivatives detectable by CEST have also been suggested.9,10 To gain information regarding the time-dependent uptake of glucose and hence the cerebral perfusion properties, time resolved dynamic images are required and it has previously been demonstrated that dynamic glucose enhanced (DGE) imaging using CEST MRI at 7T is a promising method.11 In the present work we translate such approach to 3T using a pseudo-continuous wave (pcw) saturation and extend the method to acquire a 3D volume for better brain coverage.Method:
The study was conducted on a 20 mM glucose in saline phantom, 2 healthy consented volunteers and a tumor patient diagnosed with a low grade glioma. Subjects received a D50 glucose ampule (50% Dextrose in 50 ml water sterile solution, Hospira) infused intravenously over 1 min in one arm using a power injector. Approximately 30 min after glucose injection, subjects were injected with Gd contrast agent (proHance) at 0.1 mM/kg body weight for dynamic contrast enhanced (DCE) MRI. Subjects were scanned on a 3T Philips MRI scanner. DGE image: The pcw saturation could be achieved by alternatingly using the 2 RF transmit channels as previously demonstrated for CEST MRI by Keupp et al.12,13 Each RF channel pulses for 50 ms alternatively for a total of 1.5 s with B1rms of 2 μT. Images were acquired using the turbo spin echo sequence with TR/TE/FA = 2.7 s/6.1 ms/90°. A 3D volume across a FOV of 220×180×50 mm3 was acquired. The in-plane resolution was 2.5 mm2 with slice thickness of 5 mm. DGE images were acquired at 1.5 ppm and 3.0 ppm alternatingly. The temporal resolution for each frequency was 16.4 s and 128 images were acquired continuously before, during and after glucose infusion. DCE image: DCE images were acquired using single shot turbo field echo with TR/TE/FA = 5.1 ms (between each echo)/2.5 ms/26°. FOV was the same as the DGE images and the resolution was 2×2×5mm3. 150 dynamic scans were acquired within a total scan time of 5min 20s.Results and Discussion:
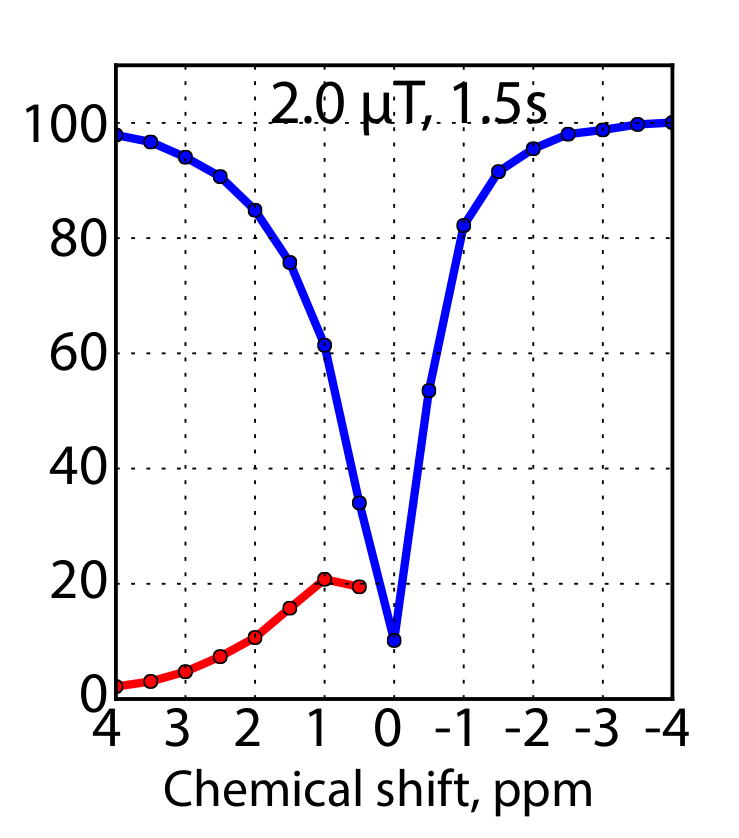
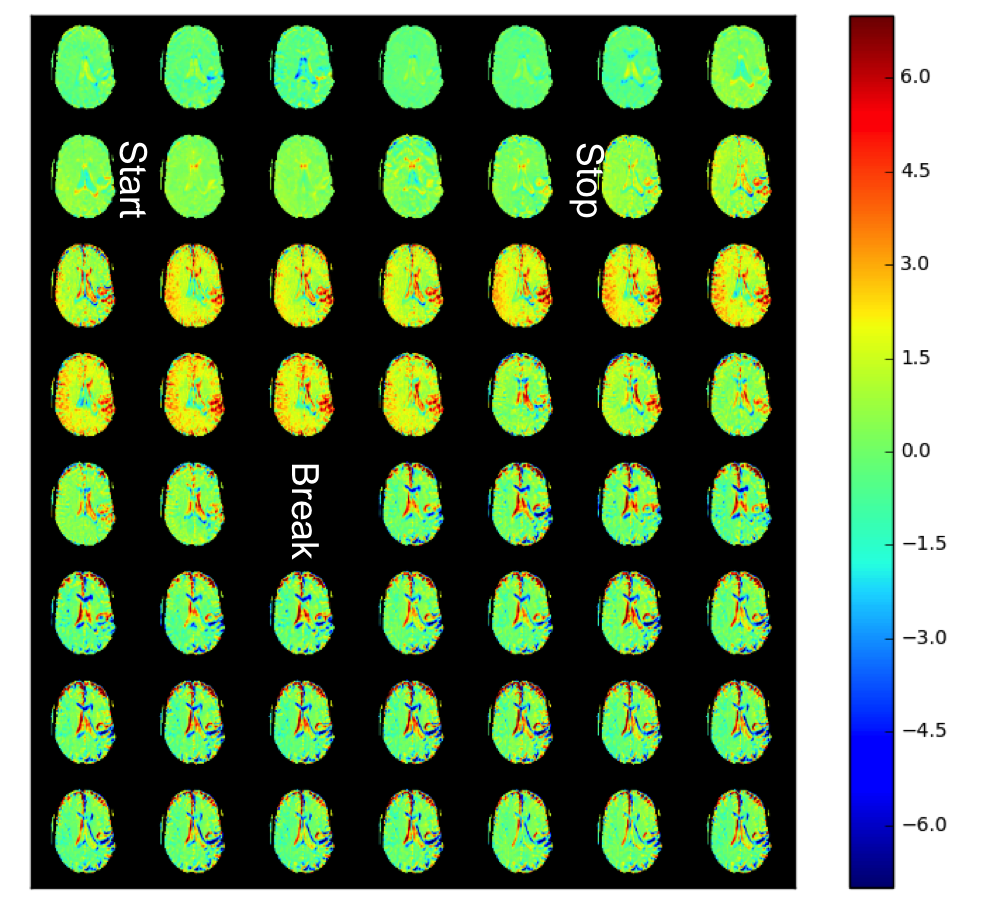
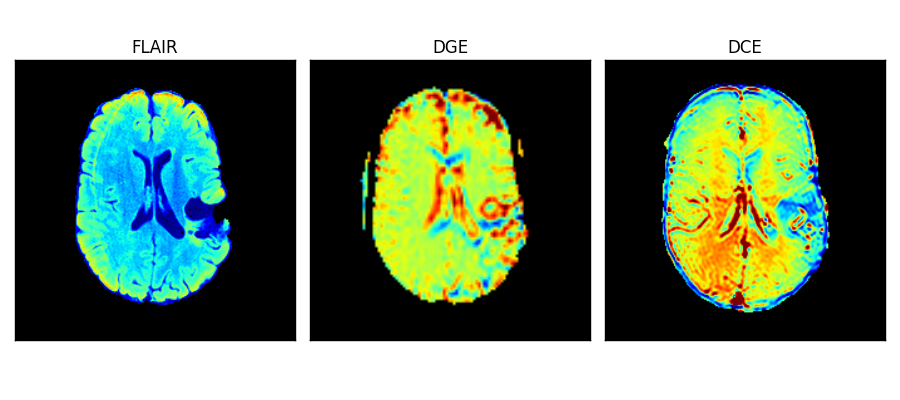
The Z spectrum and the MTRasym for the phantom are shown in Fig. 1. It can be seen that with the current saturation parameters, it is possible to detect the CEST effect of glucose at 3T. A MTRasym ratio of 15% at 1.5 ppm was observed in the 20 mM glucose phantom. Fig. 2 shows the time-resolved DGE signal differences in the patient before, during and after infusion. It can be seen that glucoCEST signal shows enhancement in typical blood vessel rich gray matter regions and the ventricles. Fig. 3 compares FLAIR, DGE area-under-curve (AUC) and DCE-AUC images over 5 min post infusion of the tumor patient, respectively. The FLAIR image (2 mm slice only) shows a surgical cavity with some edema around it. The DCE image (5 mm slice) shows some vessels close to the tumor and a slight hyperintense rim, while the DGE image has some additional signal enhancement around the tumor. Due to some motion artifacts and the fact that only one patient was studied, we cannot conclude anything physiological. However, technically, the data show that there is sufficient signal for multi-slice glucose imaging at 3T.Conclusion:
Our results show that it is possible to perform 3D DGE experiments at clinical field strength with sufficient temporal resolution. Currently we acquire the DGE scan for a total of 17 min with a 13 min post infusion period. Our data from the tumor patient show that the enhancement is pronounce enough at 5 min post infusion. Therefore we expect that it should be possible to incorporate a DGE scan as part of the brain tumor clinical scan with just an additional 10 min of scan time.Acknowledgements
This work was supported by NIH R01EB019934, NIH P50CA103175, Swedish Cancer Society CAN 2015/251 and Swedish Research Council 2015-04170References
1. Chan KW, McMahon MT, Kato Y, Liu G, Bulte JW, Bhujwalla ZM, Artemov D, van Zijl PC. Natural D-glucose as a biodegradable MRI contrast agent for detecting cancer. Magn Reson Med. 2012;68(6):1764-1773.
2. Walker-Samuel S, Ramasawmy R, Torrealdea F, Rega M, Rajkumar V, Johnson SP, Richardson S, Goncalves M, Parkes HG, Arstad E, Thomas DL, Pedley RB, Lythgoe MF, Golay X. In vivo imaging of glucose uptake and metabolism in tumors. Nat Med. 2013;19(8):1067-1072.
3. Nasrallah FA, Pages G, Kuchel PW, Golay X, Chuang KH. Imaging brain deoxyglucose uptake and metabolism by glucoCEST MRI. J Cereb Blood Flow Metab. 2013;33(8):1270-1278.
4. Xu X, Chan KW, Knutsson L, Artemov D, Xu J, Liu G, Kato Y, Lal B, Laterra J, McMahon MT, van Zijl PC. Dynamic glucose enhanced (DGE) MRI for combined imaging of blood-brain barrier break down and increased blood volume in brain cancer. Magn Reson Med. 2015;74(6):1556 - 1563.
5. Jin T, Mehrens H, Hendrich KS, Kim SG. Mapping brain glucose uptake with chemical exchange-sensitive spin-lock magnetic resonance imaging. J Cereb Blood Flow Metab. 2014;34(8):1402-1410.
6. Zu Z, Spear J, Li H, Xu J, Gore JC. Measurement of regional cerebral glucose uptake by magnetic resonance spin-lock imaging. Magn Reson Imag. 2014;32(9):1078-1084.
7. Gore JC, Brown MS, Mizumoto CT, Armitage IM. Influence of glycogen on water proton relaxation times. Magn Reson Med. 1986;3(3):463-466.
8. Yadav NN, Xu J, Bar-Shir A, Qin Q, Chan KW, Grgac K, Li W, McMahon MT, van Zijl PC. Natural D-glucose as a biodegradable MRI relaxation agent. Magn Reson Med. 2014;72(3):823-828.
9. Rivlin M, Horev J, Tsarfaty I, Navon G. Molecular imaging of tumors and metastases using chemical exchange saturation transfer (CEST) MRI. Sci Rep. 2013;3:3045.
10. Rivlin M, Tsarfaty I, Navon G. Functional molecular imaging of tumors by chemical exchange saturation transfer MRI of 3-O-Methyl-D-glucose. Magn Reson Med. 2014;72(5):1375-1380.
11. Xu X, Yadav NN, Knutsson L, Hua J, Kalyani R, Hall E, Laterra J, Blakeley J, Strowd R, Pomper M, Barker P, Chan K, Liu G, McMahon MT, Stevens RD, van Zijl PC. Dynamic Glucose-Enhanced (DGE) MRI: Translation to Human Scanning and First Results in Glioma Patients. Tomography. 2015;1(2):105-114.
12. Keupp J, Baltes C, Harvey P, J. VdB. Parallel RF transmission based MRI technique for highly sensitive detection of amide proton transfer in the human brain at 3T. Proc Int Soc Magn Reson Med. 2011;19(710).
13. Togao O, Hiwatashi A, Keupp J, Yamashita K, Kikuchi K, Yoshiura T, Yoneyama M, Kruiskamp MJ, Sagiyama K, Takahashi M, Honda H. Amide Proton Transfer Imaging of Diffuse Gliomas: Effect of Saturation Pulse Length in Parallel Transmission-Based Technique. PLoS ONE. 2016;11(5):e0155925.
Figures