0192
Amide proton transfer-weighted MRI signal as a surrogate biomarker to assess MGMT promoter methylation status in glioblastoma1Department of Radiology, Johns Hopkins University School of Medicine, Baltimore, MD, United States, 2Department of Radiology, Southern Medical University, Zhujiang Hospital, Guangzhou, People's Republic of China, 3Department of Pathology, Southern Medical University, Zhujiang Hospital, Guangzhou, People's Republic of China, 4Department of Pathology, Johns Hopkins University School of Medicine, Baltimore, MD, United States
Synopsis
We explored the feasibility of using the APTW signal intensity as a surrogate biomarker to identify the methylation status of MGMT promoter in glioblastoma (GBM). Eighteen patients with newly diagnosed GBM were recruited and scanned. Results showed that the APTW signal intensities were significantly higher in the unmethylated MGMT promoter group than in the methylated MGMT promoter group. The area under the ROC curve (AUC) for APTW to differentiate these two GBM groups was 0.857. Preoperative APTW imaging may assist in predicting the MGMT promoter methylation status in patients with GBM.
Target audience
Researchers and clinicians who are interested in clinical APT imaging applications and radiogenomics.Purpose
Glioblastoma (GBM) is the most dismal type of primary malignant brain tumors in adults. Methylated O6-methylguanine-DNA methyltransferase (MGMT) promoter fosters longer survival in patients with GBM who receive alkylating agents due to the reduction of MGMT protein expression (a DNA repair enzyme that can counteract alkylating chemotherapy) (1). Thus, MGMT promoter methylation status has become a routine lab test in neuro-oncology. Currently, the MGMT methylation status test primarily relies on the invasive surgical procedure. In recent years, a new direction in cancer research has emerged that focuses on the relationship between imaging phenotypes and genomics (2,3). Amide proton transfer-weighted (APTW) imaging is a novel molecular MRI technique that gives contrast based in large part on endogenous cellular proteins in tissue (4). APTW imaging has shown great potential for assessing malignant brain tumors (5-7) and other cancers (8,9). The purpose of this study was to investigate whether MGMT methylation status in GBM is correlated to APTW MRI.Methods
Subjects
This study was approved by the institutional review board, and written, informed consent was obtained from each subject. Between May 2013 and August 2016, 18 patients (mean age, 47.1 ±15.1 years; range, 34–76 years) with newly suspected gliomas were recruited prior to their initial surgical diagnostic procedure.
MRI protocol
All patients were scanned on a Philips 3T MRI system. The sequences performed for each patient included: T2-weighted (T2w); fluid-attenuated inversion recovery (FLAIR); T1-weighted (T1w); APTW; and gadolinium contrast-enhanced T1-weighted (Gd-T1w). A fast 3D APTW imaging sequence (RF saturation power = 2 μT; saturation time = 800 ms; 15 slices; slice thickness = 4.4 mm) was used (7). To correct for B0 field inhomogeneity effects, APTW imaging was acquired with a six-offset protocol (±3, ±3.5, ±4 ppm from water), together with a WASSR B0 scan (10). The APTW scan time was 8 min 6 sec. APT-weighted (APTW) images were calculated using MTRasym(3.5ppm) (4-7).
Histopathological and image analysis
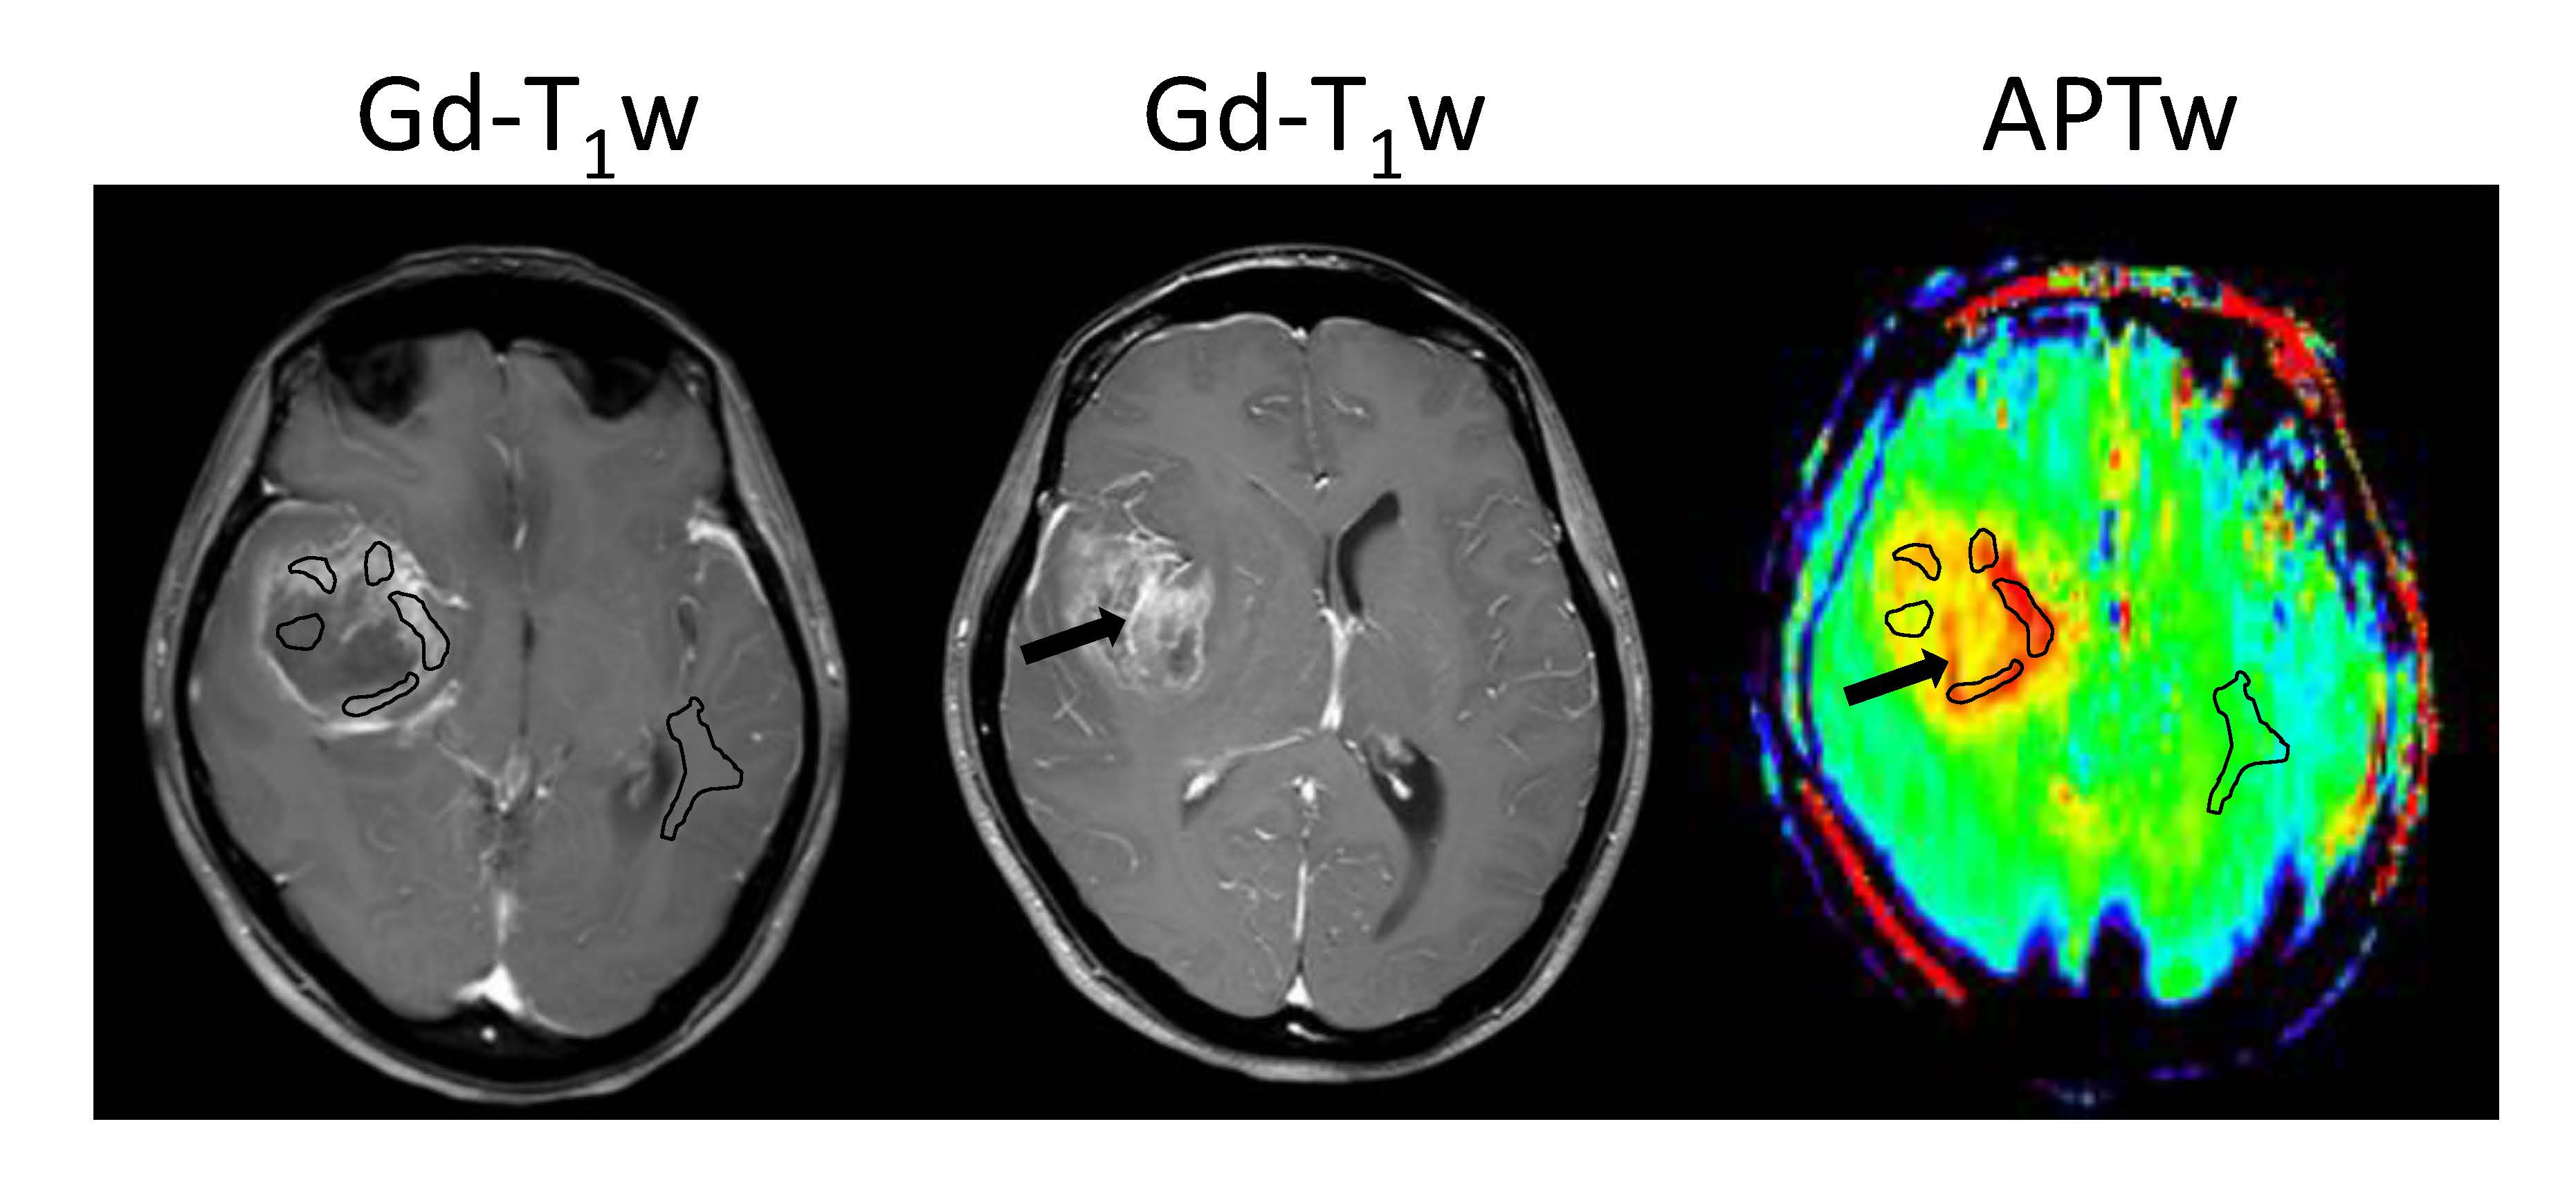
Patients proceeded with their clinically indicated brain biopsy after MRI scanning, including regions with APTw hyperintensity. Histopathology was reviewed by an experienced neuropathologist, blinded to the imaging features. The MGMT methylation status was assessed by methylation-specific polymerase chain reaction or immunohistochemical stain. Quantitative APTW image analysis was performed by a neuroradiologist. For each patient, the maximum and minimum APTW signals (APTWmax and APTWmin), the average APTW signal (APTWave), and the APTW signal heterogeneity (APTWhet = APTWmax - APTWmin) among five regions of interesting within a lesion were obtained, and the APTW signal intensities compared with the contralateral normal brain area were reported (Fig. 1).
Statistical analysis
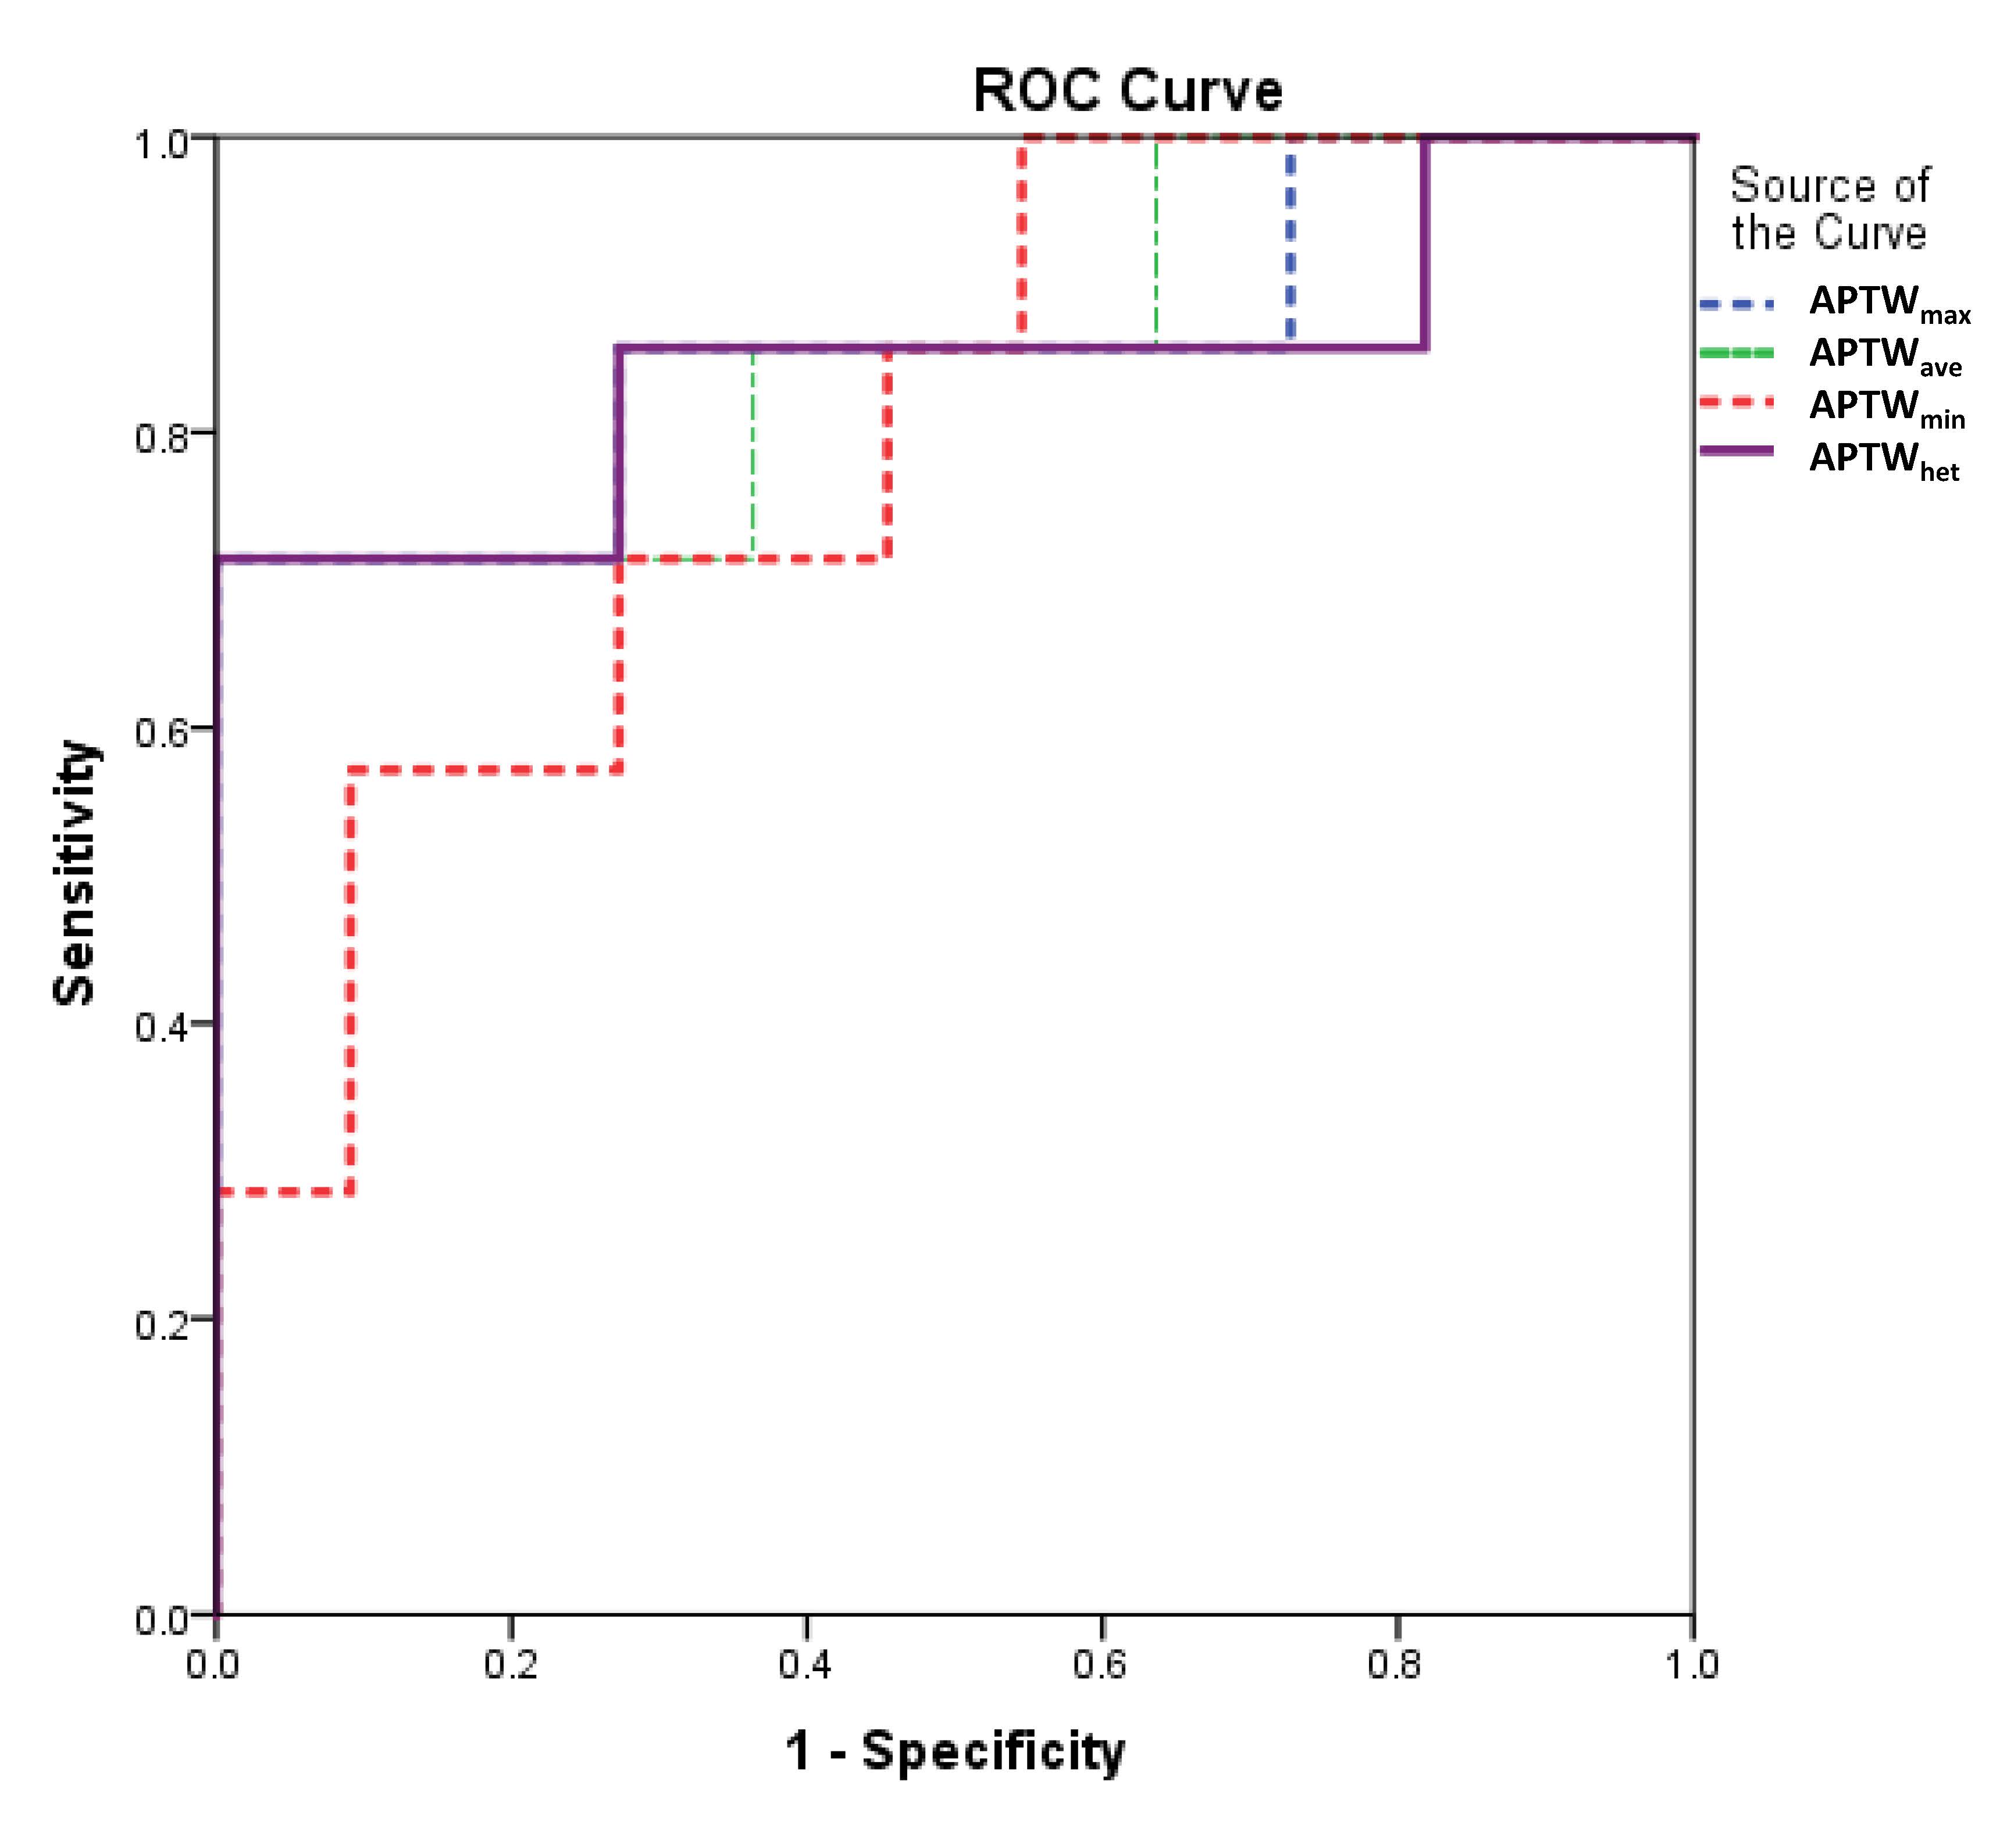
The comparisons of APTWmax, APTWmin, APTWave and APTWhet between the methylated MGMT GBMs and unmethylated MGMT GBMs were performed using an independent samples t-test to analyze the statistical differences. The accuracy for the discrimination of methylated MGMTs and unmethylated MGMTs were further calculated, and the corresponding optimal cut-off values were determined by a receiver operator characteristics (ROC) analysis. The alpha level of all tests was set at P < 0.05.
Results and Discussion
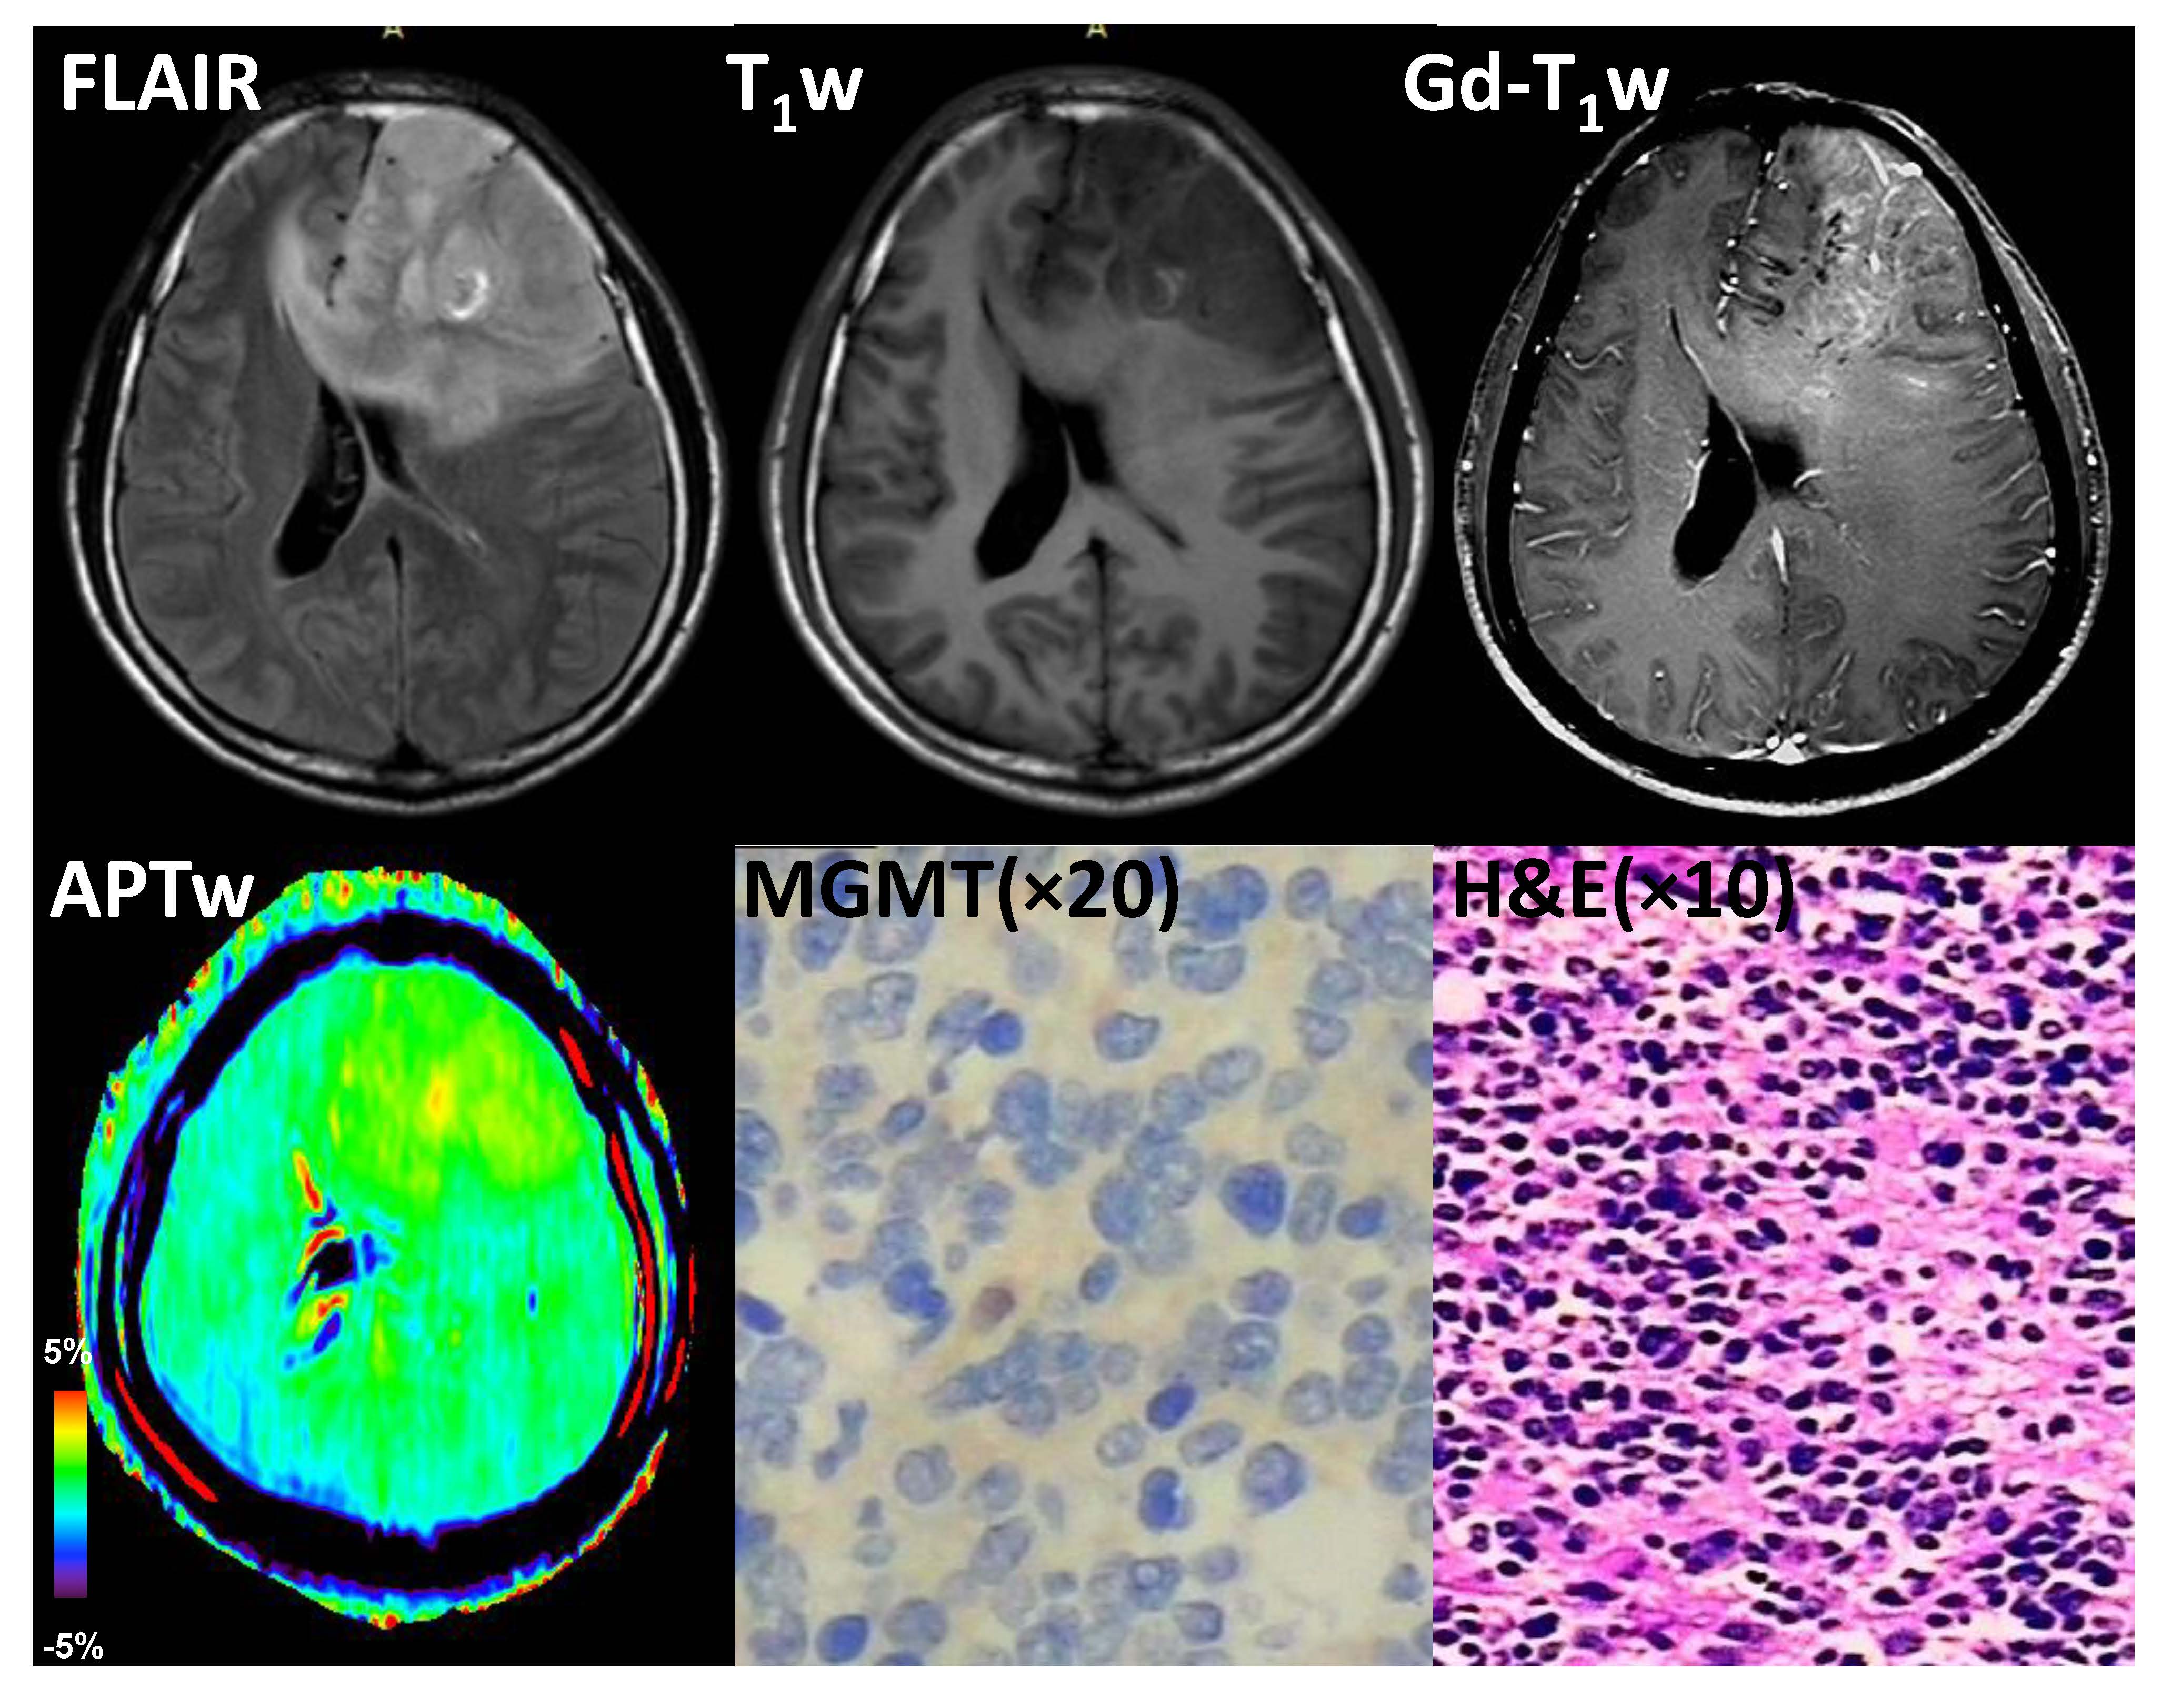
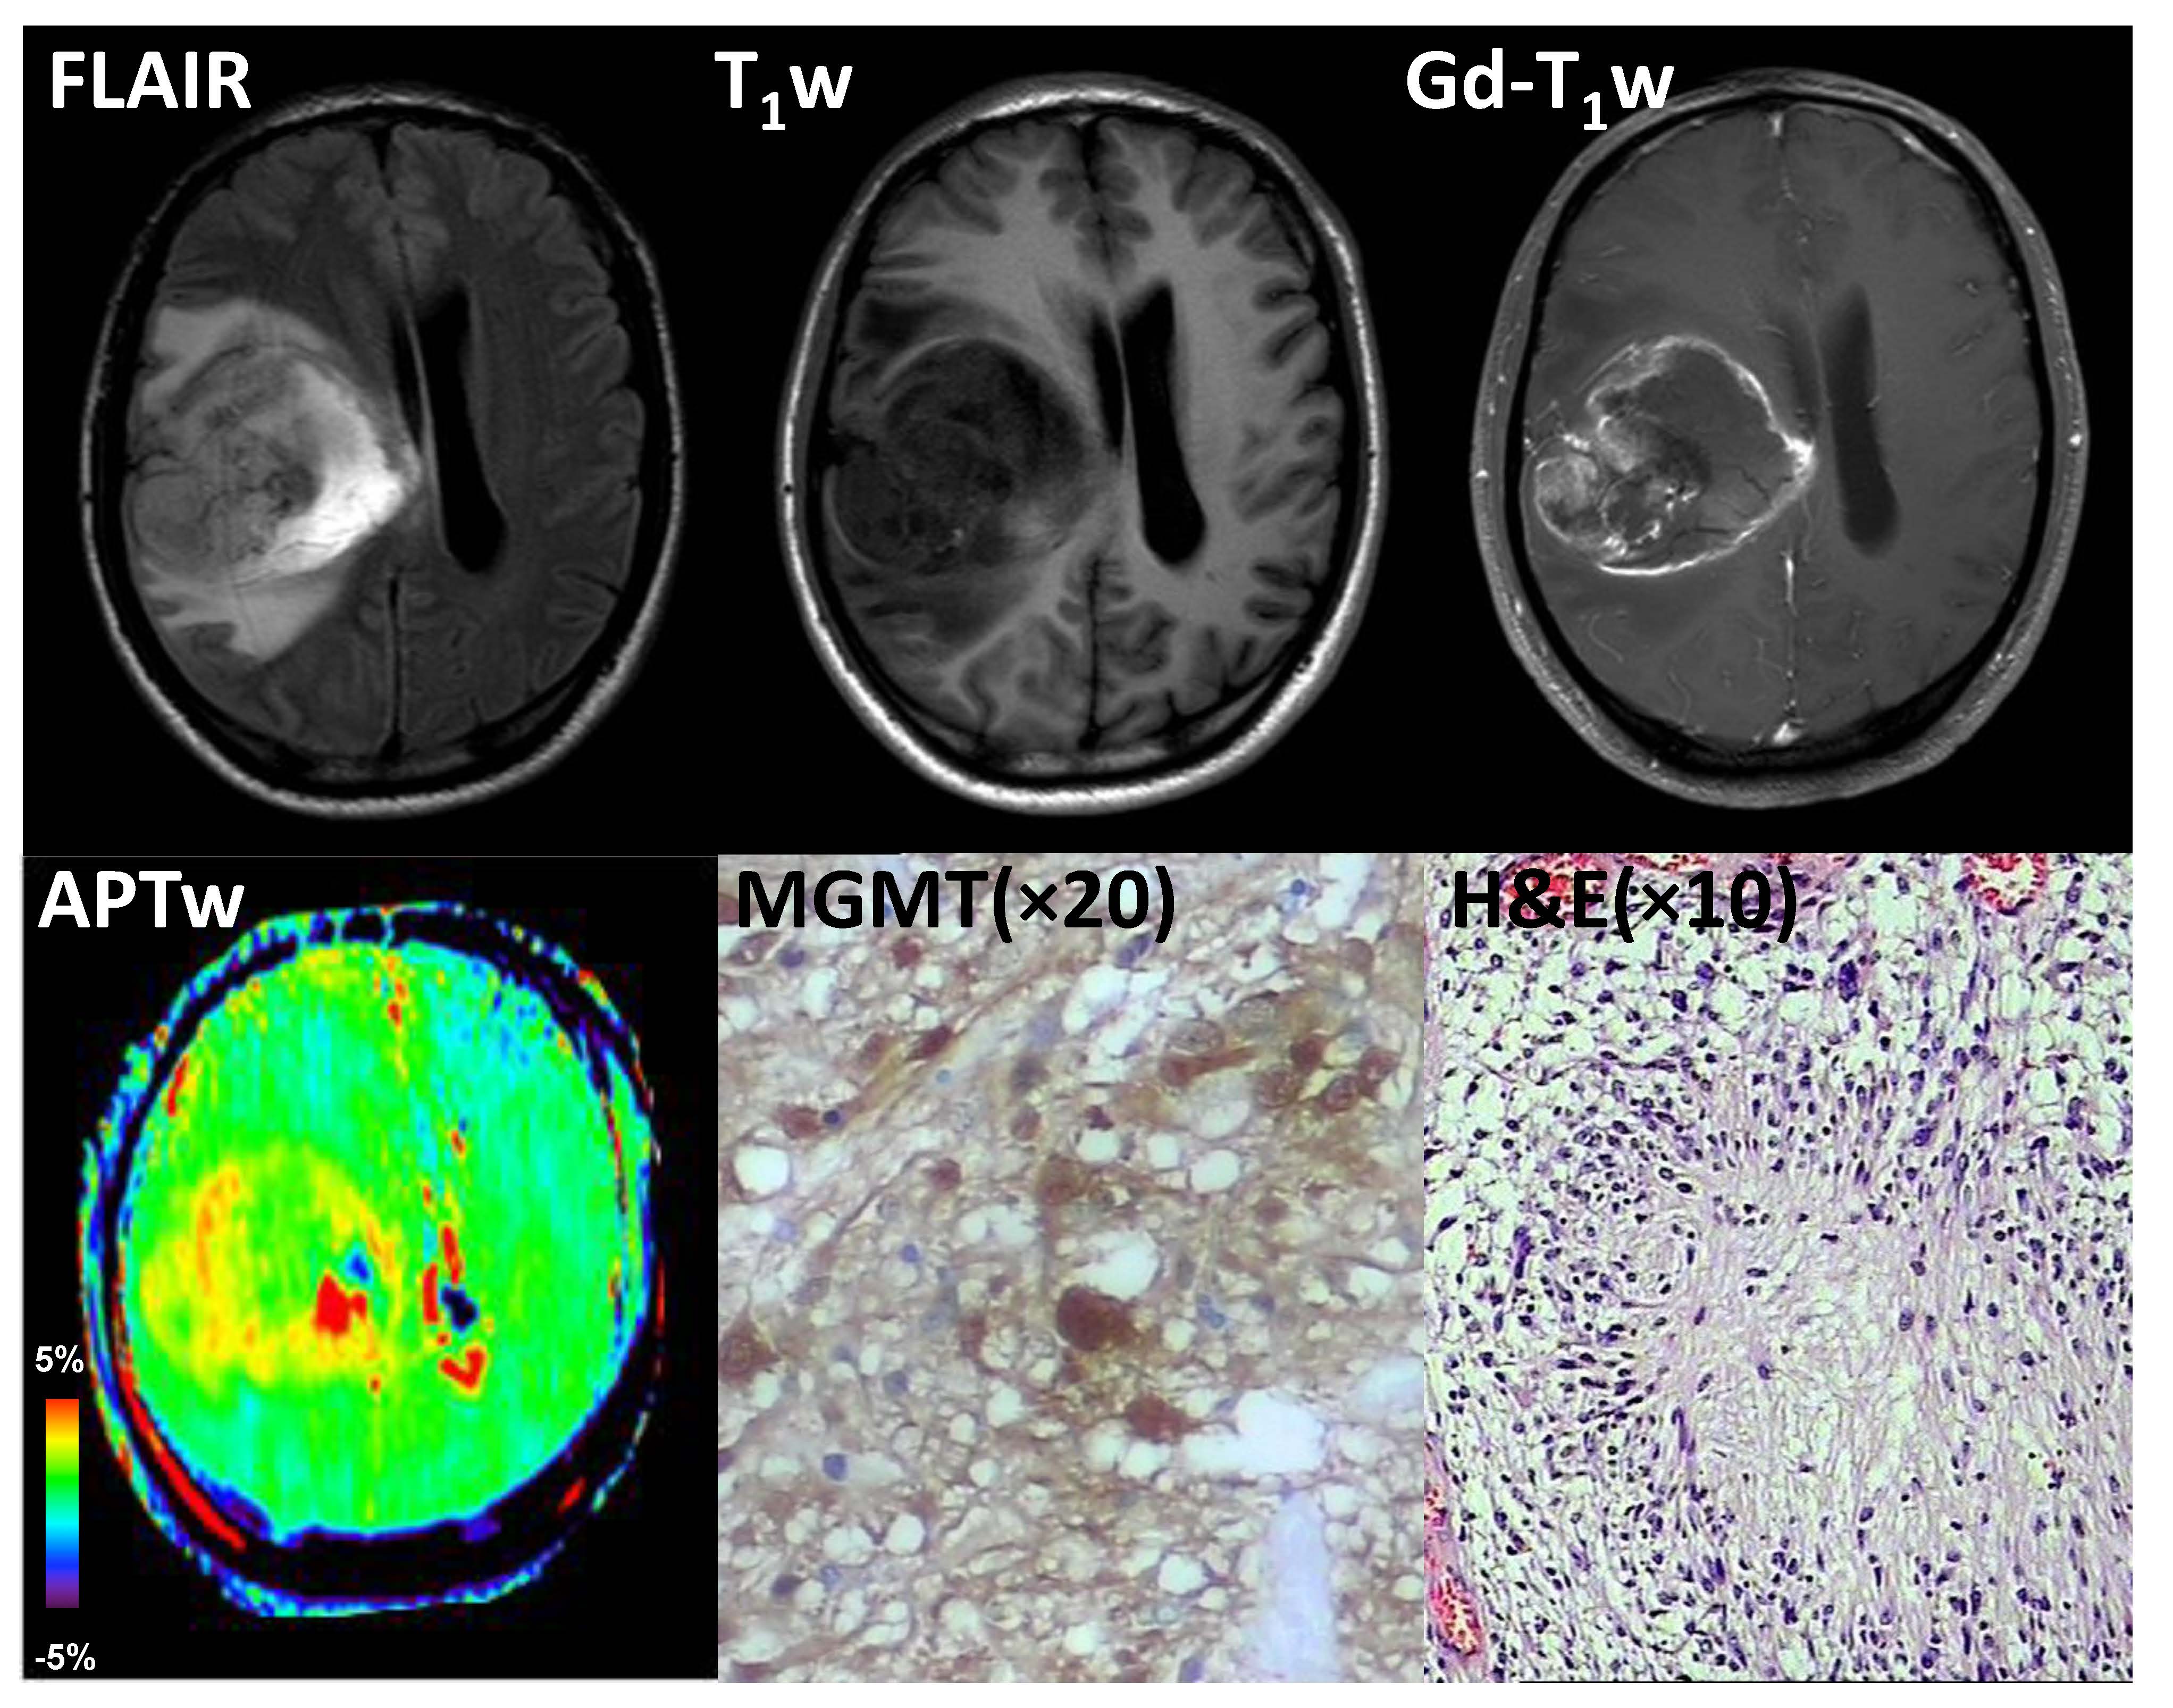
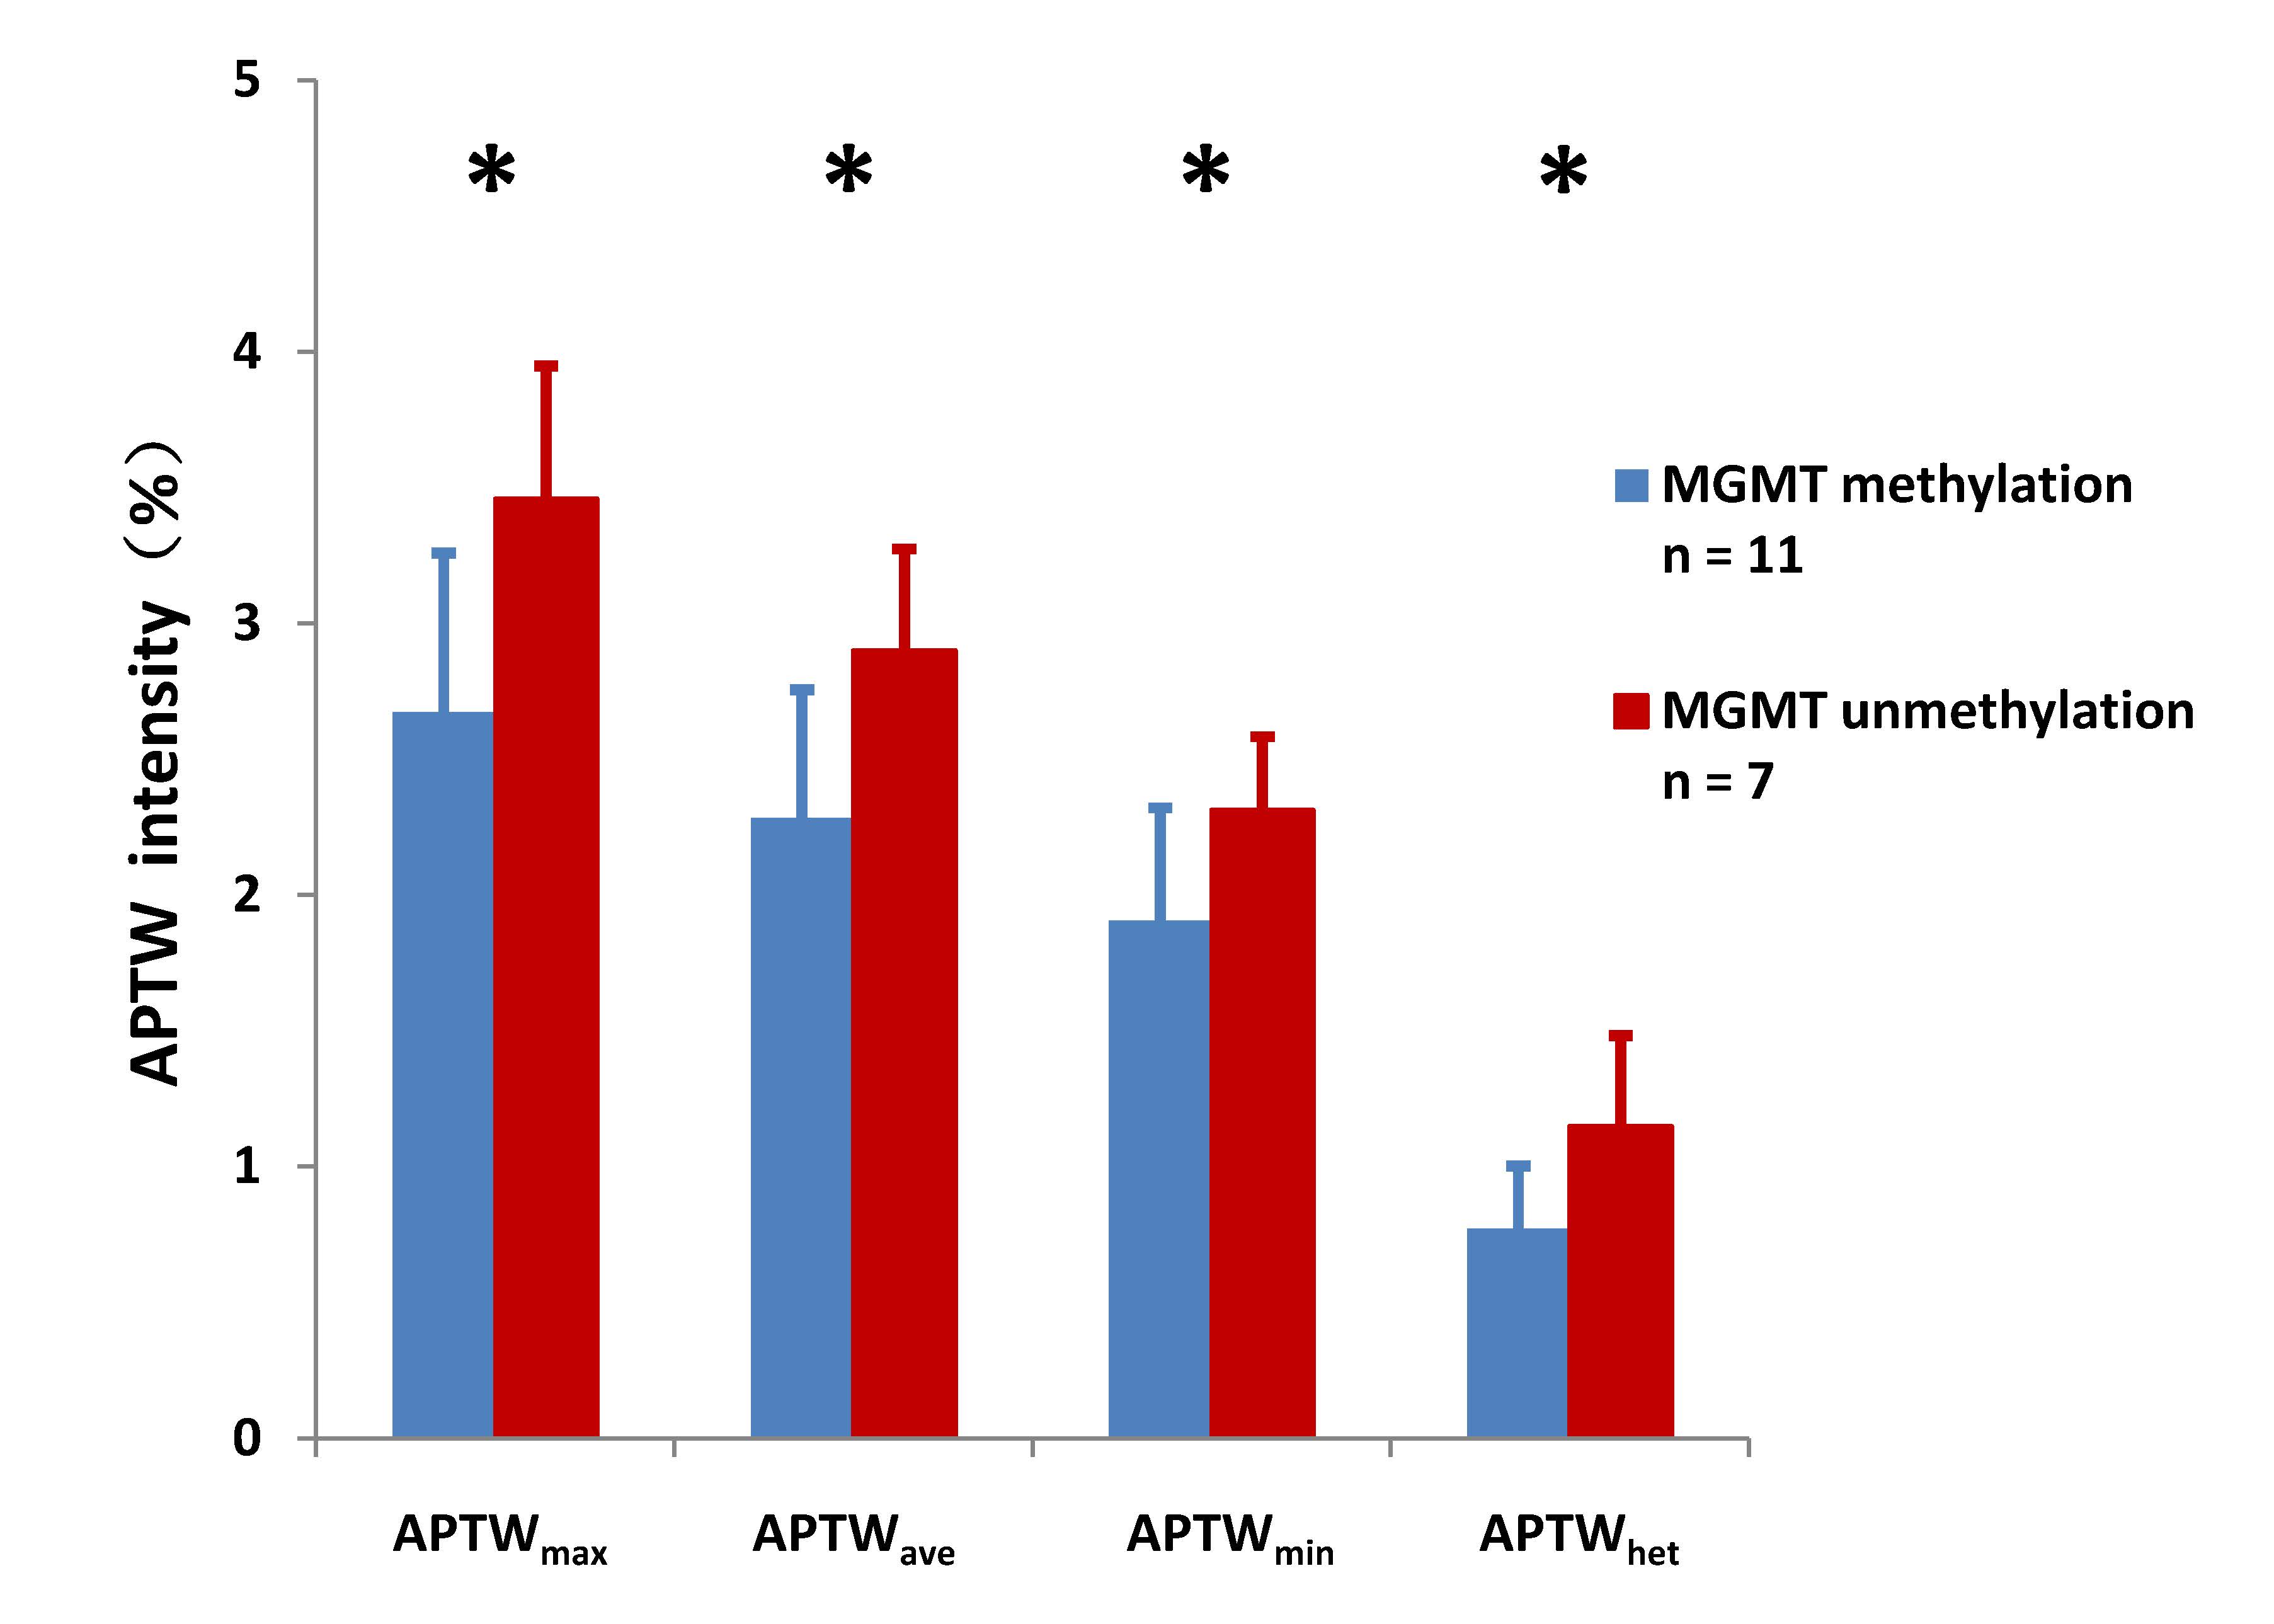
Eleven patients with GBM were confirmed as MGMT promoter methylated, and the remaining seven patients were confirmed as unmethylated. Most GBMs with unmethylated MGMT demonstrated heterogeneous, strong hyperintensity on APTW images (Fig. 2), while most GBMs with methylated MGMT showed relatively homogeneous, moderate APTW hyperintensity (Fig. 3). The unmethylated MGMT group has significantly higher APTWmax (3.46 ± 0.49% vs. 2.67 ± 0.59%); APTWave (2.90 ± 0.37% vs. 2.28 ± 0.47%); APTWmin (2.31 ± 0.27% vs. 1.90 ± 0.42%); and APTWhet (1.15 ± 0.33% vs. 0.77 ± 0.23%) than the methylated MGMT group (Fig. 4). Thus, MGMT methylation status in GBM is correlated to APTW imaging signatures. Based on the ROC analysis using the pathological results as the gold standard, APTWmax and APTWave had the highest area under the curve (0.857) and accuracy (90.4 %) in differentiating GBMs with methylated MGMT from unmethylated MGMT GBMs (Fig. 5).Conclusion
Our early results suggest that GBMs with methylated MGMT are typically associated with relatively homogeneous, moderate APTW hyperintensity. The APTW signal is a valuable imaging biomarker for identifying MGMT methylation status of GBM, which is of paramount importance for the management of alkylating agent chemotherapy.Acknowledgements
This work was supported in part by grants from the NIH (EB009731, CA166171, EB015032, and EB015909).References
(1) Hegi et al. NEJM 352, 997 (2005). (2) Diehn et al. PNAS 105, 5213 (2008). (3) Pope et al. Radiology 249, 268 (2008). (4) Zhou et al. Nature Med. 9, 1085 (2003). (5) Wen et al. NeuroImage 51, 616 (2010). (6) Togao et al. Neuro-oncology 16, 441 (2014). (7) Zhou et al. JMRI 38, 1119 (2013). (8) Jia et al. JMRI 33, 647 (2011). (9) Dula et al. MRM 70, 216 (2013). (10) Kim et al. MRM 61, 1441 (2009).Figures