0189
A test-retest analysis of brain volume measurement techniques1Image Sciences Institute, University Medical Center Utrecht, Utrecht, Netherlands, 2Department of Neurology, University Medical Center Utrecht, Utrecht, Netherlands, 3Department of Radiology, University Medical Center Utrecht, Utrecht, Netherlands
Synopsis
Brain volume measurements should both be accurate and precise. Accuracy of brain segmentation techniques is well studied. With the availability of test-retest datasets, precision (low coefficient of variation (COV)) can be investigated. In this work, we studied the COV of the FSL, SPM, and CAT12 software packages on 120 3T brain MR images of three subjects (40 images each) and compare it to previous results of FreeSurfer on this dataset. CAT12 performs best on total gray matter, white matter, and brain volume; whereas FSL has the lowest COV for CSF. COV values should be considered when studying brain volume change.
Purpose
Brain volume measurements are essential for the diagnosis and monitoring of neurodegenerative diseases1–3. Furthermore, population studies have shown a natural brain volume decrease of 0.3 percentage point per year above 60 years of age4. In order to detect and quantify such small changes, brain volume measurements must be of high quality.
Both accuracy (closeness to the “real volume”, often derived from manual measurements) and precision (low coefficient of variation (COV)) are important to consider when choosing a brain segmentation technique for volumetric measurements. The accuracy of various techniques is evaluated in the MRBrainS challenge framework1, including popular packages as FreeSurfer5,6, FSL7, and SPM8. In this challenge, brain segmentation techniques are compared against manual delineations and ranked accordingly.
The COV can be evaluated with a test-retest dataset. Recently, a dataset of 120 T1-weighted volumes (3 subjects, 20 sessions, 2 scans/session; acquired over 31 days) has been made available9. It was used to show that the FreeSurfer package has a COV for subcortical structures between 1.6% (caudate) and 6.1% (thalamus), and 0.9% for total white matter. In this work, we investigate the test-retest performance of FSL (v5.0.9), SPM (v6685), and CAT12 (v1004)10. The latter is an SPM toolbox and currently the best-ranked freely available technique in the MRBrainS challenge results.
Methods
The test-retest dataset consisted of 120 3T T1-weighted images, acquired at a GE MR750 scanner using the Alzheimer’s Disease Neuroimaging Initiative-recommended protocol9 (3D IG-SPGR; TR/TI/TE: 7.3/400/3 ms; voxel-size: 1.05×1.05×1.20 mm).
All techniques were applied with their default settings, except for CAT12 where WMHC=2 as used for the MRBrainS challenge results. However, since no white matter hyperintensities (WMH) were present in the test-retest dataset, this should not influence results.
The COV (= standard deviation divided by the mean times 100%) was computed for total gray matter (GM), white matter (WM), cerebrospinal fluid (CSF), brain (= GM+WM), and intracranial volume (ICV = GM+WM+CSF). For CAT12, we additionally computed the COV for 68 brain regions delineated in the CAT12-provided Hammers atlas11,12.
Results
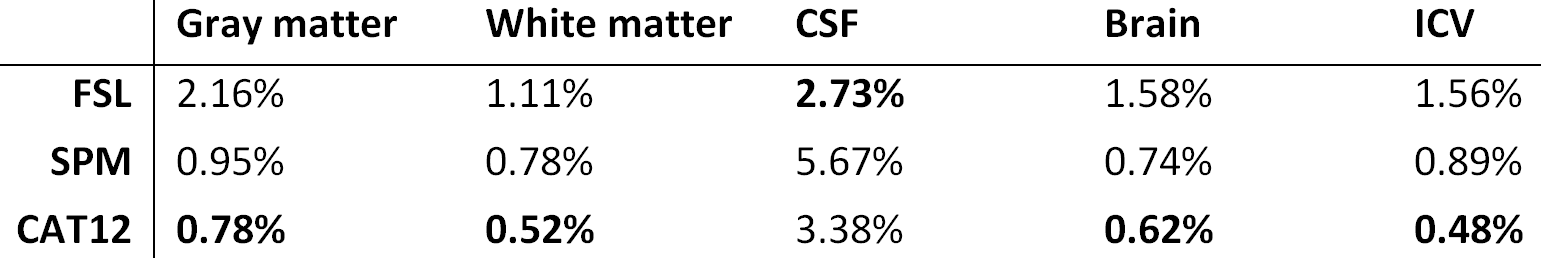
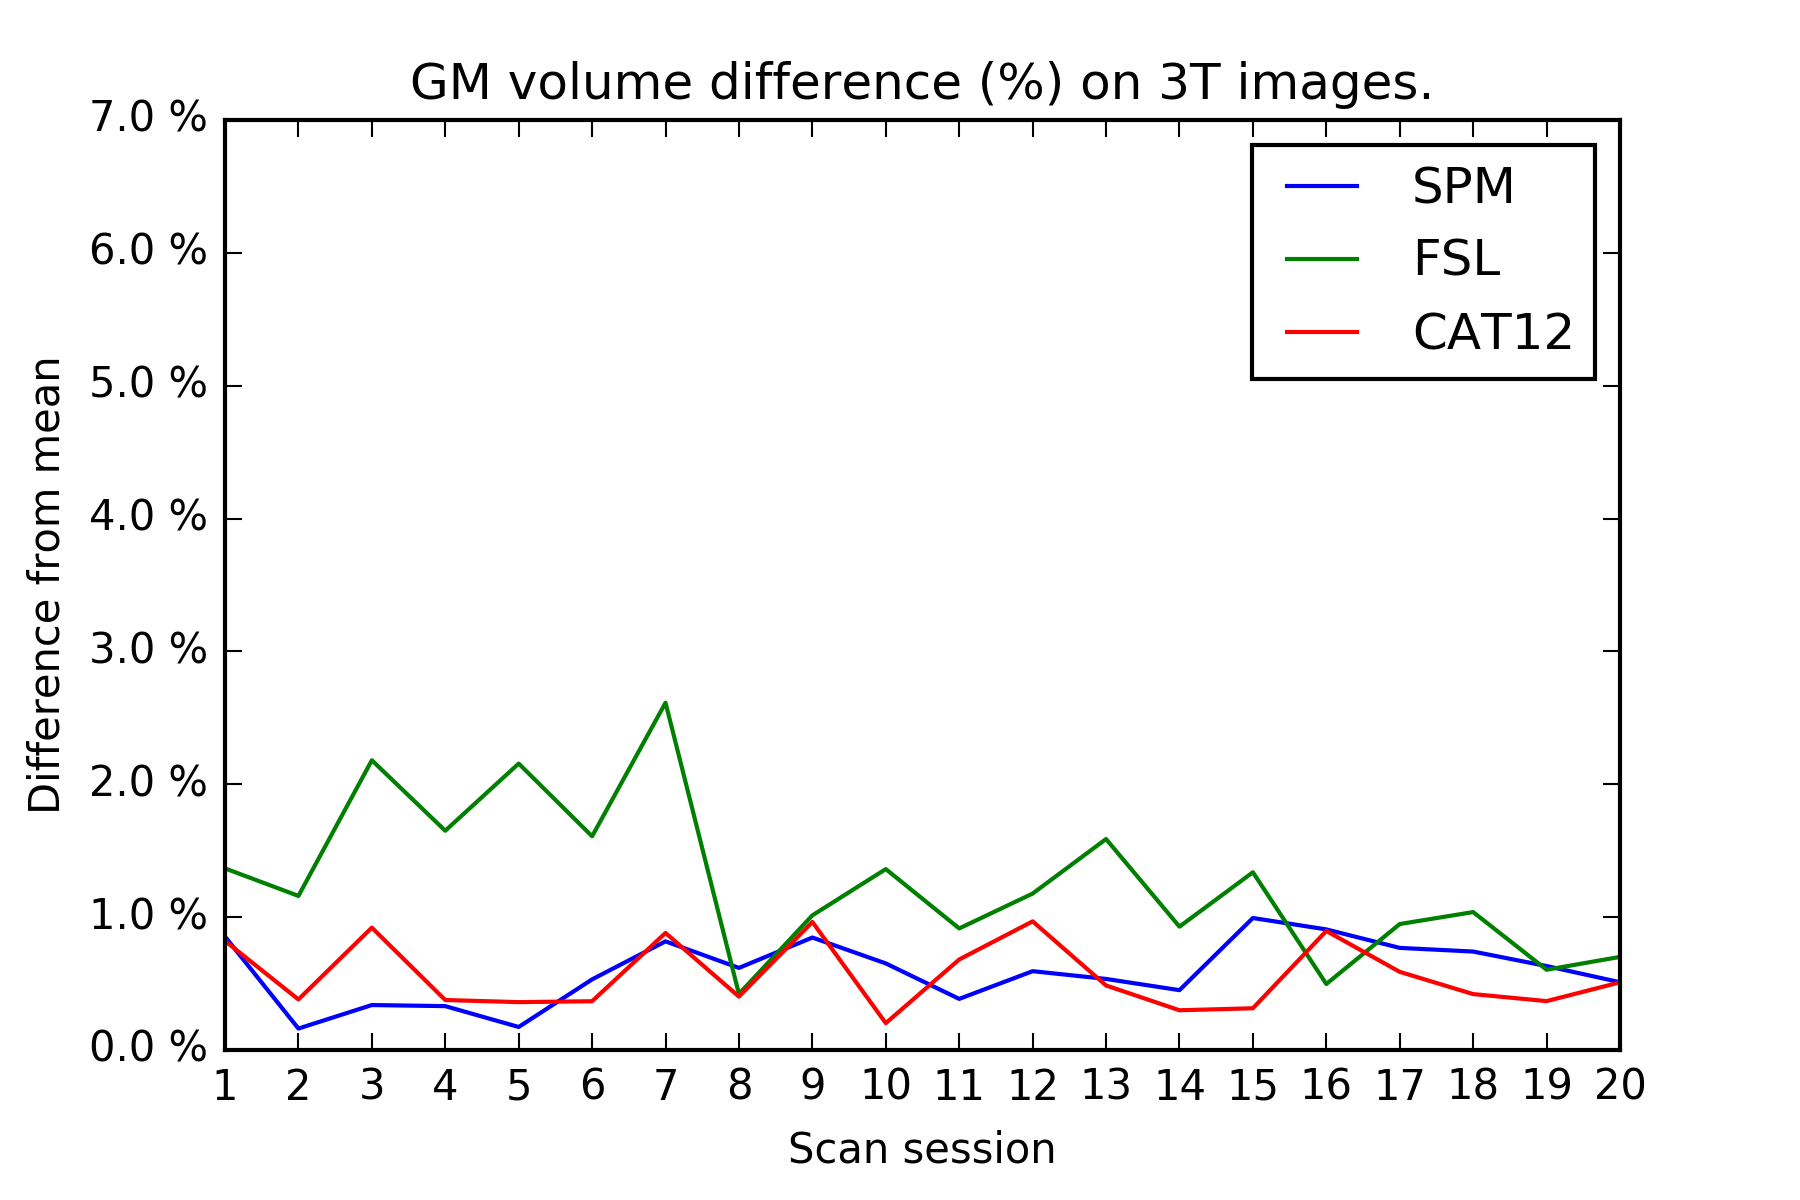
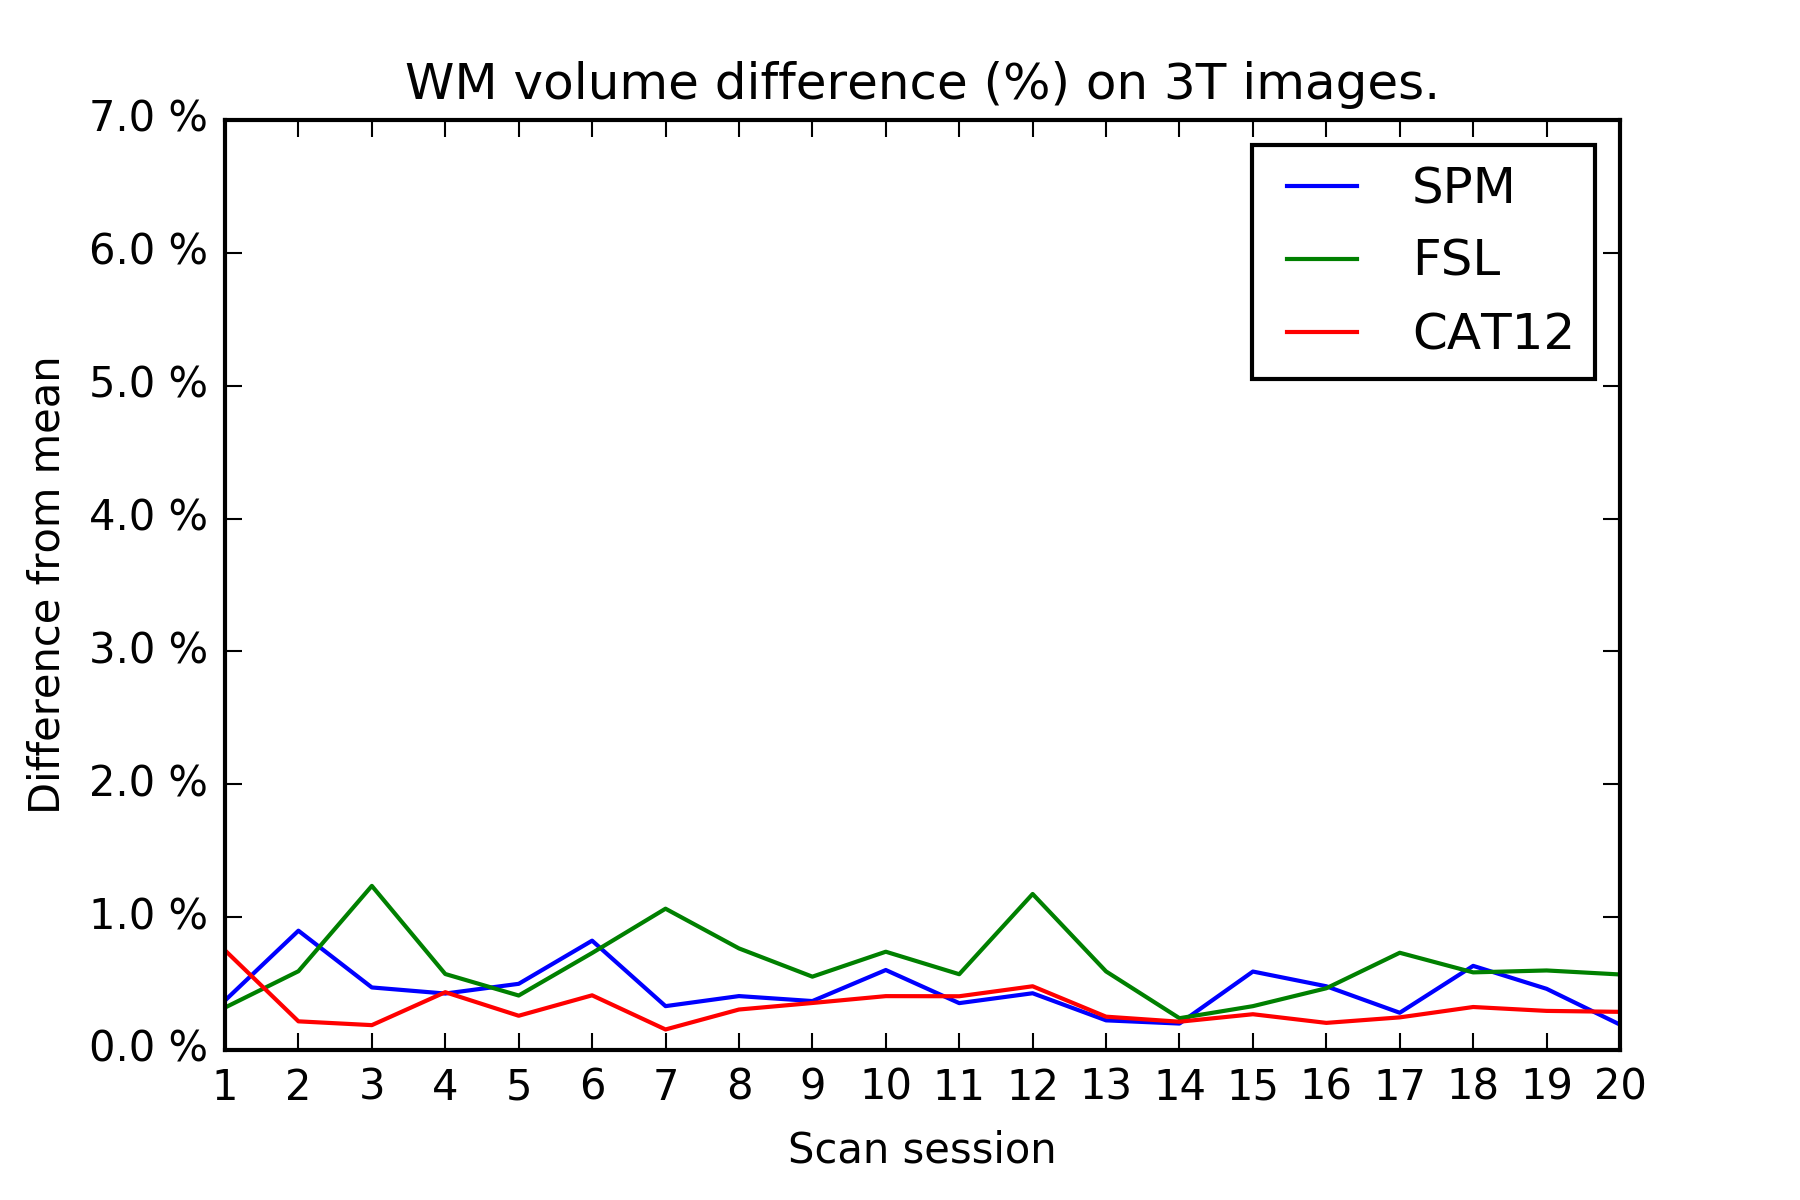
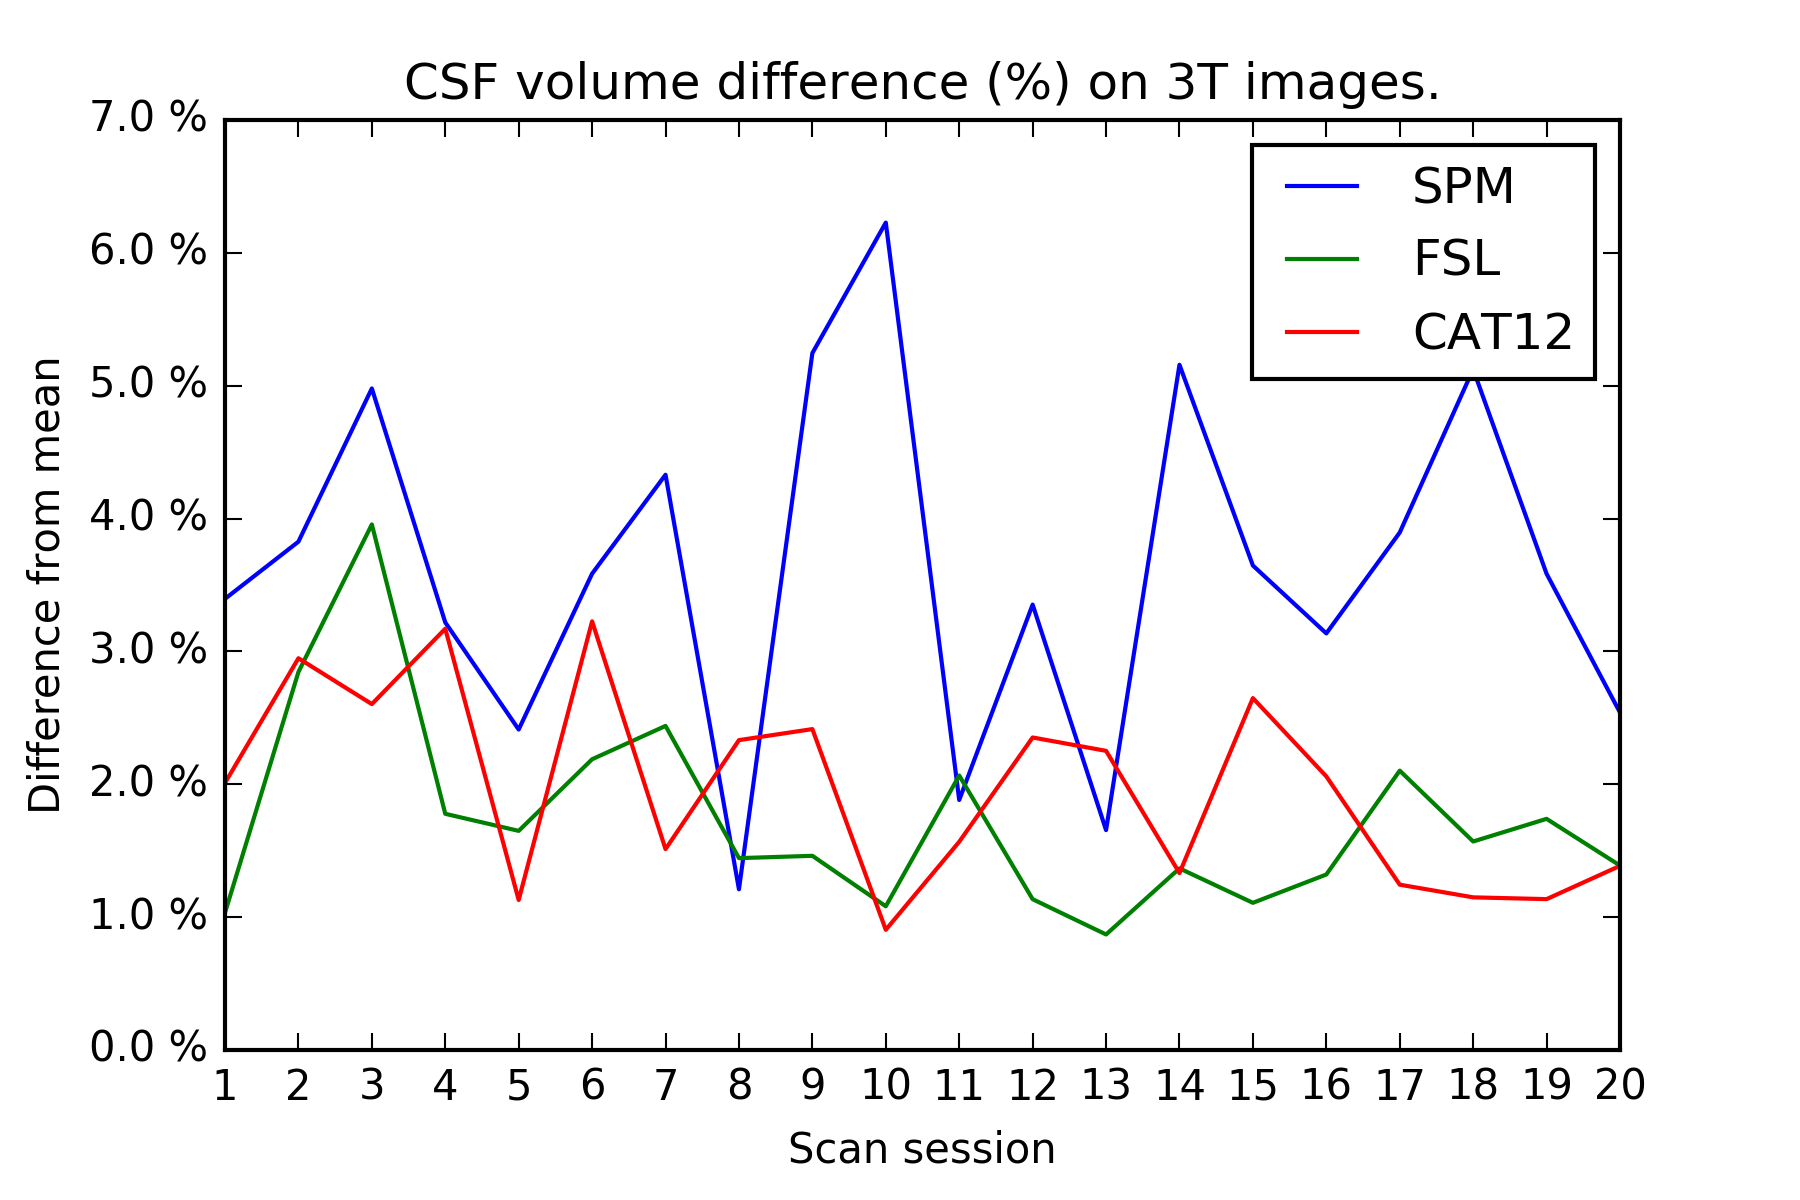
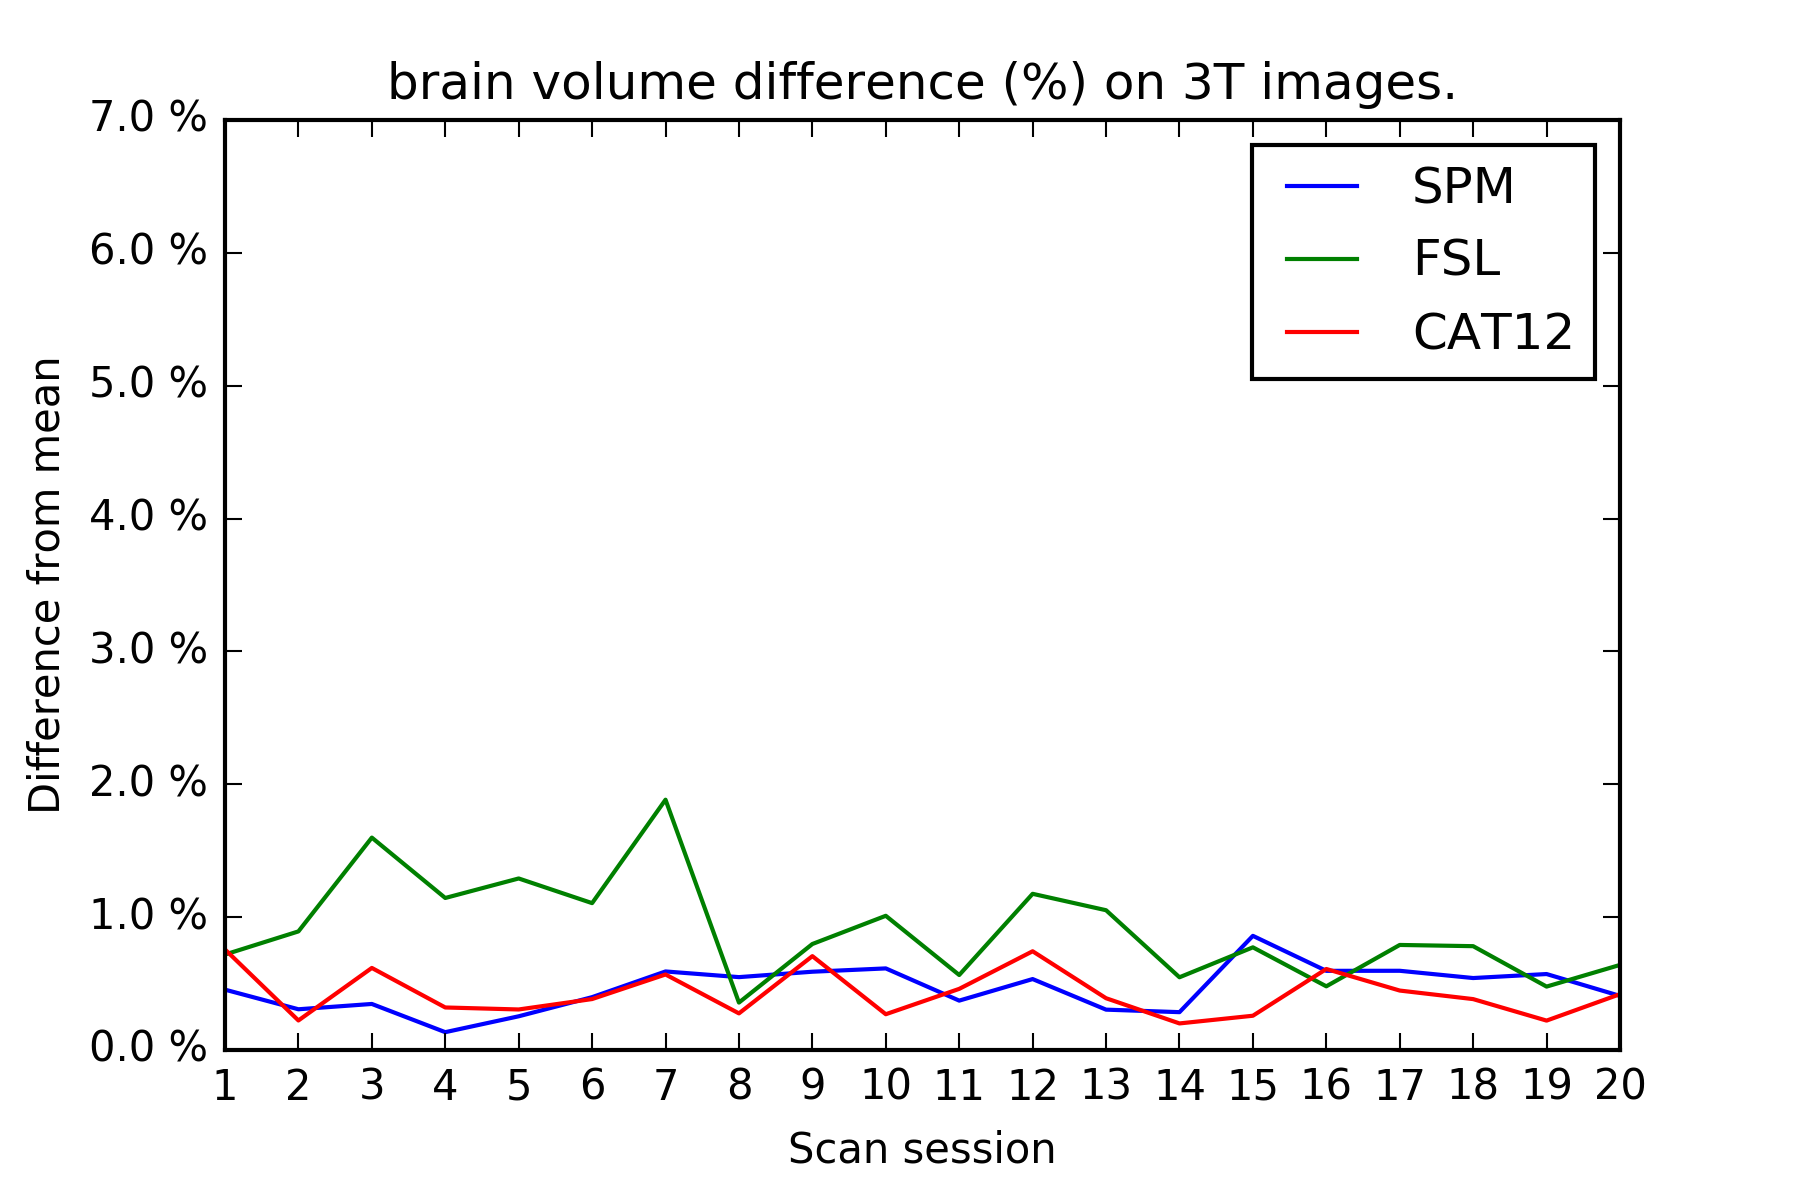
On the test-retest dataset, the COV for total GM/WM/CSF/brain/ICV is provided in Table 1. FSL has the smallest COV for CSF, whereas CAT12 has the smallest COV for GM, WM, brain, and ICV. Inter-session differences are shown in Figures 1-4. The CAT12 COV for Hammers regions ranged from 0.45-4.43%.Discussion
The CAT12 brain volume measurements have considerably smaller COV for GM/WM/brain/ICV compared to FreeSurfer, FSL, and SPM on the exact same 3 T dataset. Previously, the MRBrainS challenge demonstrated that CAT12 also has more accurate volume measurements for total GM/WM/CSF. FSL has the smallest COV for CSF, but results from MRBrainS indicate that its accuracy is suboptimal.
FSL shows a remarkable improvement in GM volume differences after day 7 in Figure 1. However, visual inspection of the images before/after day 7 did not reveal any obvious causes for this effect and neither SPM nor CAT12 shows this effect.
The accuracy of CAT12 for smaller (sub)cortical regions still needs to be investigated, but it’s COV looks promising. Future work should additionally study accuracy and COV of non-volumetric measurements, e.g. cortical thickness, for both FreeSurfer and CAT12.
The total brain volume COV of all techniques is still larger than the yearly brain volume decrease above 60 years of age. This should be taken into account in (longitudinal) studies looking into brain volume change of patients with neurodegenerative diseases.
Conclusion
The precision of popular brain volume measurements techniques was investigated on a test-retest dataset. The CAT12 software shows good accuracy and precision for brain volume measurements. Accuracy and precision values should be taken into account when studying brain volume change. CAT12 outperforms the popular FreeSurfer, FSL, and SPM packages and might therefore be considered as the method of choice for future studies.Acknowledgements
No acknowledgement found.References
1. Mendrik, A. et al. MRBrainS Challenge: Online Evaluation Framework for Brain Image Segmentation in 3T MRI Scans. Comput. Intell. Neurosci. (2015). doi:10.1155/2015/813696
2. Giorgio, A. & De Stefano, N. Clinical use of brain volumetry. J. Magn. Reson. Imaging 37, 1–14 (2013).
3. Driscoll, I. et al. Longitudinal pattern of regional brain volume change differentiates normal aging from MCI.
4. Arfan Ikram, M. et al. Brain tissue volumes in the general elderly population The Rotterdam Scan Study. Neurobiol. Aging 29, 882–890 (2008).
5. Dale, A. M., Fischl, B. & Sereno, M. I. Cortical Surface-Based Analysis I. Segmentation and Surface Reconstruction. Neuroimage 9, 179–194 (1999).
6. Fischl, B. FreeSurfer. Neuroimage 62, 774–781 (2012).
7. Jenkinson, M., Beckmann, C. F., Behrens, T. E. J., Woolrich, M. W. & Smith, S. M. FSL. Neuroimage 62, 782–790 (2012).
8. Ashburner, J. & Friston, K. J. Unified segmentation. Neuroimage 26, 839–51 (2005).
9. Maclaren, J., Han, Z., Vos, S. B., Fischbein, N. & Bammer, R. Reliability of brain volume measurements: a test-retest dataset. Sci. data 1, 1–9 (2014).
10. Gaser, C. CAT: A Computational Anatomy Toolbox for SPM. http://dbm.neuro.uni-jena.de/cat/
11. Hammers, A. et al. Three-dimensional maximum probability atlas of the human brain, with particular reference to the temporal lobe. Hum. Brain Mapp. 19, 224–247 (2003).
12. Gousias, I. et al. Automatic segmentation of brain MRIs of 2-year-olds into 83 regions of interest. Neuroimage 40, 672–684 (2008).
Figures