0188
Consistency of Inter-Database Cortical Thinning with Age1Departments of Radiology and Clinical Neurosciences, University of Calgary, Calgary, AB, Canada, 2Department of Biomedical Engineering, McGill University, Montreal, QC, Canada, 3Seaman Family MR Research Centre, Foothills Medical Centre, AB, Canada
Synopsis
This work investigates cerebral cortical thinning as a function of age, and how this relationship varies between four healthy subject databases, with a consolidated 1,382 subjects. Cortical thickness measurements of each subject were computed for 68 regions. Linear regression was used to determine the thinning rate for each region in each database as well as for the consolidated database. ANCOVA tests were run to test the effect of database. Correlation matrices were used to test the intra-relationship of locations between databases. Statistically significant correlations were found with age and differences were found between databases in all regions.
Introduction
The thickness of the cerebral cortex is known to change with age. This effect has been shown in single database studies and reproduced in subsequent studies.1-6 However, discrepancies exist regarding the rate of cortical thinning between different studies. This could be attributed to acquisition methodology, processing technique, or variations in the studied populations.
In this work, we compare four large lifespan databases, each with >150 subjects, and investigate the rate of change in thickness of the parcellated cerebral cortex. An analysis is performed for each region to assess cortical thickness variations between databases. The correlation coefficients between measurement locations are also calculated for each database and the consolidated database.
Methods
T1-weighted structural anatomical scans from four large databases were gathered: 1) The Calgary Normative Database, 2) The Open Access Series of Imaging Studies (OASIS) database,3 3) The Information eXctraction of Images (IXI) database,4 and 4) the Dallas Lifespan Brain Study (DLBS) database.
The Calgary Normative Database was gathered in Calgary, AB. All subjects in this study were healthy subjects who tested above 26 on the Montreal Cognitive Assessment. 188 subjects were included (71-M,117-F;18-87y). The data was collected on a 3T General Electric (GE) scanner and the image resolution was 1 mm isotropic.
The OASIS database was collected in St. Louis, MI.3,7 All subjects in this study were right handed, had a normal Mini-Mental State Exam scoring and were otherwise healthy. A total of 316 subjects were included (119-M,197-F;18-96y). Acquisitions were performed on a 1.5T Siemens scanner. These T1-weighted images had a 1mm×1mm×1.25mm resolution. Post-processing on this data included facial feature removal to anonymize subjects before we obtained the data.
The IXI database was collected in London, UK.8 Images in this database were collected on three MR scanners (Philips 3T, Philips 1.5T, or GE 1.5T). A total of 563 subjects were included (250-M,313-F;20-86y). The images in this database had a resolution of 0.94mm×0.94mm×1.2mm.
The DLBS database was collected in Dallas, TX.9 Images were acquired on a Philips 3T. A total of 315 subjects were included from this database (117-M,198-F;20-89y). Image resolution was 1mm isotropic. Histograms of age are shown for each database in Figure 1.
The image analysis was performed consistently for all databases. Freesurfer (v5.3.0) was used to segment the cerebral cortex and parcellate it into 34 regions per hemisphere using the Desikan-Killiany1 atlas (Figure 2). Average thickness was calculated for each parcellated region and for each hemisphere resulting in 70 measurements per subject.
Thicknesses were correlated with age and linear regression performed. A Spearman rank test was performed in each region for each database. An ANCOVA test using age as a covariate was performed for each region to test for differences between databases. A threshold of p<0.05 was considered significant. Correlation matrices were used to evaluate relationships between regions in each database.6
Results
The Spearman Rank tests were significant in all regions and databases except: bilateral temporal pole, entorhinal, L-medial orbitofrontal, L-cuneus, L-caudal anterior cingulate, R-insula, R-rostral anterior cingulate, R-pericalcarine, and R-inferior temporal. The ANCOVA tests showed significant differences between databases in all regions.
Linear regressions for two parcellated right-hemisphere regions: banks superior temporal sulcus and parahippocampal gyrus, are shown in Figure 3. These regions highlight instances where the slopes are consistent and inconsistent, respectively.
Figure 4 shows the rates of thinning, averaged between hemispheres bilaterally. In general there tended to be higher rates of thinning in the IXI and DLBS databases. Measurements were in range of independent measurements reported in Reference 2.
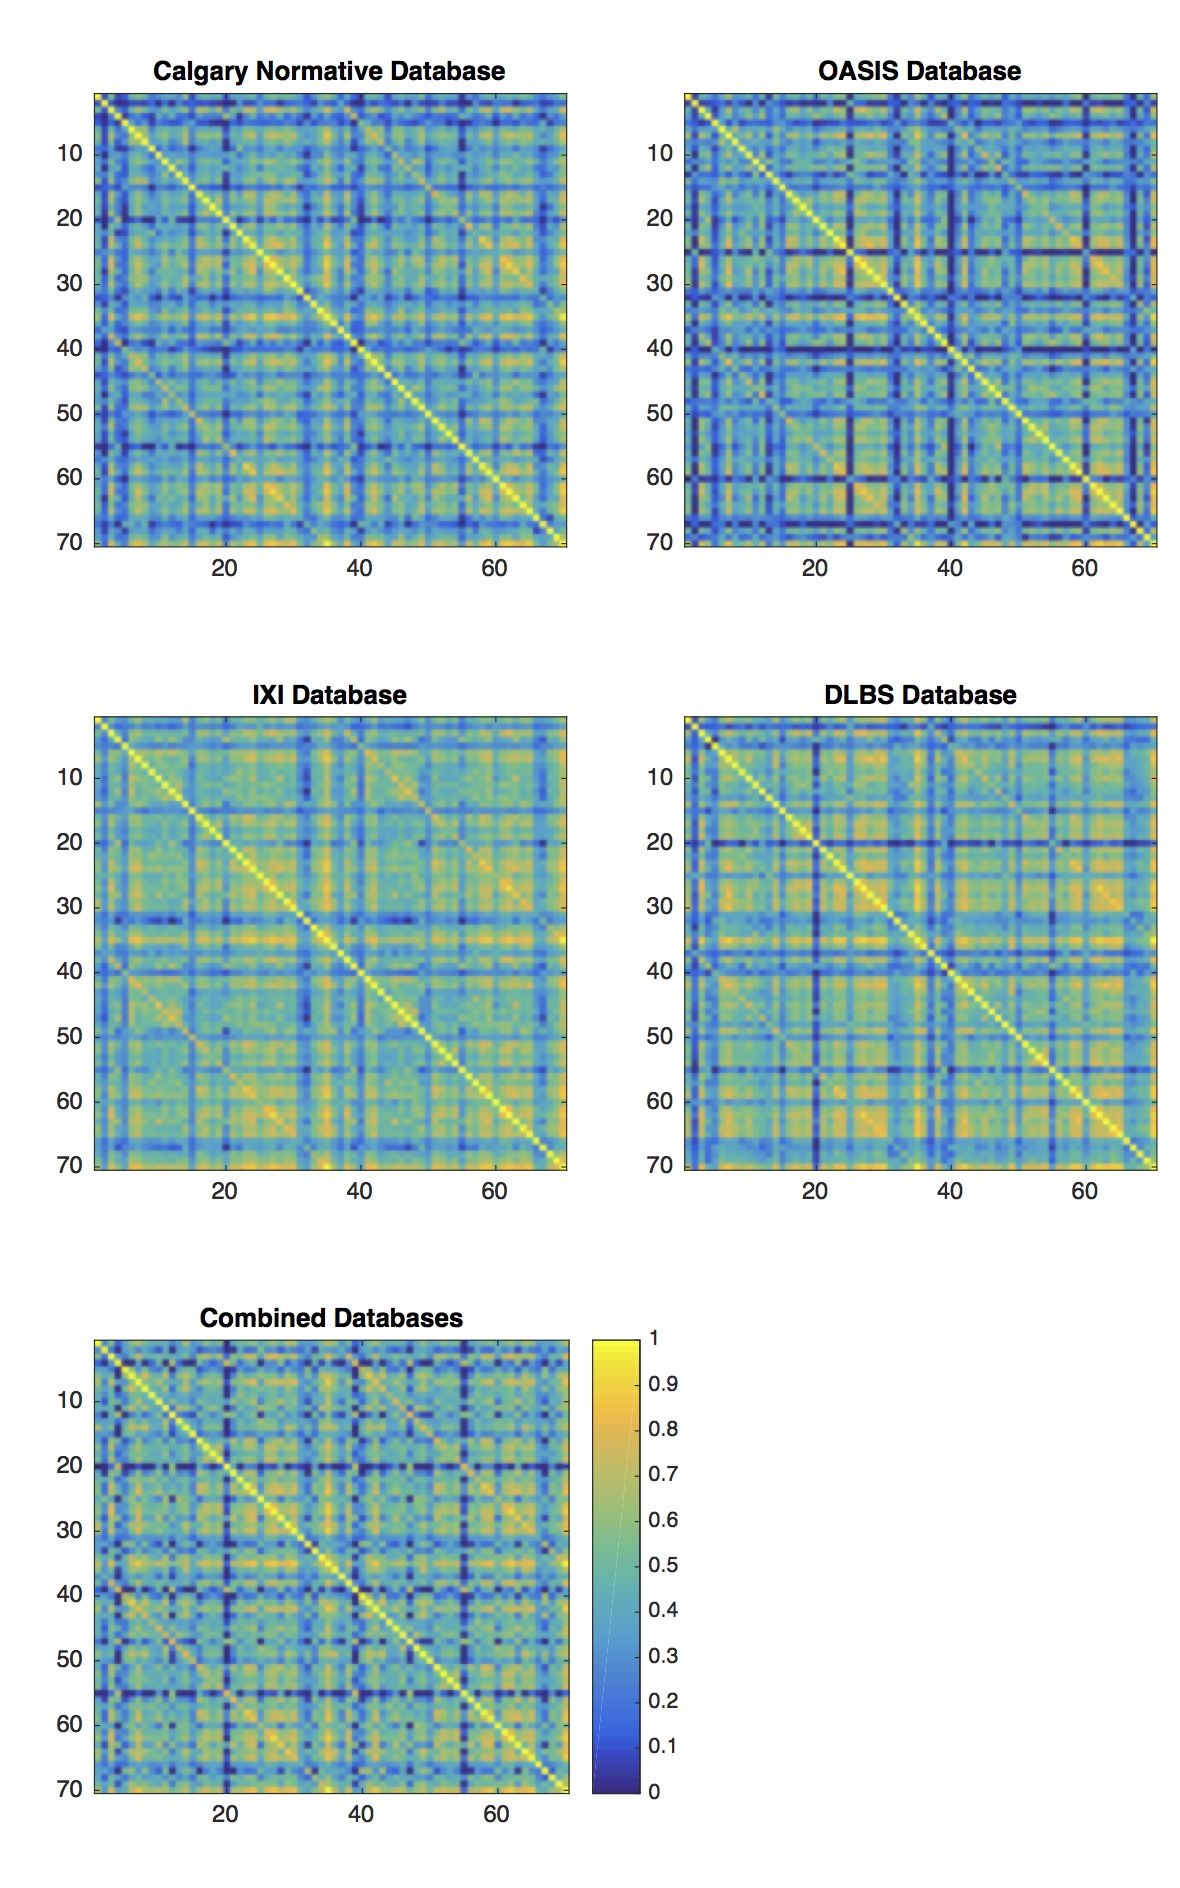
The correlation matrices are shown in Figure 5. This metric shows how independent each cortical region is from all the other regions. The principal observation from this figure is the consistency of regions of higher correlation between databases.
Discussion
A total of 1,382 subjects were included from four databases, which increased the statistical power and showed small but statistically significant differences between databases. The fact that the differences are small, despite significant acquisition protocol differences, gives confidence to this metric and demonstrates consistent cortical thinning trends.
There are many factors that are known to affect cortical brain structure, such as sex, hydration, and handedness. These parameters were not considered in this analysis since this information was not always reported in the databases, limiting the scope of this comparison.
As the processing methodology was consistent we can conclude that the deviations found between these databases did not arise from the processing and must be a result of the acquisition (e.g., field strength, voxel size) or the studied populations (four different groups with different age distributions).
Acknowledgements
Canadian Institutes of Health Research (FDN 143290)
Campus Alberta Innovates Program
References
1. Desikan RS, Ségonne F, Fischl B, Quinn BT, Dickerson BC, Blacker D, Buckner RL, Dale AM, Maguire RP, Hyman BT, Albert MS, Killiany RJ. An automated labeling system for subdividing the human cerebral cortex on MRI scans into gyral based regions of interest. Neuroimage 2006;31(3):968-980.
2. Lemaitre H, Goldman AL, Sambataro F, Verchinski BA, Meyer-Lindenberg A, Weinberger DR, Mattay VS. Normal age-related brain morphometric changes: nonuniformity across cortical thickness, surface area and gray matter volume? Neurobiol Aging 2012;33(3):617.e611-617.e619.
3. Marcus DS, Wang TH, Parker J, Csernansky JG, Morris JC, Buckner RL. Open Access Series of Imaging Studies (OASIS): Cross-sectional MRI Data in Young, Middle Aged, Nondemented, and Demented Older Adults. J Cogn Neurosci 2007;19(9):1498-1507.
4. Ericsson A, Aljabar P, Rueckert D. Construction of a patient-specific atlas of the brain: Application to normal aging. 2008 14-17 May 2008. p 480-483.
5. Gong G, He Y, Chen ZJ, Evans AC. Convergence and divergence of thickness correlations with diffusion connections across the human cerebral cortex. Neuroimage 2012;59(2):1239-1248.
6. Chen ZJ, He Y, Rosa-Neto P, Gong G, Evans AC. Age-related alterations in the modular organization of structural cortical network by using cortical thickness from MRI. Neuroimage 2011;56(1):235-245.
7. Open Access Series of Imaging Studies Webpage. http://www.oasis-brains.org
8. IXI Database Website. http://brain-development.org/ixi-dataset/
9. Dallas
Lifespan Brain Study Webpage.
http://fcon_1000.projects.nitrc.org/indi/retro/dlbs.html
Figures