0171
Imaging c-Myc: Identification of metabolic phenotypes using MRSI of hyperpolarised [1-13C]pyruvate to [1-13C]lactate flux in glioblastoma patient-derived orthotopic xenografts.1CRUK Cambridge Institute, University of Cambridge, Cambridge, United Kingdom, 2Division of Neurosurgery, Cambridge University Hospitals NHS Trust, Cambridge, United Kingdom
Synopsis
Heterogeneity at both a genomic and phenotypic level is extant within glioblastoma. We hypothesised that imaging of the flux from hyperpolarised [1-13C]pyruvate to [1-13C]lactate may inform upon this heterogeneity. We used patient derived orthotopic xenograft cohorts to identify differential lactate labelling and have related this to both glycolytic enzyme and c-Myc expression.
Introduction
Cancer progression and response to treatment depends on the interplay between tumor genotype and microenvironment. Modern genomic techniques are being used for in vivo genotype analysis however the ability to identify phenotype, such as highly glycolytic tumor regions, may enable the deployment of novel therapeutics as well as more precise targeting of heterogeneous areas within a tumor for radiotherapy (1,2). We have explored the extent to which 13C hyperpolarised MRSI can interrogate tumor metabolic phenotype (and underlying genotype) within cohorts of patient-derived orthotopic xenograft (PDOX) models of glioblastoma (GB). We have demonstrated metabolic heterogeneity that correlates with expression of c-Myc and glycolysis-related enzymes, which has implications for prognostication and targeted therapy.Methods
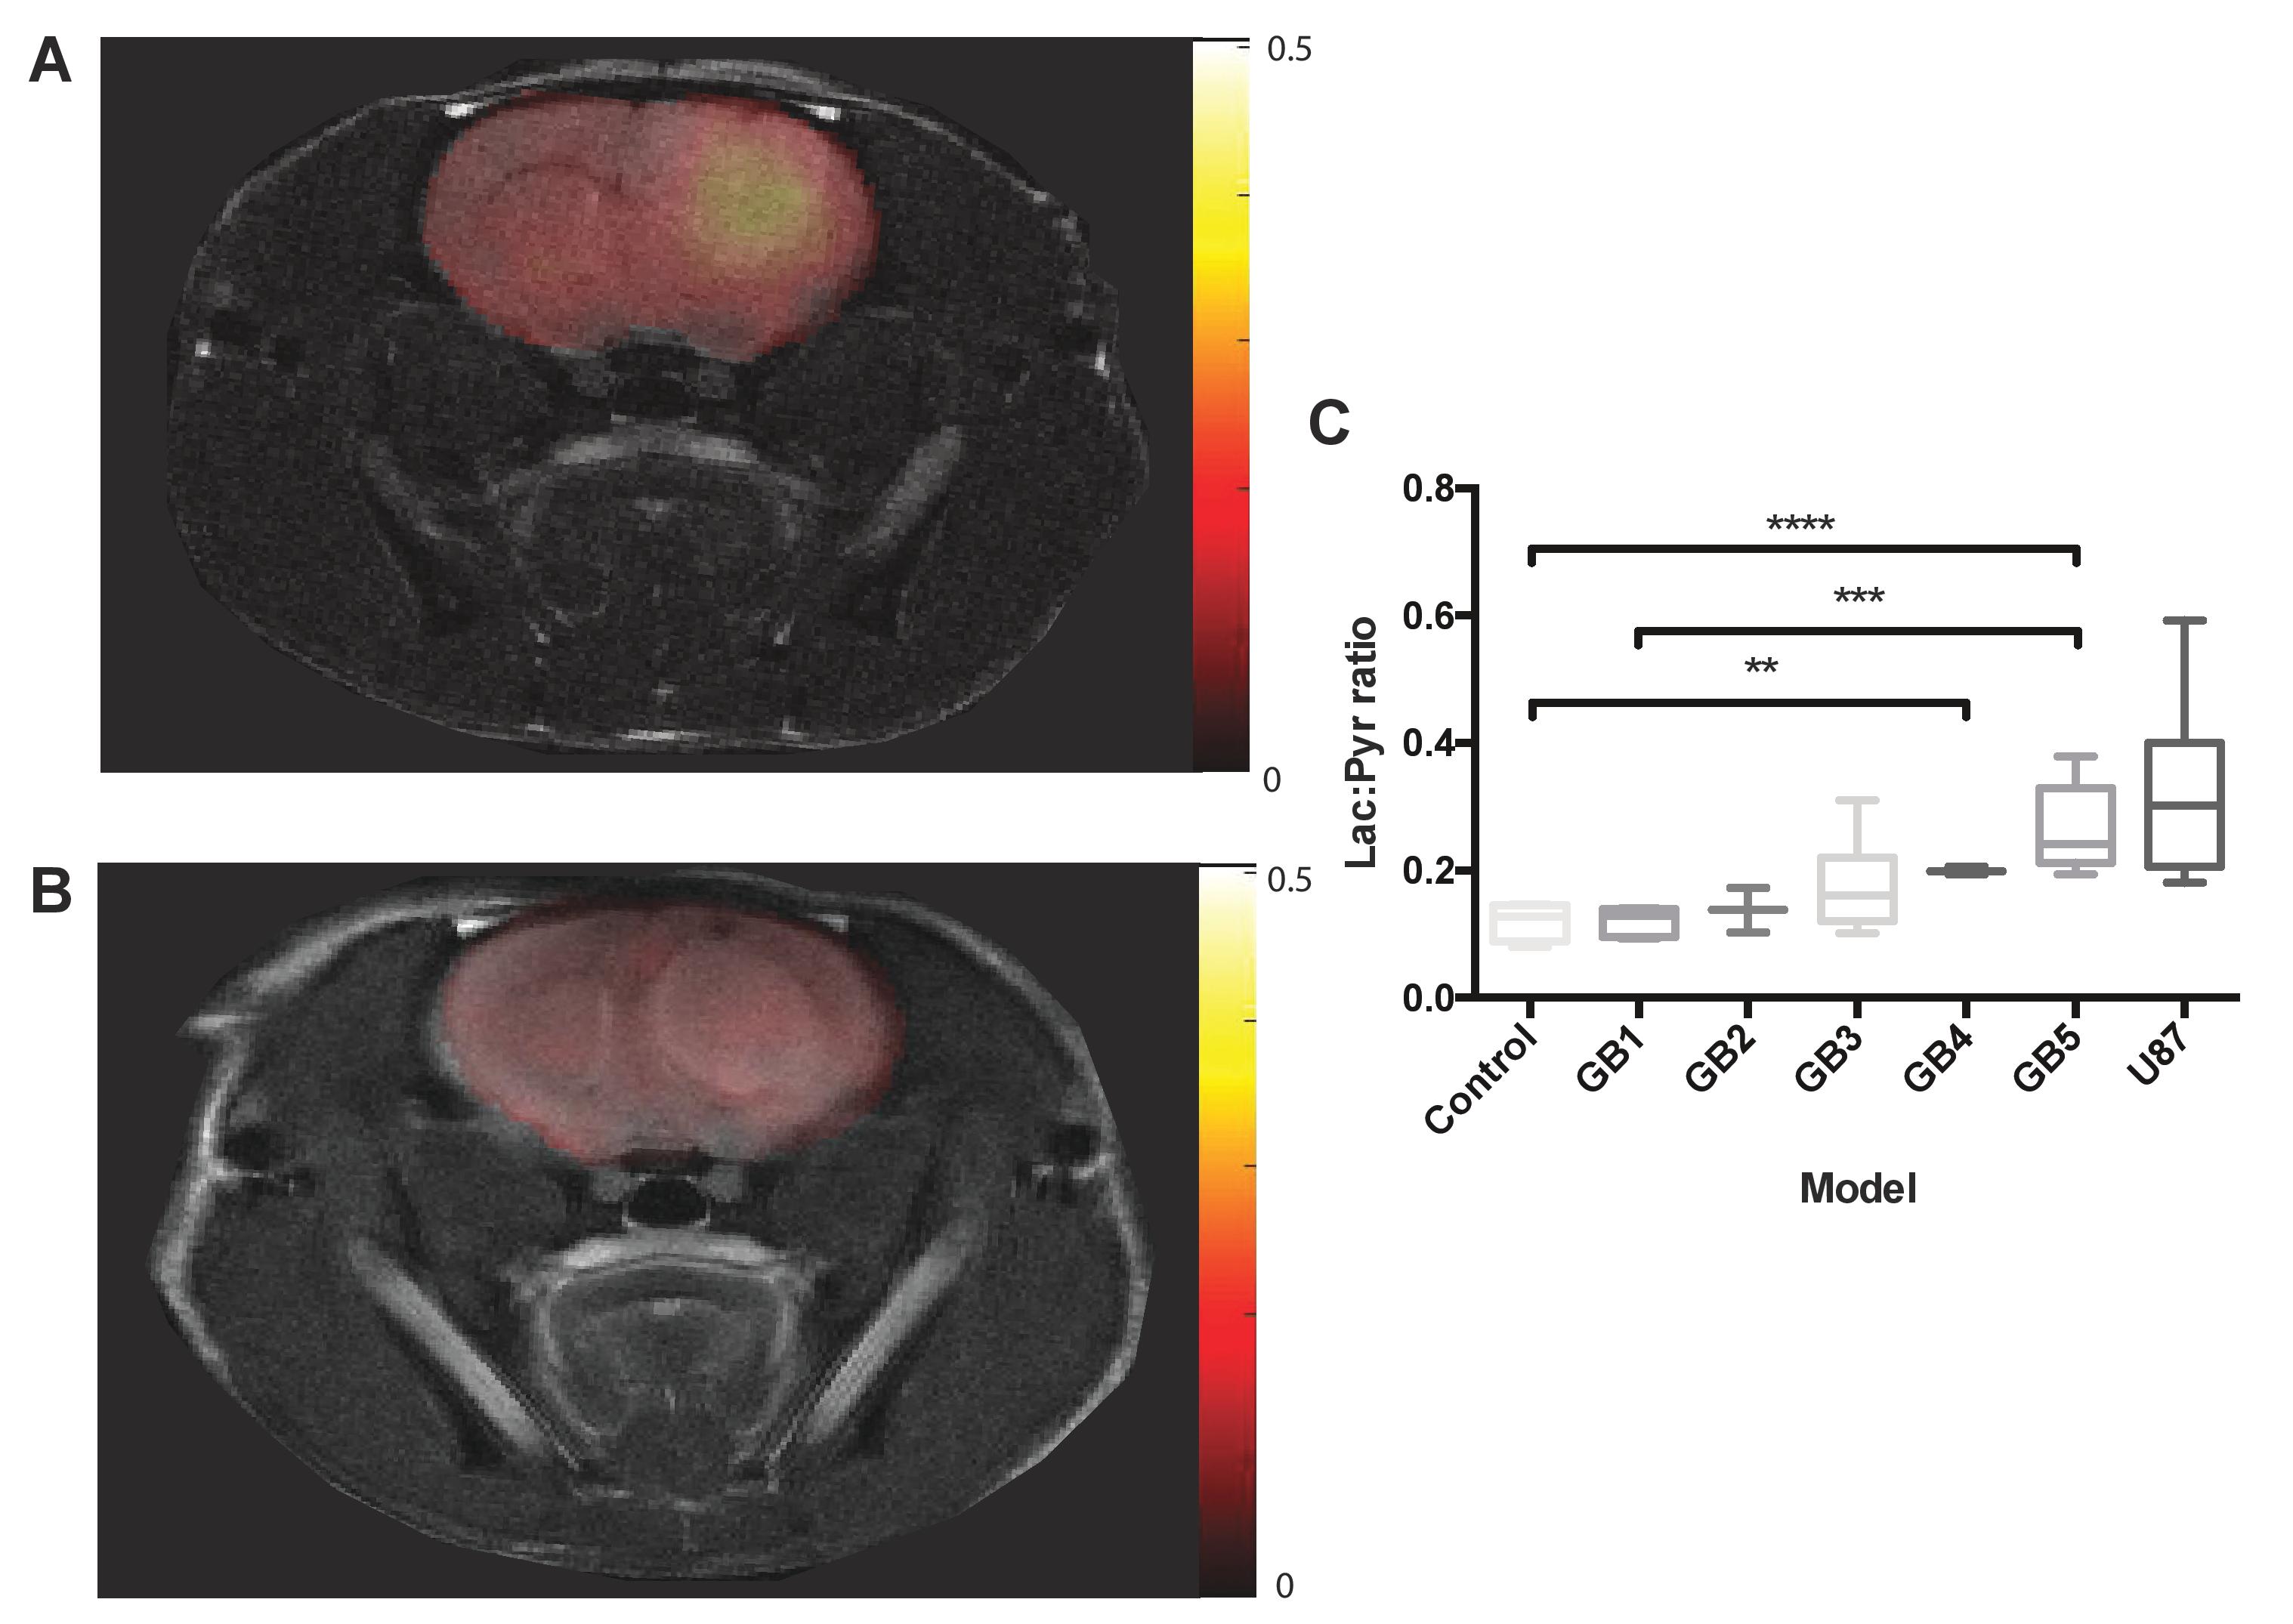
PDOX cohorts were generated from samples taken at surgery from 5 GB patients (GB1-5). Samples were passaged in vitro in serum-free conditions before orthotopic implantation into nude rats. Tumor latency was between 4 and 12 months with expression of nestin in vitro and GFAP in vivo further distinguishing these tumors from commercially available cell line derived tumor models (3). 13C magnetic resonance spectroscopic imaging (MRSI) was used to measure the [1-13C]lactate/[1-13C]pyruvate ratio (LPR) in tumor regions following injection of 184 mM hyperpolarized [1-13C]pyruvate. Excised brain tissue was analysed using immunohistochemistry (IHC) and western blotting to identify correlations between glycolytic enzymes and transporters expression, intracellular signalling molecules and lactate labeling. Multi-region samples from four patients with GB were analysed for correlations between glycolytic enzyme expression and intracellular signalling molecules.Results
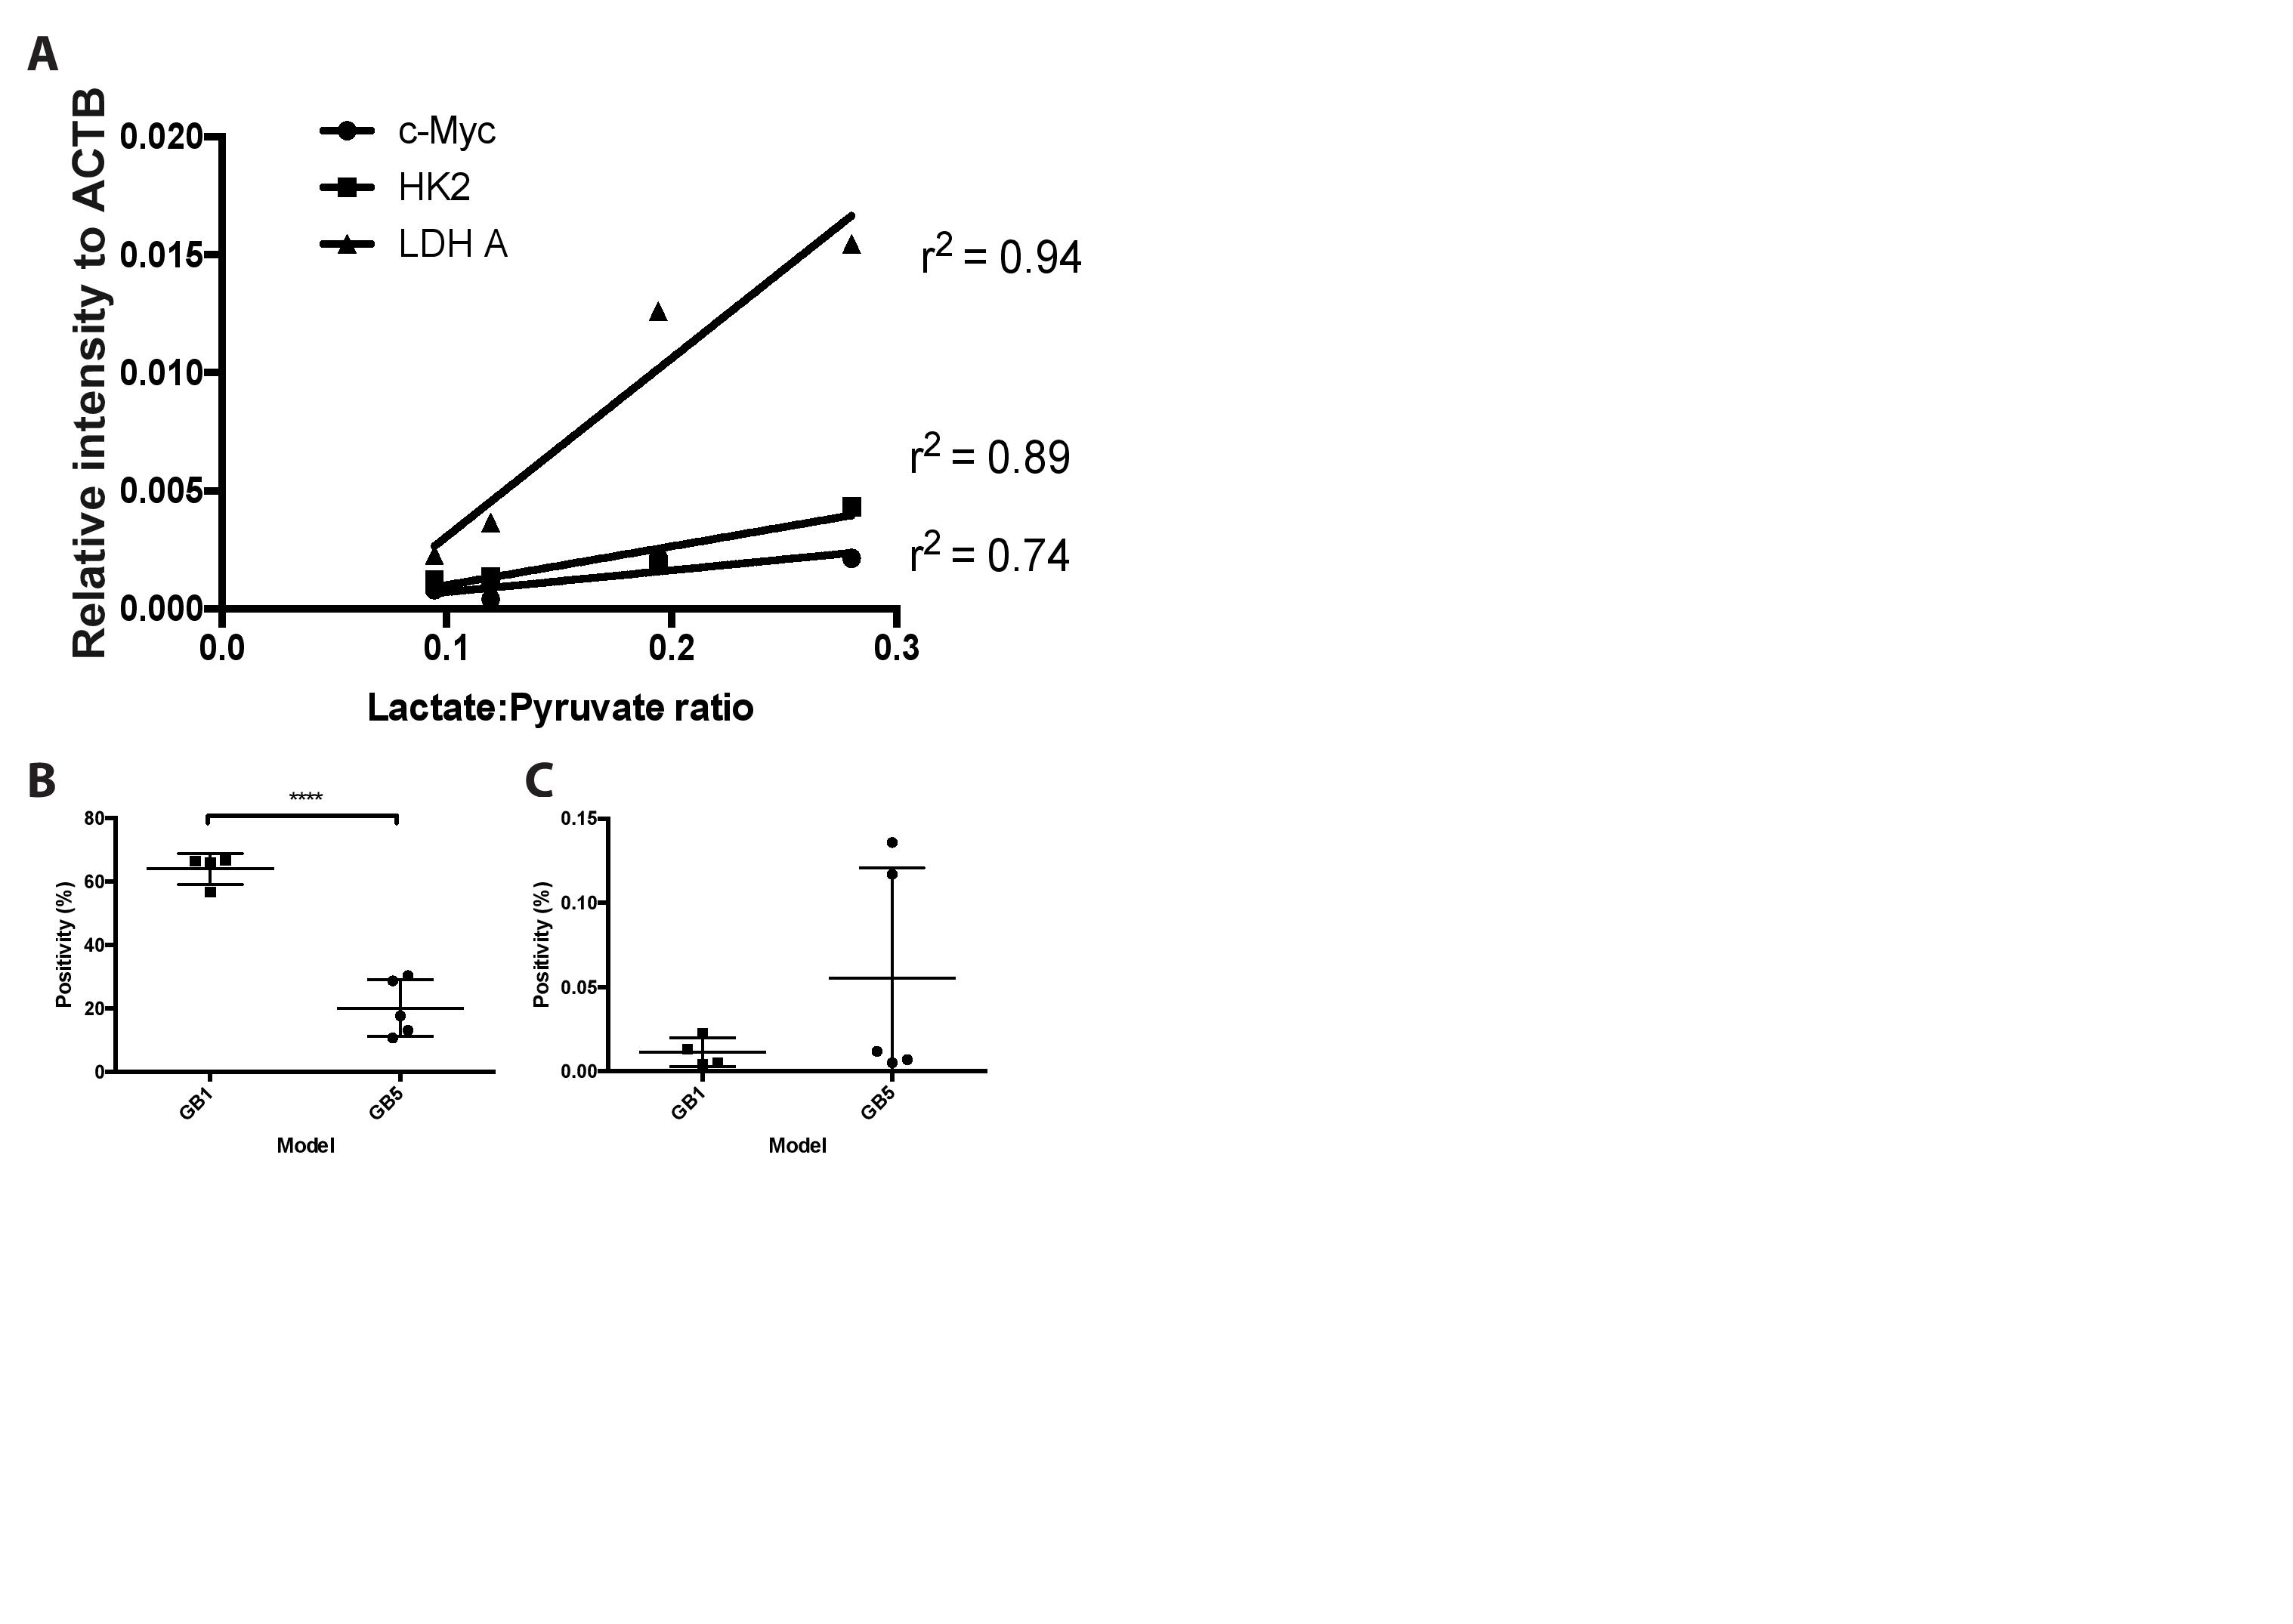
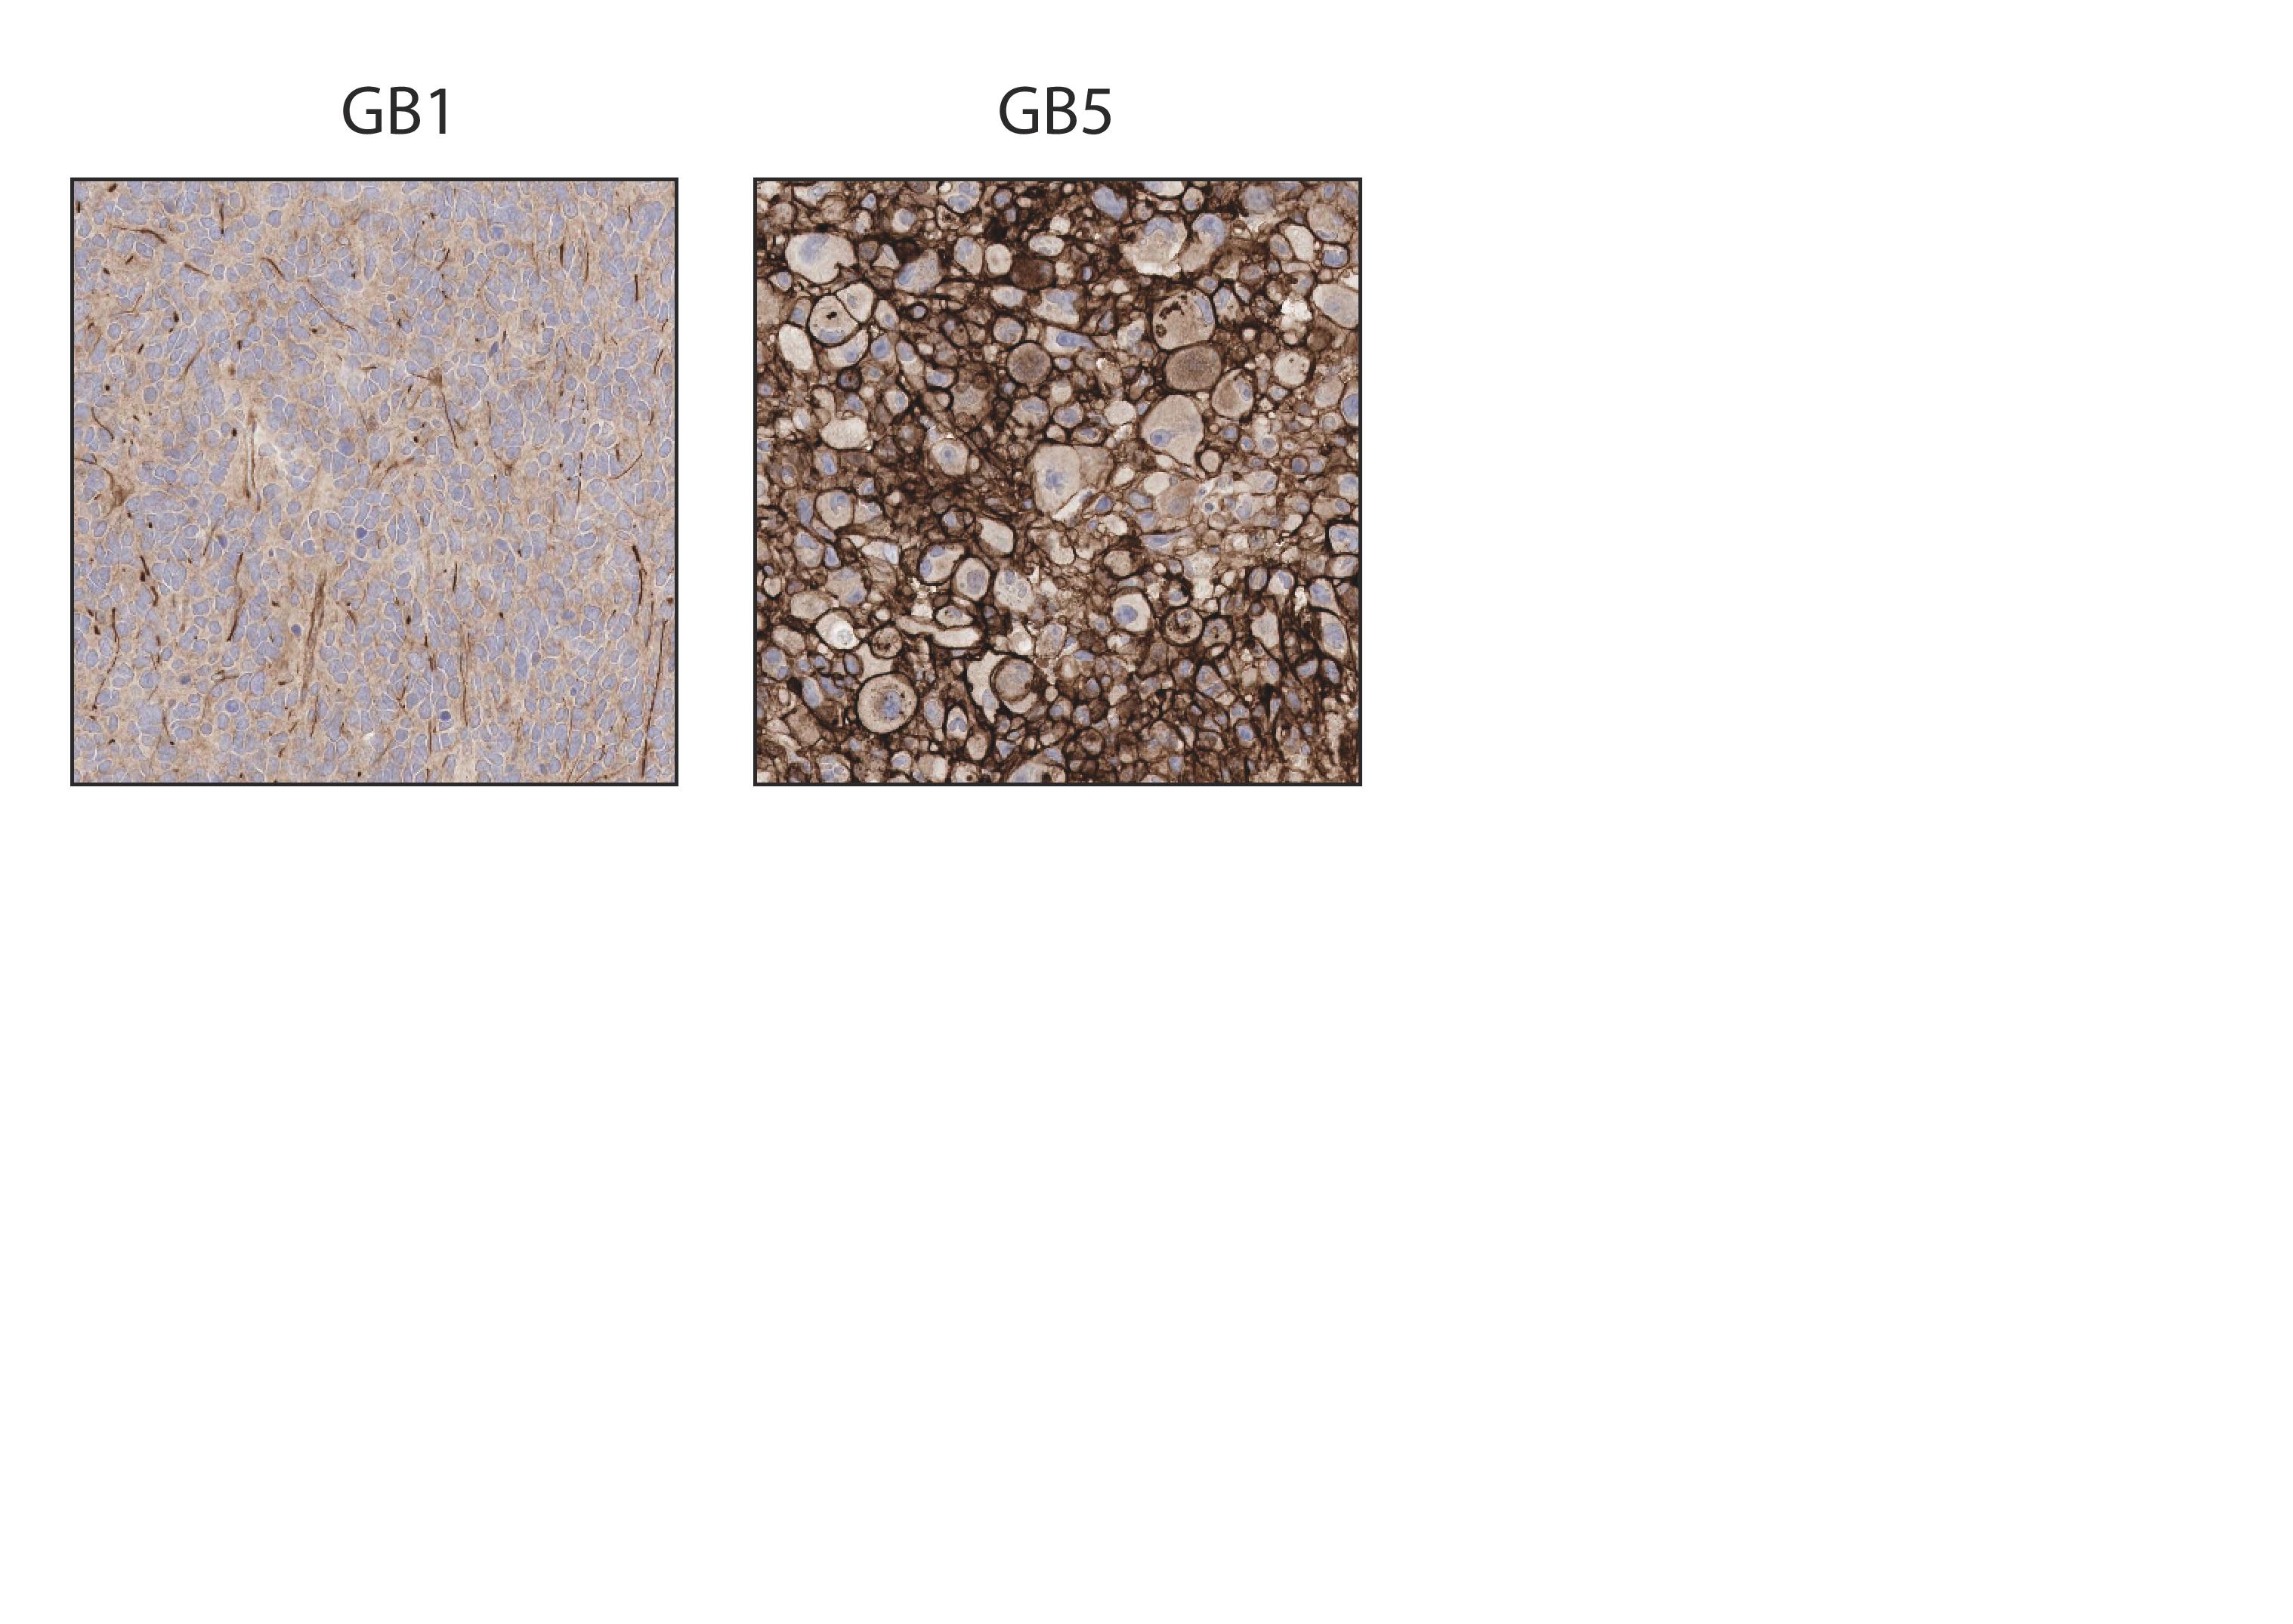
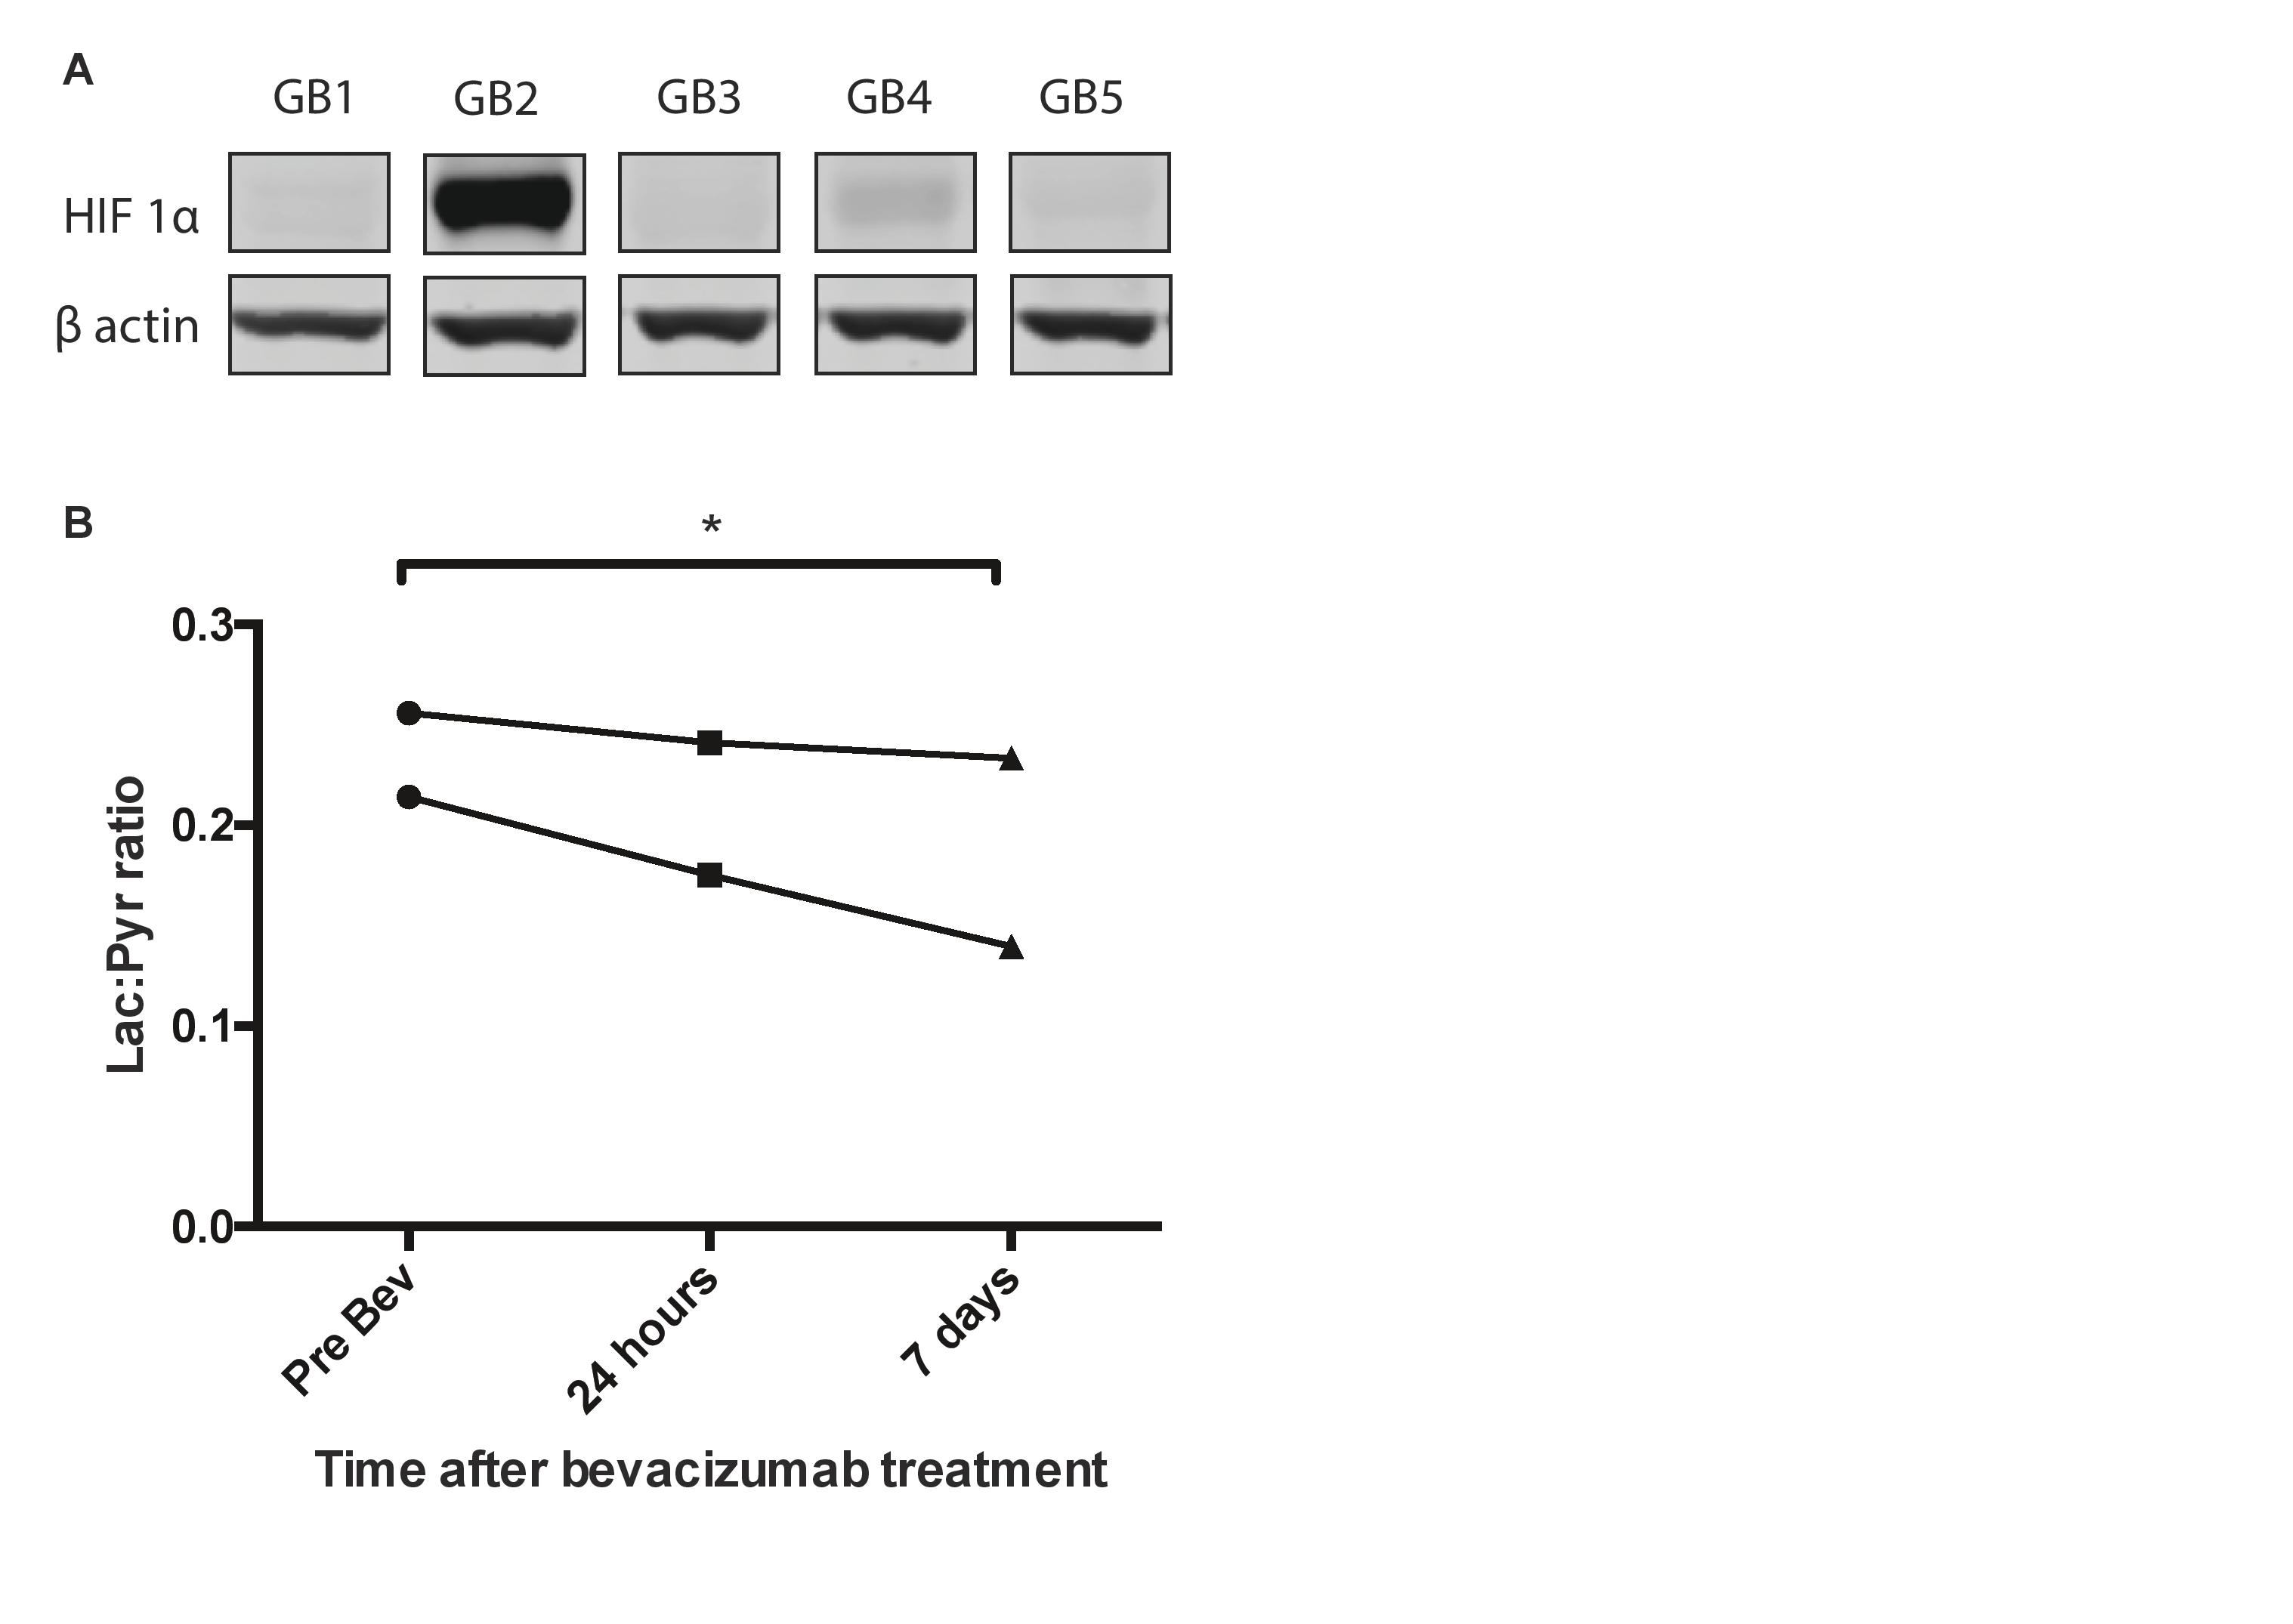
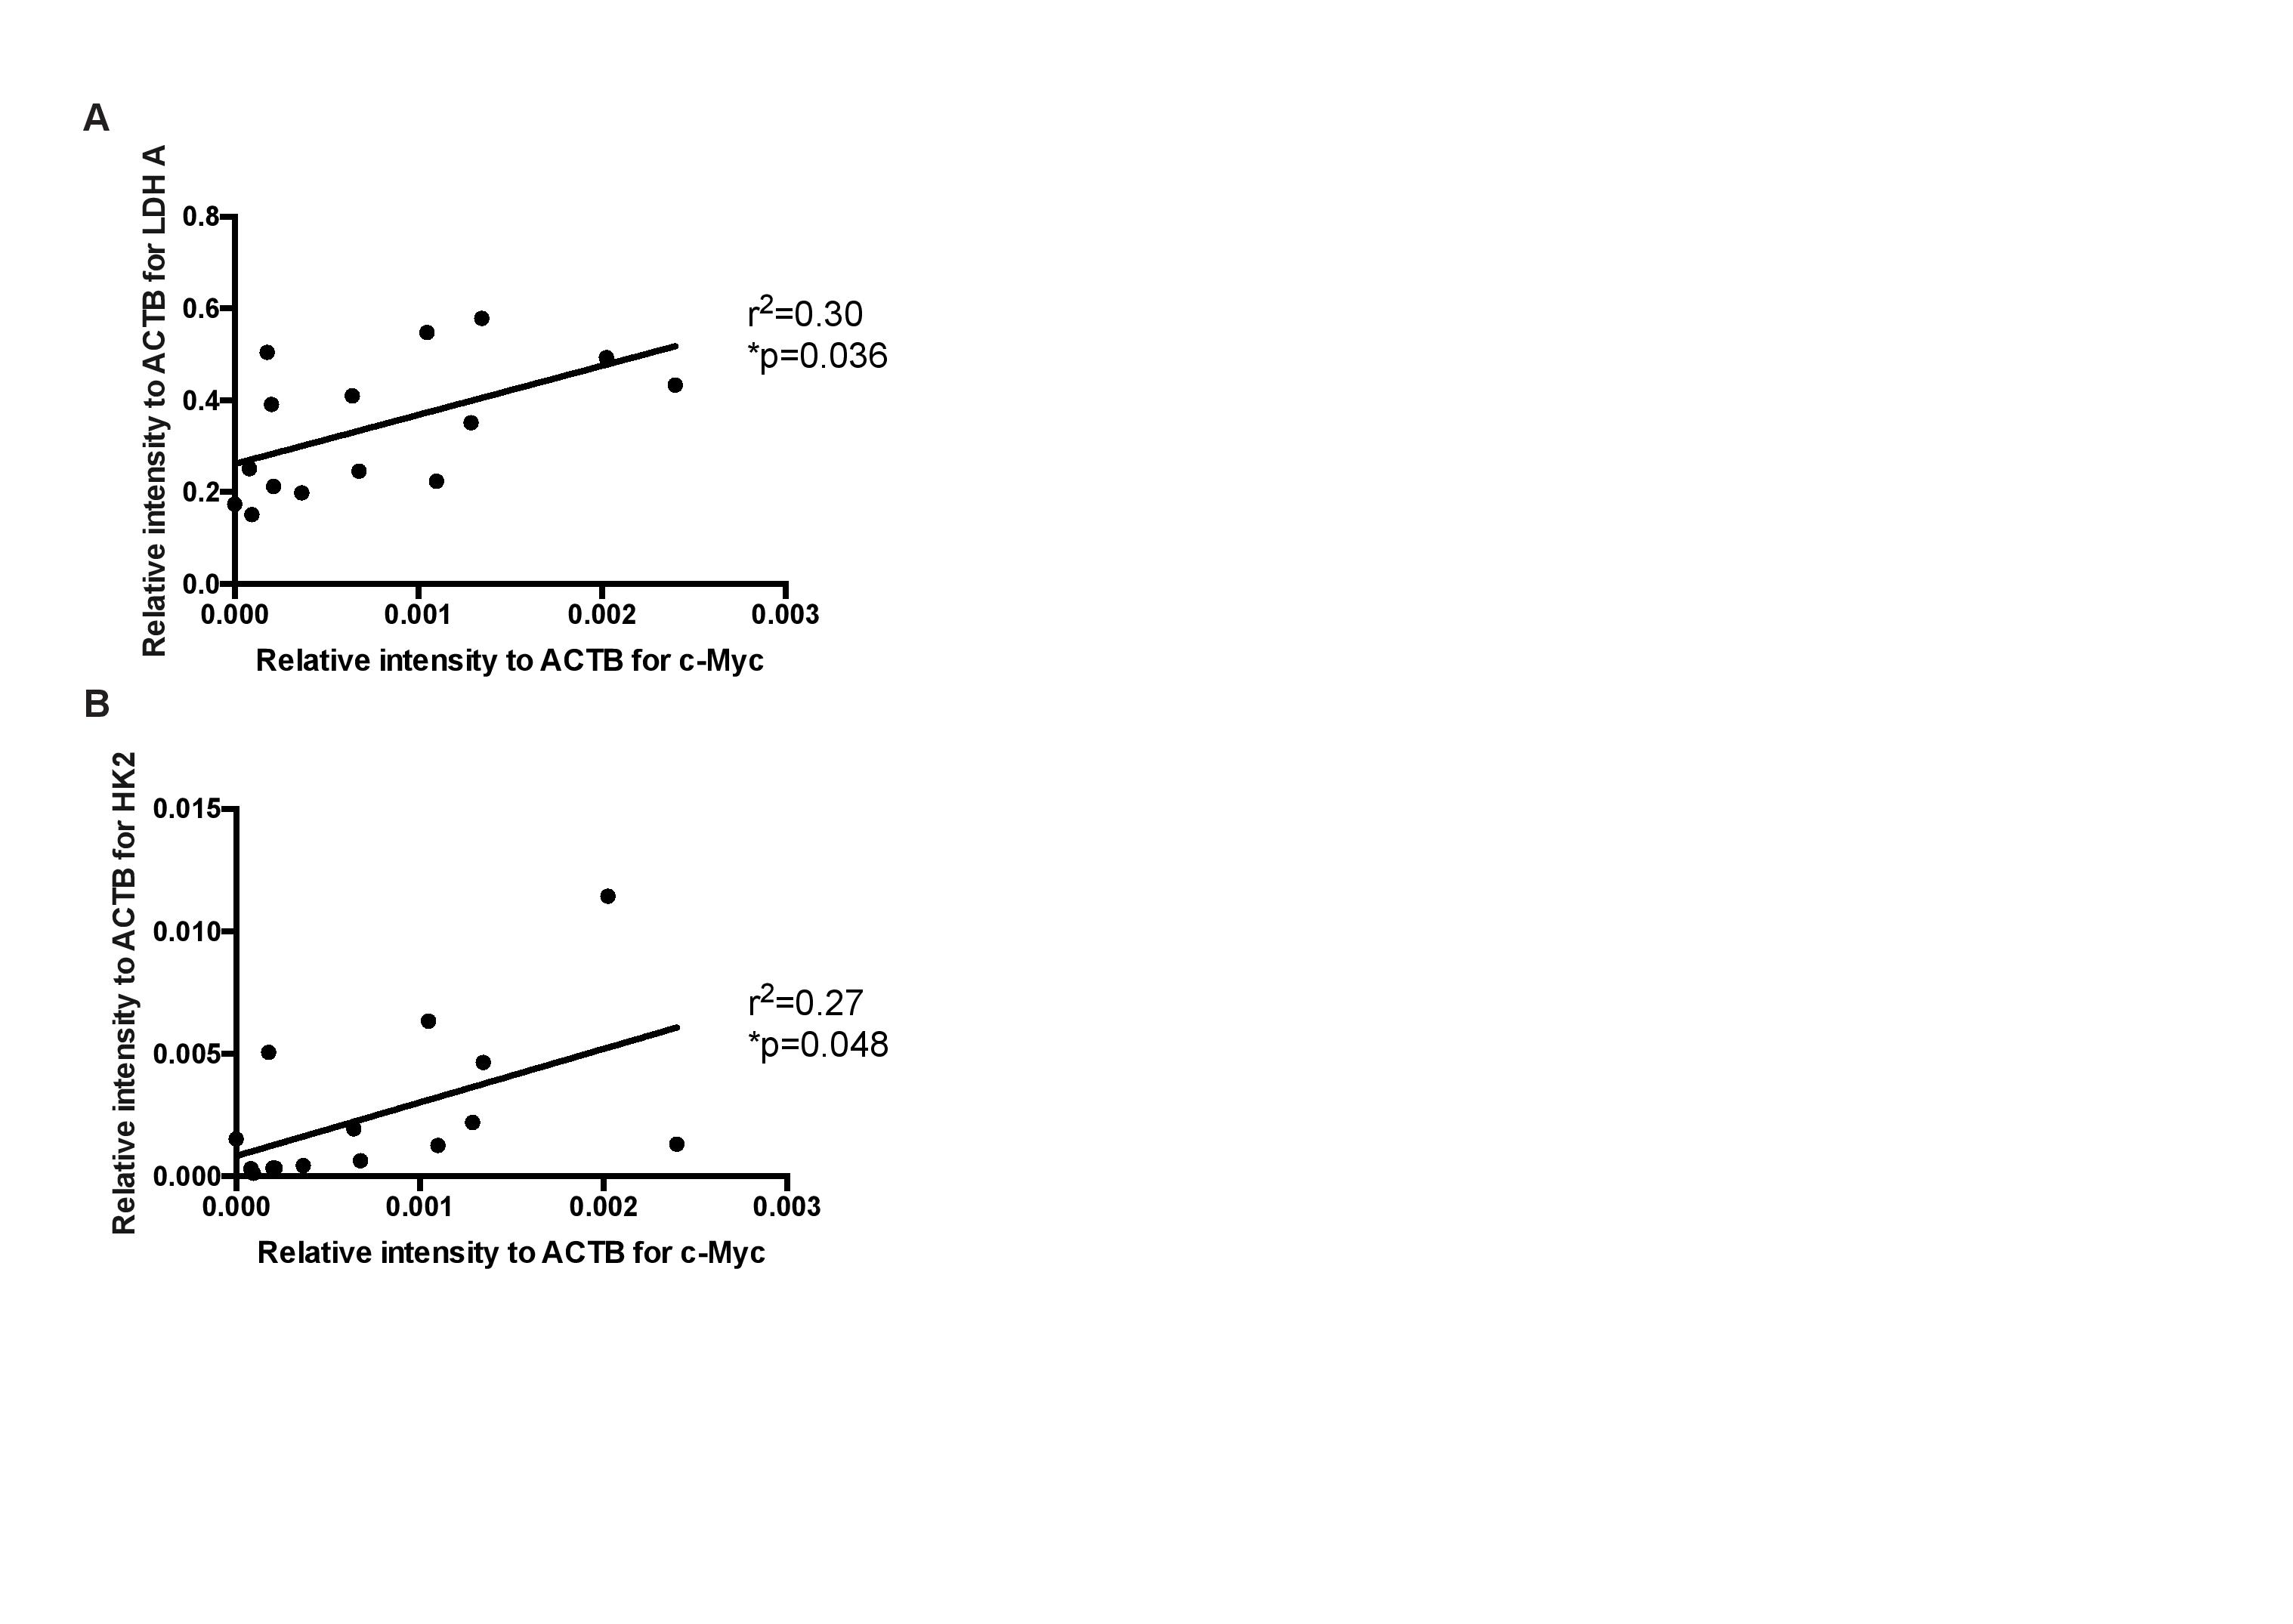
We demonstrated consistency within, and differences between, PDOX tumors in terms of both latency and histological appearance as well as LPR over the tumor region (Fig. 1). High LPR correlated with increased expression of c-Myc, LDHA and HK2 but did not with cell turnover (Ki67/TUNEL staining) (Fig. 2). IHC demonstrated increased plasma membrane expression of MCT1 and MCT4 in tumors with increased LPR (Fig. 3). One PDOX cohort had low LPR despite high c-Myc, LDHA, HK2 and MCT plasma membrane expression. This cohort demonstrated significantly higher hypoxia (HIF1α expression) compared to the other cohorts. Induction of hypoxia (via treatment with bevacizumab – a monoclonal antibody to VEGF A) in a previously high LPR cohort also produced a significant reduction in LPR (Fig. 4). Analysis of multiple regions from GB tumors in 4 different patients identified significant heterogeneity in c-Myc, HK2 and LDHA expression. The correlation between c-Myc, LDHA and HK2 expression observed in the PDOX models was also observed in the different tumor regions of these 4 patients (Fig. 5 a+b).Discussion
We have used hyperpolarised [1-13C]pyruvate to reproducibly interrogate metabolic flux in biologically apposite PDOX models of GB and thus identify distinct metabolic phenotypes. These phenotypes correlated with c-Myc, LDHA and HK2 expression alongside plasma membrane expression of MCT1 and MCT4 in vivo suggesting that labeling of lactate with a hyperpolarized 13C label provides a surrogate measure of glycolytic flux in these tumors. The ability to identify differential tumor metabolism in vivo may enable prognostication as well as the delivery of precision therapy (2). Moreover this technique may demonstrate areas of metabolic heterogeneity within as well as between tumors. This would enable alternate radiotherapy doses to be targeted to regions demonstrating high glycolysis, and putative radio-resistance. Tumor hypoxia has previously been shown to reduce LPR within tumors responding to bevacizumab (4). This likely represents a reduction in pyruvate delivery with a subsequent reduction in label exchange.Conclusion
We have identified circumstances whereby hyperpolarised [1-13C]pyruvate imaging could identify tumor metabolic phenotypes in vivo. This may enable patient metabolic stratification and also the targeting of radiotherapy alongside the use of precision medicines.Acknowledgements
CRUK Cambridge institute core facilities
Neuro oncology team at Cambridge University Hospitals NHS Foundation Trust
Funding: CRUK/Addenbrooke's Charitable Trust
References
1. Chang, S. M. et al. Integration of preoperative anatomic and metabolic physiologic imaging of newly diagnosed glioma. J Neurooncol 92, 401–415 (2009).
2. Tateishi, K. et al. Myc-driven glycolysis is a therapeutic target in glioblastoma. Clinical Cancer Research 1–40 (2016). doi:10.1158/1078-0432.CCR-15-2274
3. Lee, J. et al. Tumor stem cells derived from glioblastomas cultured in bFGF and EGF more closely mirror the phenotype and genotype of primary tumors than do serum-cultured cell lines. Cancer Cell 9, 391–403 (2006).
4. Bohndiek, S. E., Kettunen, M. I., Hu, D.-E. & Brindle, K. M. Hyperpolarized (13)C spectroscopy detects early changes in tumor vasculature and metabolism after VEGF neutralization. Cancer Research 72, 854–864 (2012).
Figures