0169
Towards Quantitative Cardiac First-Pass Perfusion Imaging using Hyperpolarized [13]-Urea1Institute for Biomedical Engineering, University and ETH Zurich, Zurich, Switzerland, 2Division of Surgical Research, University Hospital Zurich, Zurich, Switzerland
Synopsis
Hyperpolarized [13C] urea perfusion imaging using velocity-selective excitation is qualitatively and semi-quantitatively compared with clinically used [1H] Gadolinium first-pass perfusion imaging in healthy pigs. Higher contrast-to-noise ratios and comparable sensitivity for semi-quantitative perfusion measures over myocardial sectors can be achieved with [13C] urea. Arterial input sampling in the ascending aorta using a second imaging slice with conventional excitation is proposed. Feasibility of accurate absolute myocardial blood flow quantification using [13C] urea is demonstrated.
Introduction
Qualitative and semi-quantitative myocardial perfusion imaging using Gadolinium based contrast agents is clinically established for diagnosing ischemia1-2. To reduce operator dependence during analysis and to enable the assessment of triple-vessel disease, microvascular obstruction and other conditions, absolute myocardial blood flow (MBF) quantification3 is promoted.
Metabolically inert hyperpolarized [13C]-labeled substrates such as [13C]-urea have been used to investigate tumor, renal and cardiac perfusion4-6. It has previously been demonstrated that a velocity-selective excitation can overcome major limitations in the applicability of hyperpolarized substrates for cardiac perfusion imaging related to magnetization saturation and signal leakage from the LV blood pool7. Since arterial input functions (AIFs) are no longer available, they need to be sampled from the ascending aorta using a second imaging slice.
In this work hyperpolarized [13C]-urea is qualitatively compared with [1H]-Gadolinium perfusion imaging and the feasibility of accurate MBF quantification is demonstrated.
Methods
In total eight healthy female pigs (30-35kg) were anesthetized (isoflorane 2-3%), ventilated (4-5L/min) and venous catheters for medication and injection of hyperpolarized substances were introduced. Pharmacological stress was induced by administration of dobutamine (target heart rate 120bpm). All experiments were performed in accordance with the Swiss Animal Protection Law and Ordinance.
In-vivo imaging was performed on a clinical 3T Philips Ingenia system equipped with a 4-channel 13C transmit/receive coil. The previously proposed velocity-selective excitation scheme7 and conventional excitation were used in conjunction with a dynamic single-shot EPI readout. In order to obtain a reliable AIF signal for perfusion quantification, a second image slice in the ascending aorta with conventional excitation and low flip-angle was interleaved within one heartbeat as illustrated in Fig-1.
Prior to hyperpolarized imaging, 2D anatomical and flow cine scans were acquired to determine through-plane blood velocities and trigger delays in early systole. All dynamic images were acquired every heartbeat for 45s during suspended ventilation.
6.7M [13C]-urea glycerol solution doped with 18.5mM trityl radical was polarized in a commercial GE SpinLab hyperpolarizer. 20ml of 200mM [13C]-urea solution were injected over 3s into the femoral vein after dissolution and transport in a magnetic carrier device8. Image acquisition was started 7 heartbeats after the beginning of injection. Sequence parameters for 13C imaging were: FOV:110x110mm2, in-plane resolution 3x3mm2 (reconstructed to 1x1mm2), slice-thickness 15mm, partial Fourier factor 0.65, flip-angle 60°, TE=12.5ms. Conventional excitation with a reduced flip-angle of 5° was used for the AIF slice.
1H perfusion images were acquired using dual bolus9 administration (0.025mmol/kg and 0.1mml/kg) of Gadolinium (rate 3ml/s). Sequence parameters for the saturation-recovery spoiled gradient echo sequence were: FOV:220x220mm2, in-plane resolution 3x3mm2 (reconstructed to 1x1mm2), slice-thickness 10mm, TR=1.96ms, TE=0.71ms, flip-angle 15°, WET10 saturation delay 100ms.
Coil sensitivities were estimated in a pre-bolus and post-bolus frame for 1H and 13C respectively. Perfusion curves were extracted from six sectors according to the AHA model11. Semi-quantitative perfusion measures3 (peak myocardial CNR, AUC, myocardial upslope) were extracted for all sectors in n=6 animals.
MBF quantification was performed for 3 measurements in n=2 additional animals by Fermi deconvolution of the myocardial response and the arterial input function12. AIF signals were scaled based on the plateau between first and second bolus pass and nominal flip angles for 1H and 13C, respectively.
Results
Visual comparison of velocity-selective [13C]-urea with [1H]-Gadolinium images and extracted perfusion curves in 6 sectors revealed comparable quality for both methods (Fig-2). Clear distinctions between LV signal and myocardial uptake can be observed in contrast to conventional [13C]-urea imaging.
Coefficients of variance of semi-quantitative measures <20% for velocity-selective [13C]-urea measurements demonstrate low variability over the myocardium in healthy animals (Fig-3). [1H]-Gadolinium based measurements show even lower variability (<14%), but suffer from lower myocardial CNR: 10.4±3.8(1H) vs. 19.2±7.5(13C).
MBF quantification showed good correlation between 13C and 1H measurements (R=0.97), see Fig-4. Maximum discrepancy between methods was 34%, with an average of 8%±9%. A small overestimation bias of <5% was observed for [13C]-urea.
Discussion
Hyperpolarized [13C]-urea yields similar image quality as clinically used [1H]-Gadolinium enhanced perfusion imaging. Velocity-selective excitation, in conjunction with interleaved sampling of the AIF for [13C]-urea, results in higher myocardial CNR compared to [1H]-Gadolinium.
Image quality in the present study is limited by the receive sensitivity of the 4-channel 13C surface coil and 2-channel 1H body coil. Improved surface coils could equally improve image quality for both cases.
Absolute MBF quantification using Fermi deconvolution shows very good agreement between [13C]-urea and [1H]-Gadolinium with minor systematic bias. The impact of other impulse function shapes and more sophisticated tissue compartment models remain to be investigated.
Conclusion
Hyperpolarized [13C]-urea with velocity-selective excitation is capable of providing accurate qualitative and quantitative measures of myocardial first-pass perfusion.Acknowledgements
This work was supported by the Molecular Imaging Network Zurich (MINZ) and the University and the ETH Zurich Foundation through a Seed Grant of ‘University Medicine Zurich’.References
1. Gerber BL, Raman S V, Nayak K, Epstein FH, Ferreira P, Axel L, Kraitchman DL. Myocardial first-pass perfusion cardiovascular magnetic resonance: history, theory, and current state of the art. J. Cardiovasc. Magn. Reson. 2008;10:18.
2. Greenwood JP, Maredia N, Younger JF, et al. Cardiovascular magnetic resonance and single-photon emission computed tomography for diagnosis of coronary heart disease (CE-MARC): A prospective trial. Lancet. 2012;379:453–460.
3. Jerosch-Herold M. Quantification of myocardial perfusion by cardiovascular magnetic resonance. J. Cardiovasc. Magn. Reson. 2010;12:1–16.
4. Von Morze C, Larson PEZ, Hu S, Yoshihara H a I, Bok R a., Goga A, Ardenkjaer-Larsen JH, Vigneron DB. Investigating tumor perfusion and metabolism using multiple hyperpolarized 13C compounds: HP001, pyruvate and urea. Magn. Reson. Imaging 2012;30:305–311.
5. Durst M, Koellisch U, Gringeri C, Janich M a., Rancan G, Frank A, Wiesinger F, Menzel MI, Haase A, Schulte RF. Bolus tracking for improved metabolic imaging of hyperpolarized compounds. J. Magn. Reson. 2014;243:40–46.
6. Lau AZ, Miller JJ, Robson MD, Tyler DJ. Cardiac perfusion imaging using hyperpolarized 13 c urea using flow sensitizing gradients. Magn. Reson. Med. 2016;75:1474–1483.
7. Fuetterer M, Busch J, von Deuster C, Binter C, Cesarovic N, Lipiski M, Stoeck CT, Kozerke S. Velocity-selective tip-back excitation for hyperpolarized [13C] urea cardiac perfusion imaging. Proc. 24th annual meeting of ISMRM, Singapore, 2016.
8. Shang H, Skloss T, von Morze C, Carvajal L, Van Criekinge M, Milshteyn E, Larson PEZ, Hurd RE, Vigneron DB. Handheld electromagnet carrier for transfer of hyperpolarized carbon-13 samples. Magn. Reson. Med 2016;75:917–922.
9. Ishida M, Schuster A, Morton G, et al. Development of a universal dual-bolus injection scheme for the quantitative assessment of myocardial perfusion cardiovascular magnetic resonance. J. Cardiovasc. Magn. Reson. 2011;13:28.
10. Ogg RJ, Kingsley PB, Taylor JS. WET, a T1- and B1-insensitive water-suppression method for in vivo localized 1H NMR spectroscopy. J. Magn. Reson. B 1994;104:1–10.
11. Cerqueira MD. Standardized Myocardial Segmentation and Nomenclature for Tomographic Imaging of the Heart. Circulation 2002;105:539–542.
12. Axel L. Tissue mean transit time from dynamic computed tomography by a simple deconvolution technique. Invest. Radiol. 1983;18:94–99.
Figures
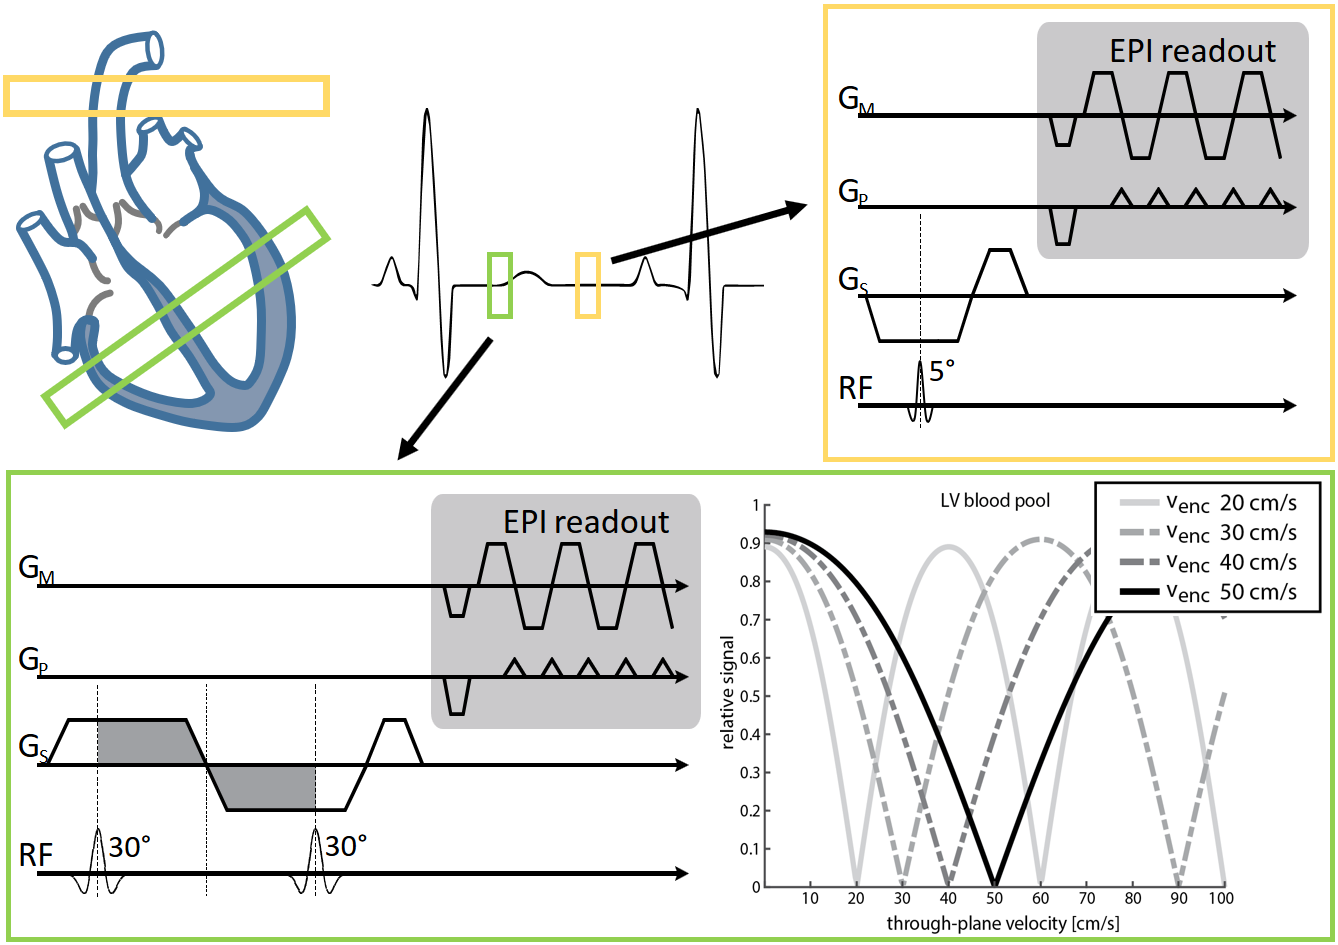
Figure 1:
Sequence overview for quantitative hyperpolarized cardiac first-past perfusion imaging with [13C]-urea. Myocardial perfusion is measured in a mid-ventricular short-axis slice (top-left green). The corresponding arterial input function (AIF) is sampled from a perpendicular slice in the ascending aorta (top-left yellow). Both images are interleaved within one heartbeat.
(green box) velocity-selective binomial excitation sequence (left) with corresponding excitation patterns for various encoding strengths
(yellow box) conventional excitation with low flip angle for AIF sampling
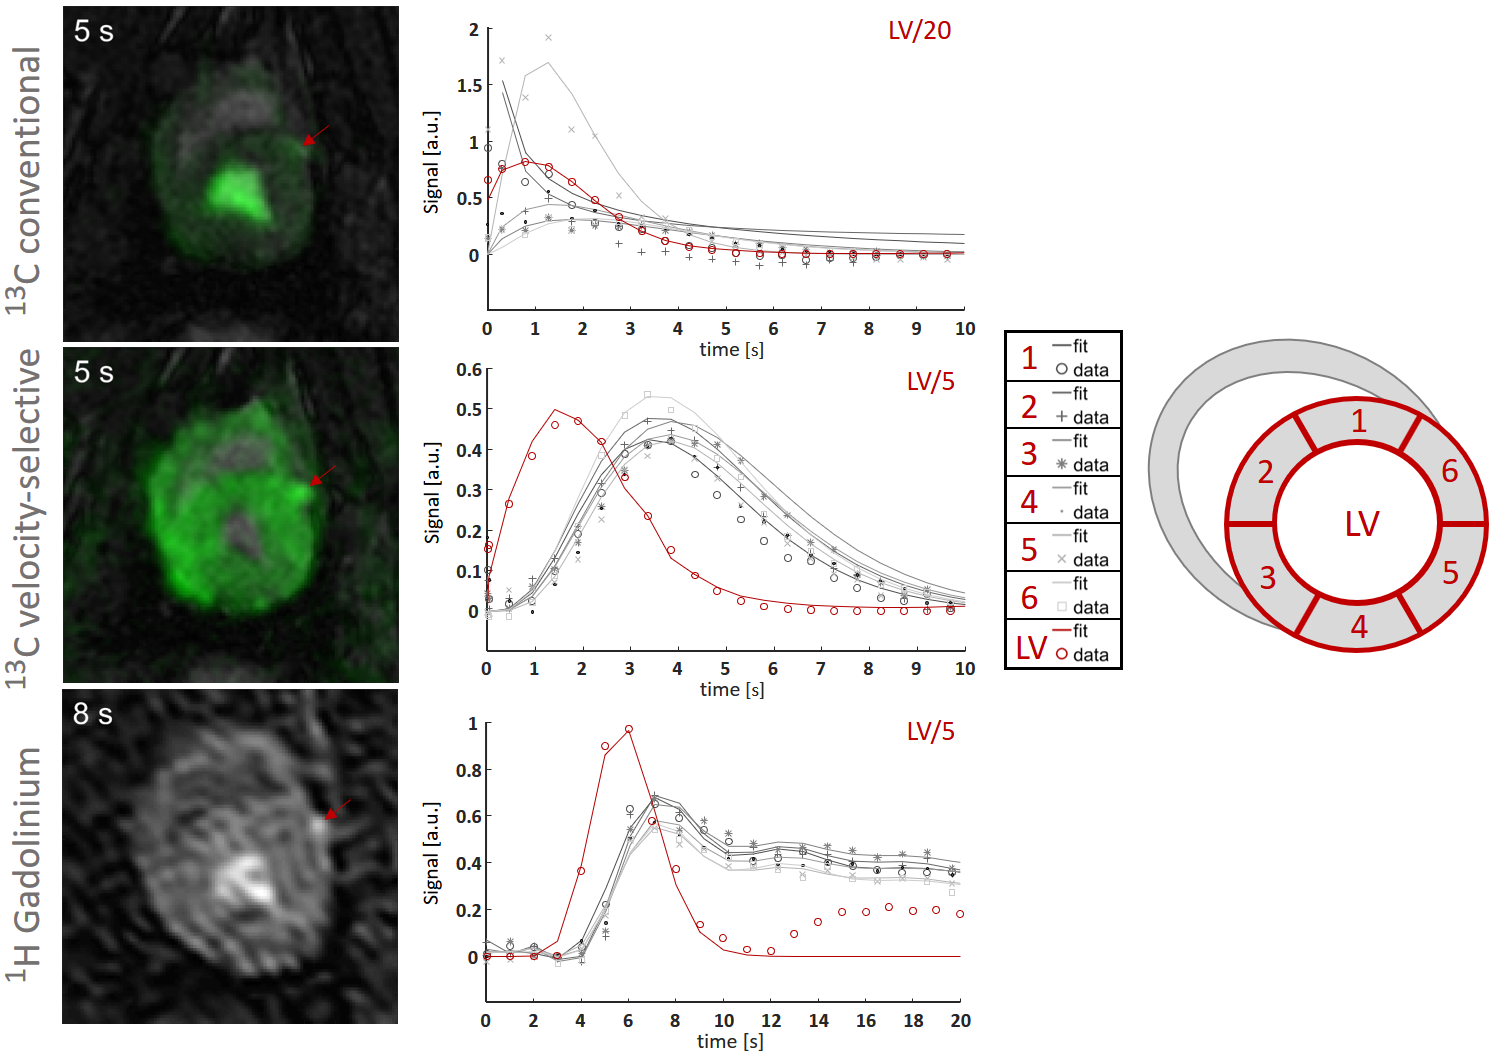
Figure 2:
Single frames and extracted perfusion curves from dynamic perfusion series during myocardial bolus passage for conventional [13C]-urea imaging (top), velocity selective [13C]-urea imaging (middle) and [1H]-Gadolinium enhanced imaging (bottom). The left anterior descending artery (LAD) is indicated by a red arrow. 13C images are acquired with a 4-channel Tx/Rx coil, 1H images are acquired with the 2-channel body-coil at a clinical 3T system.
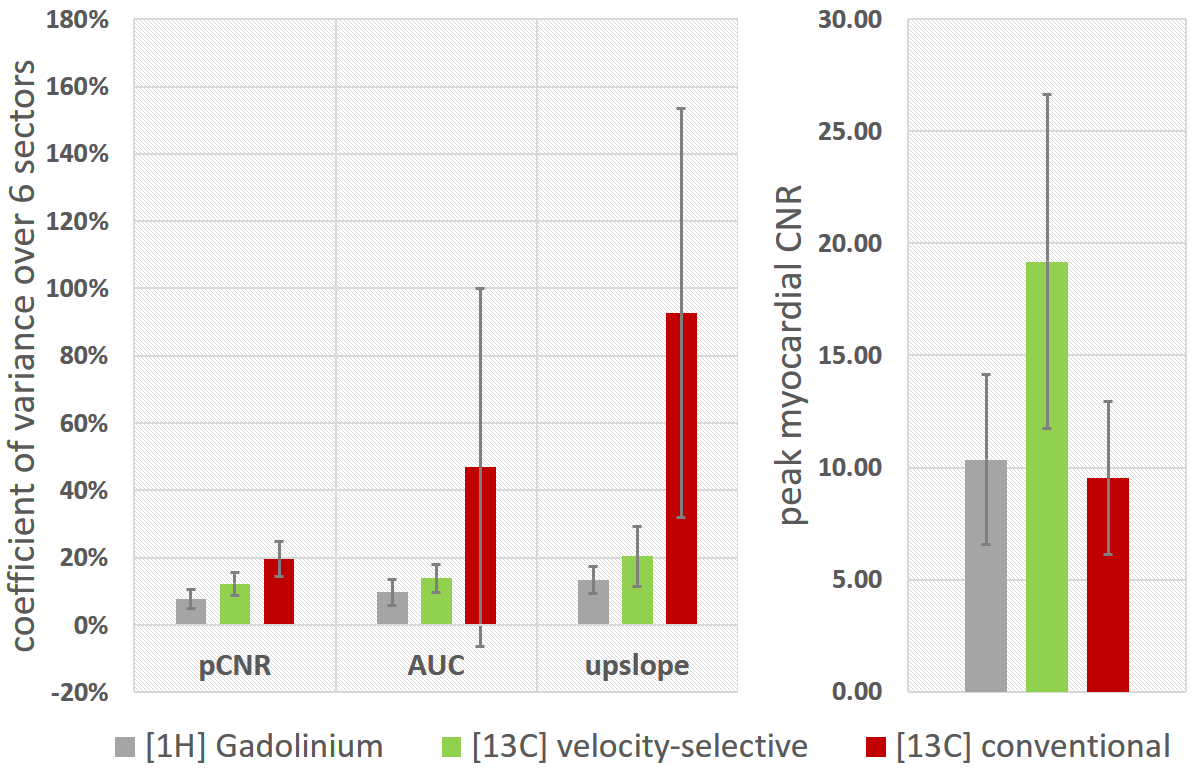
Figure 3:
(Left) Coefficient of variance (mean/std) of semi-quantitative perfusion measures (peak myocardial contrast-to-noise ratio (pCNR), area-under-the-curve (AUC), myocardial upslope) over six AHA sectors in a subset of n=6 animals. [1H]-Gadolinium enhanced imaging is compared to velocity-selective and conventional [13C]-urea imaging. AUC and upslope were extracted from fitted perfusion curves. Only first-pass signal contributions were considered for AUC calculation.
(Right) Mean and standard deviation of contrast-to-noise ratio (pCNR) at myocardial bolus peak. pCNR for conventional [13C]-urea imaging is overestimated due to signal leakage from LV blood pool.
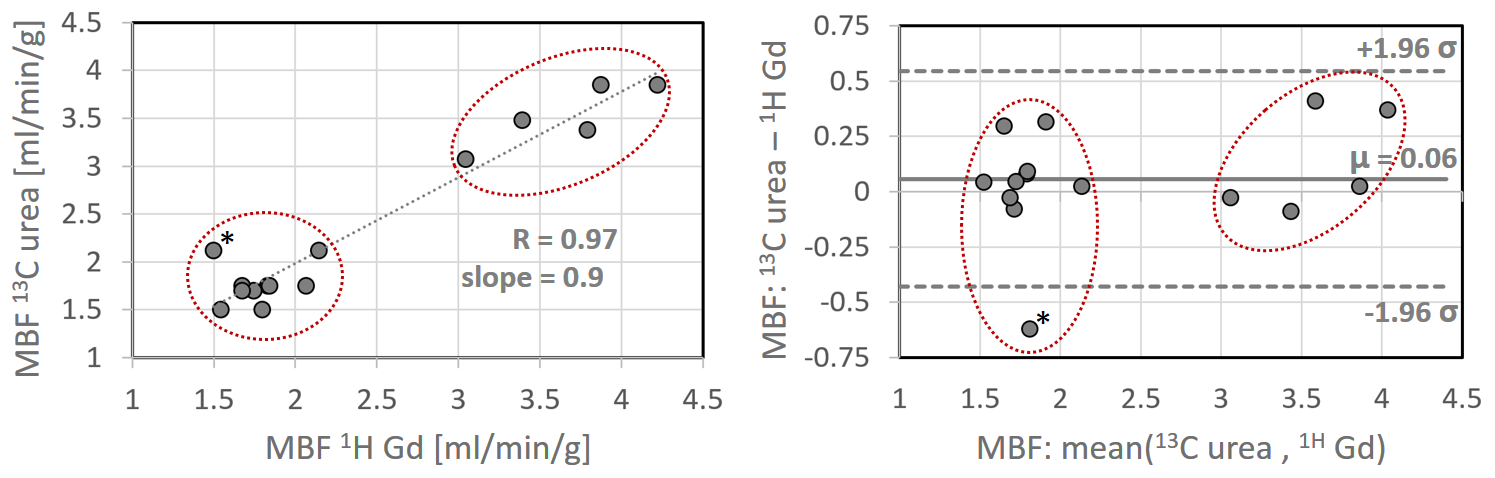
Figure 4:
Comparison of sector-wise myocardial blood flow quantification using Fermi deconvolution for [13C]-urea with arterial input function (AIF) sampling and dual-bolus [1H]-Gadolinium enhanced measurements. Red circles indicate corresponding measurements for each animal. (left) Correlation of absolute MBF values. (right) Bland-Altman plot.