0167
[2-13C]dihydroxyacetone as a real-time, in vivo sensor of acute hepatic and renal metabolic response after a fructose and glucose challenge1Department of Radiology and Biomedical Imaging, University of California San Francisco, San Francisco, CA, United States, 2Department of Medicine, Division of Nephrology, University of California San Francisco, San Francisco, CA, United States, 3Department of Biochemistry and Molecular Biology, University of Florida, Gainesville, FL, United States
Synopsis
Hyperpolarized [2-13C]dihydroxyacetone was used to investigate the hepatic and renal metabolic response to acute intravenous administration of glucose or fructose in rats in vivo. 13C-MR spectra were acquired before, 10 minutes and 80 minutes after the carbohydrate solution delivery. Changes in the metabolic products phosphoenolpyruvate (PEP) and glycerol 3-phosphate (G3P) were detected after fructose injection, while no metabolic perturbation was detected after the glucose injection. The observed effects possibly include ATP depletion and changes in the unlabelled pool sizes of glycolytic intermediates.
Target Audience
Researchers interested in hyperpolarized 13C metabolic imaging and spectroscopy.Purpose
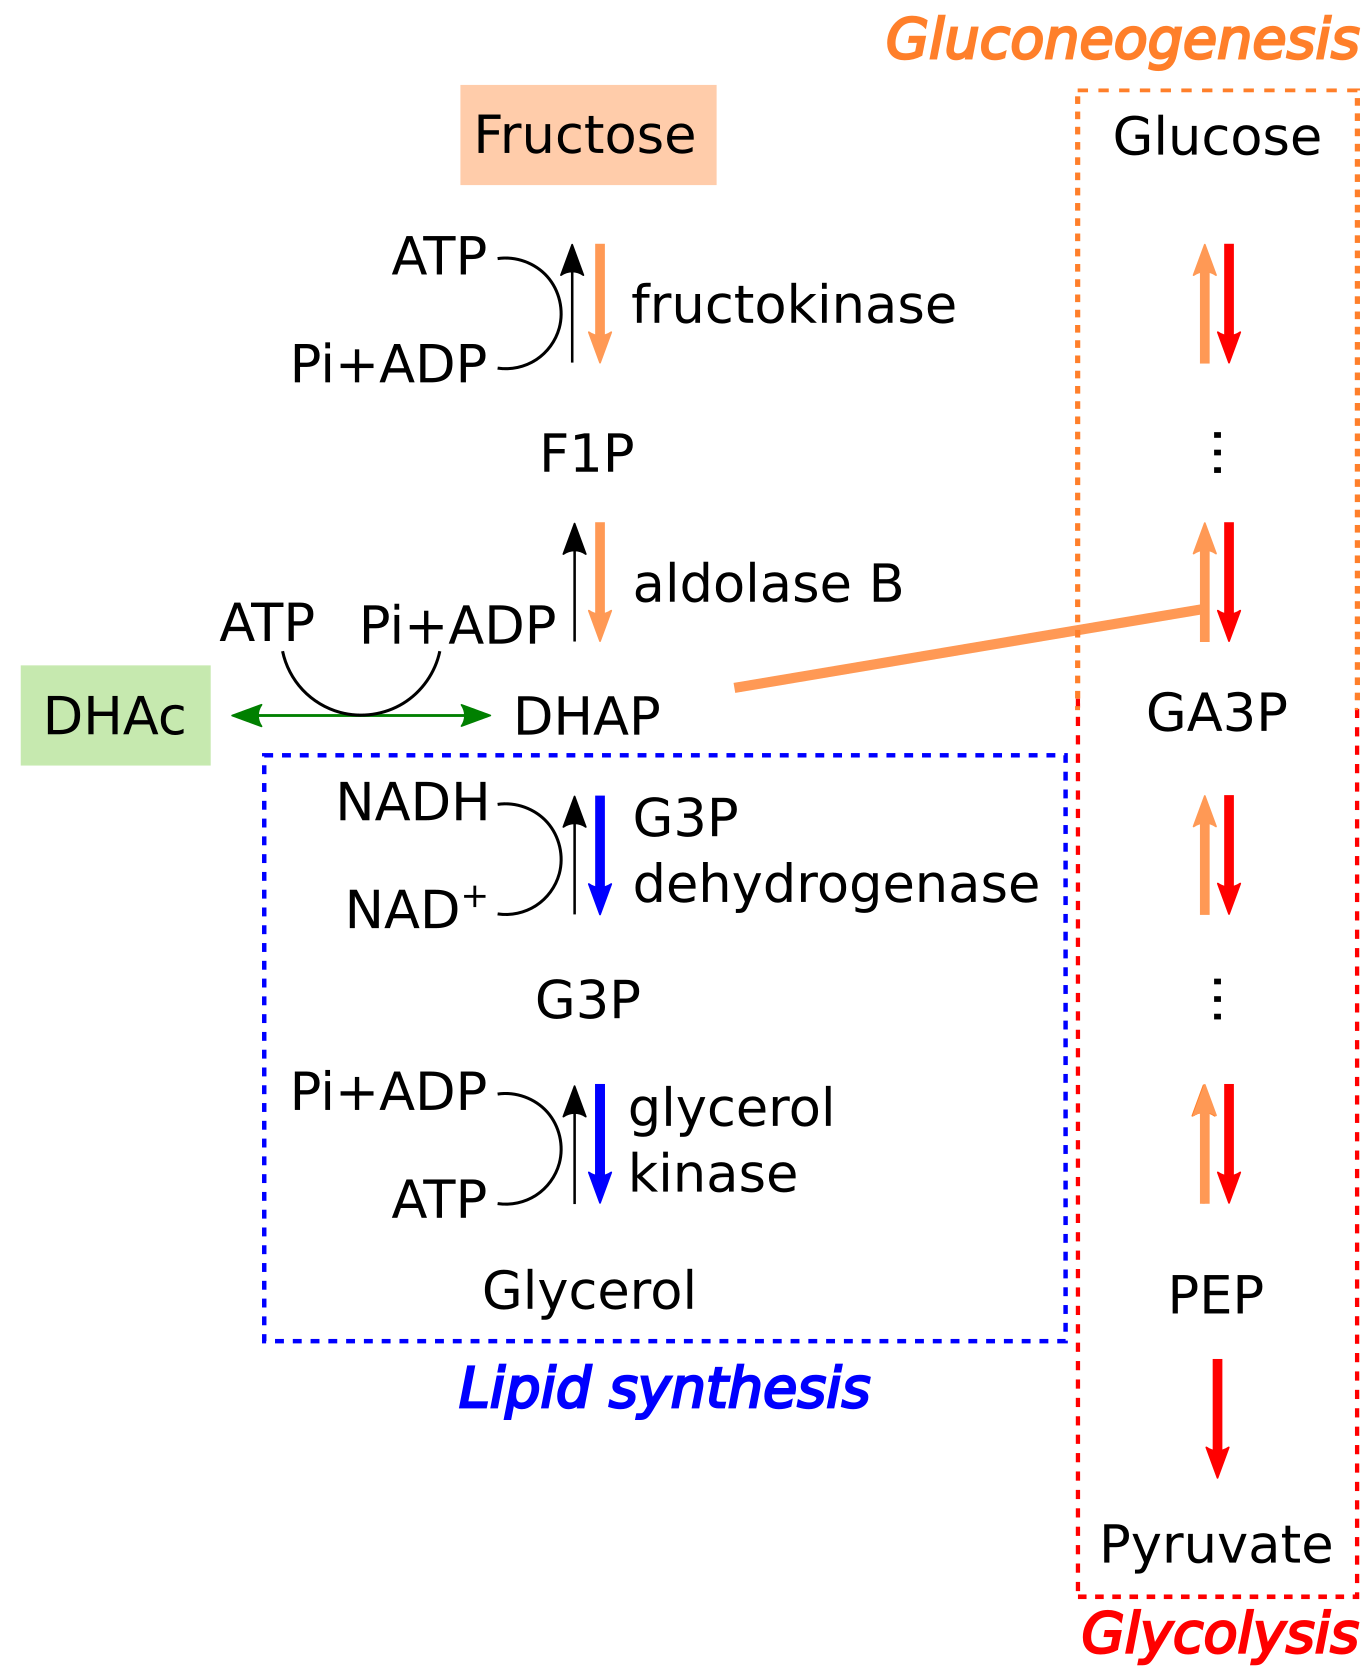
Common diseases, such as diabetes, cancer and obesity, can significantly alter the glucose metabolism pathways in the liver and affect the whole body glucose homeostasis. This study was designed to investigate acute changes in glucose metabolism in liver and kidneys in vivo, non-invasively, and in real-time after a bolus injection of a simple sugar, using hyperpolarized [2‑13C]DHAc. DHAc is a key substrate to probe gluconeogenic, glycolytic and lipogenic pathways in the liver in vivo, as it enters the glucose metabolic pathway at the glyceraldehyde 3-phosphate (GA3P) position (Fig. 1). It had been previously shown that the metabolic products of hyperpolarized [2‑13C]DHAc, i.e. [2‑13C]glycerol 3-phosphate (G3P) and [2‑13C]phosphoenolpyruvate (PEP), are readily observable with 13C-MRS in vivo1.Methods
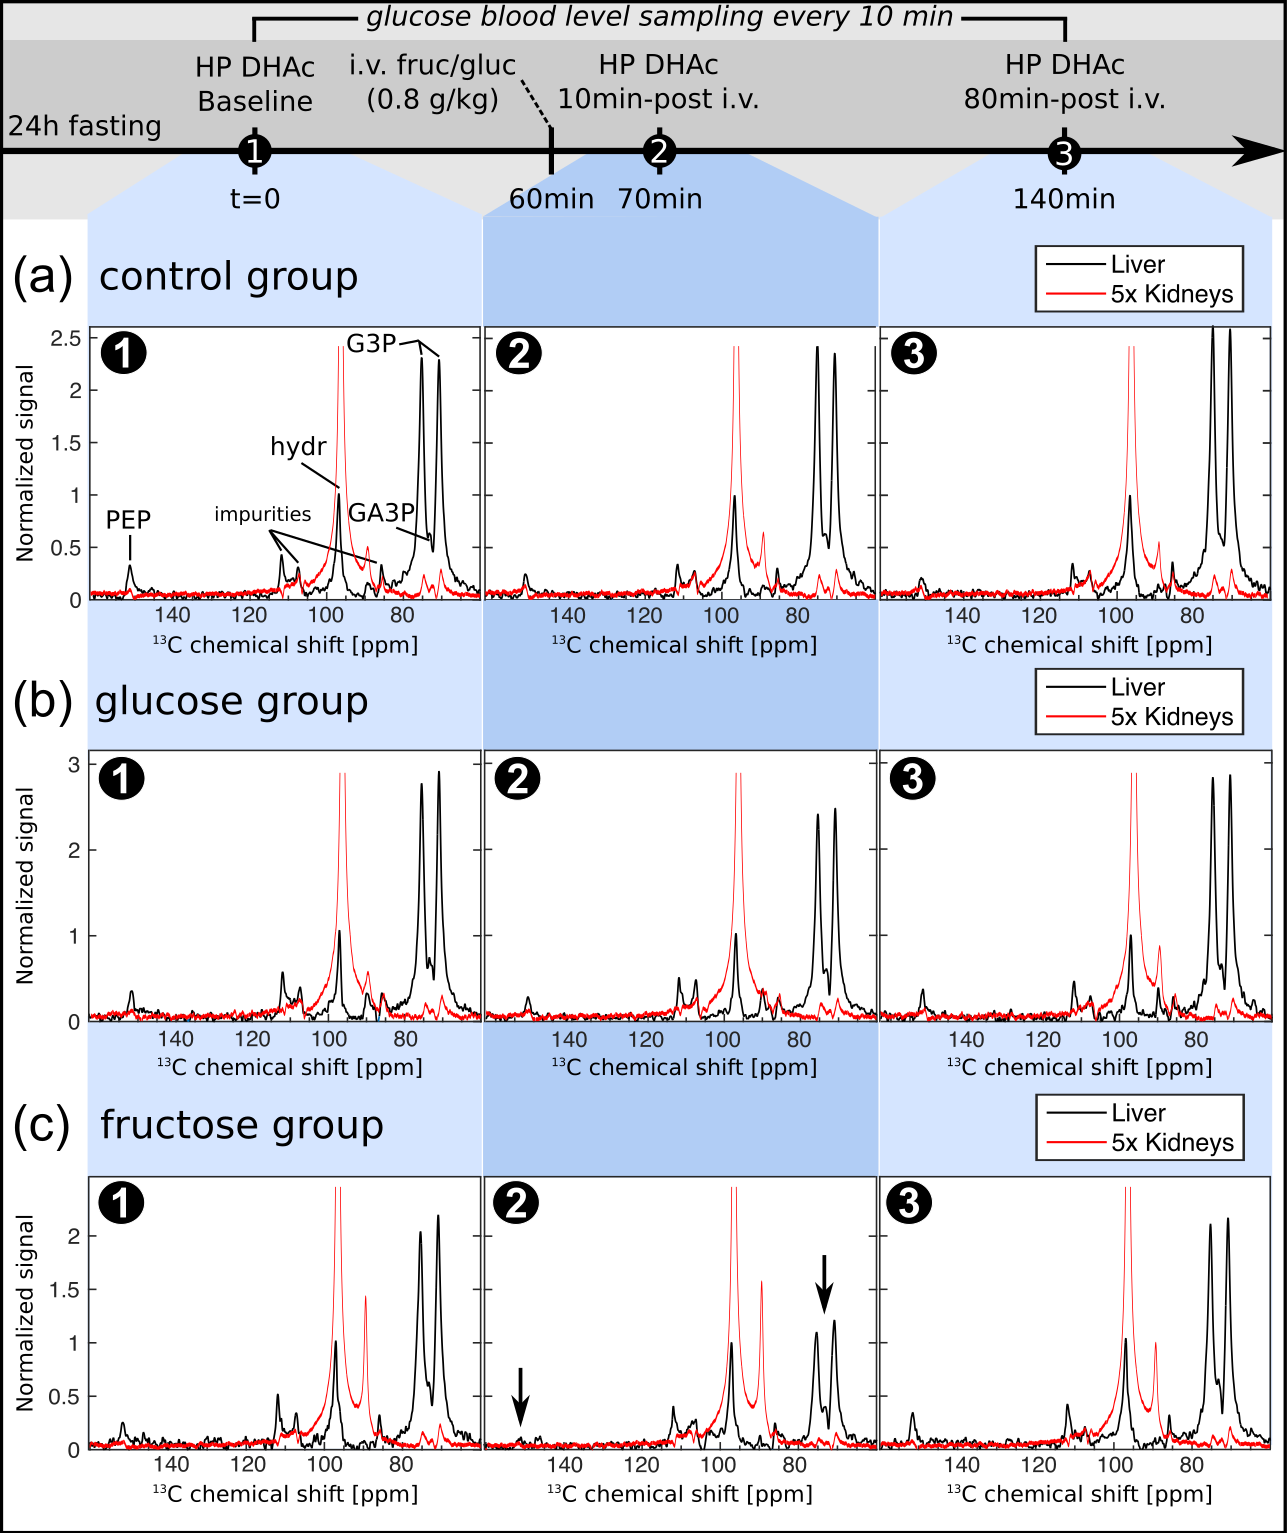
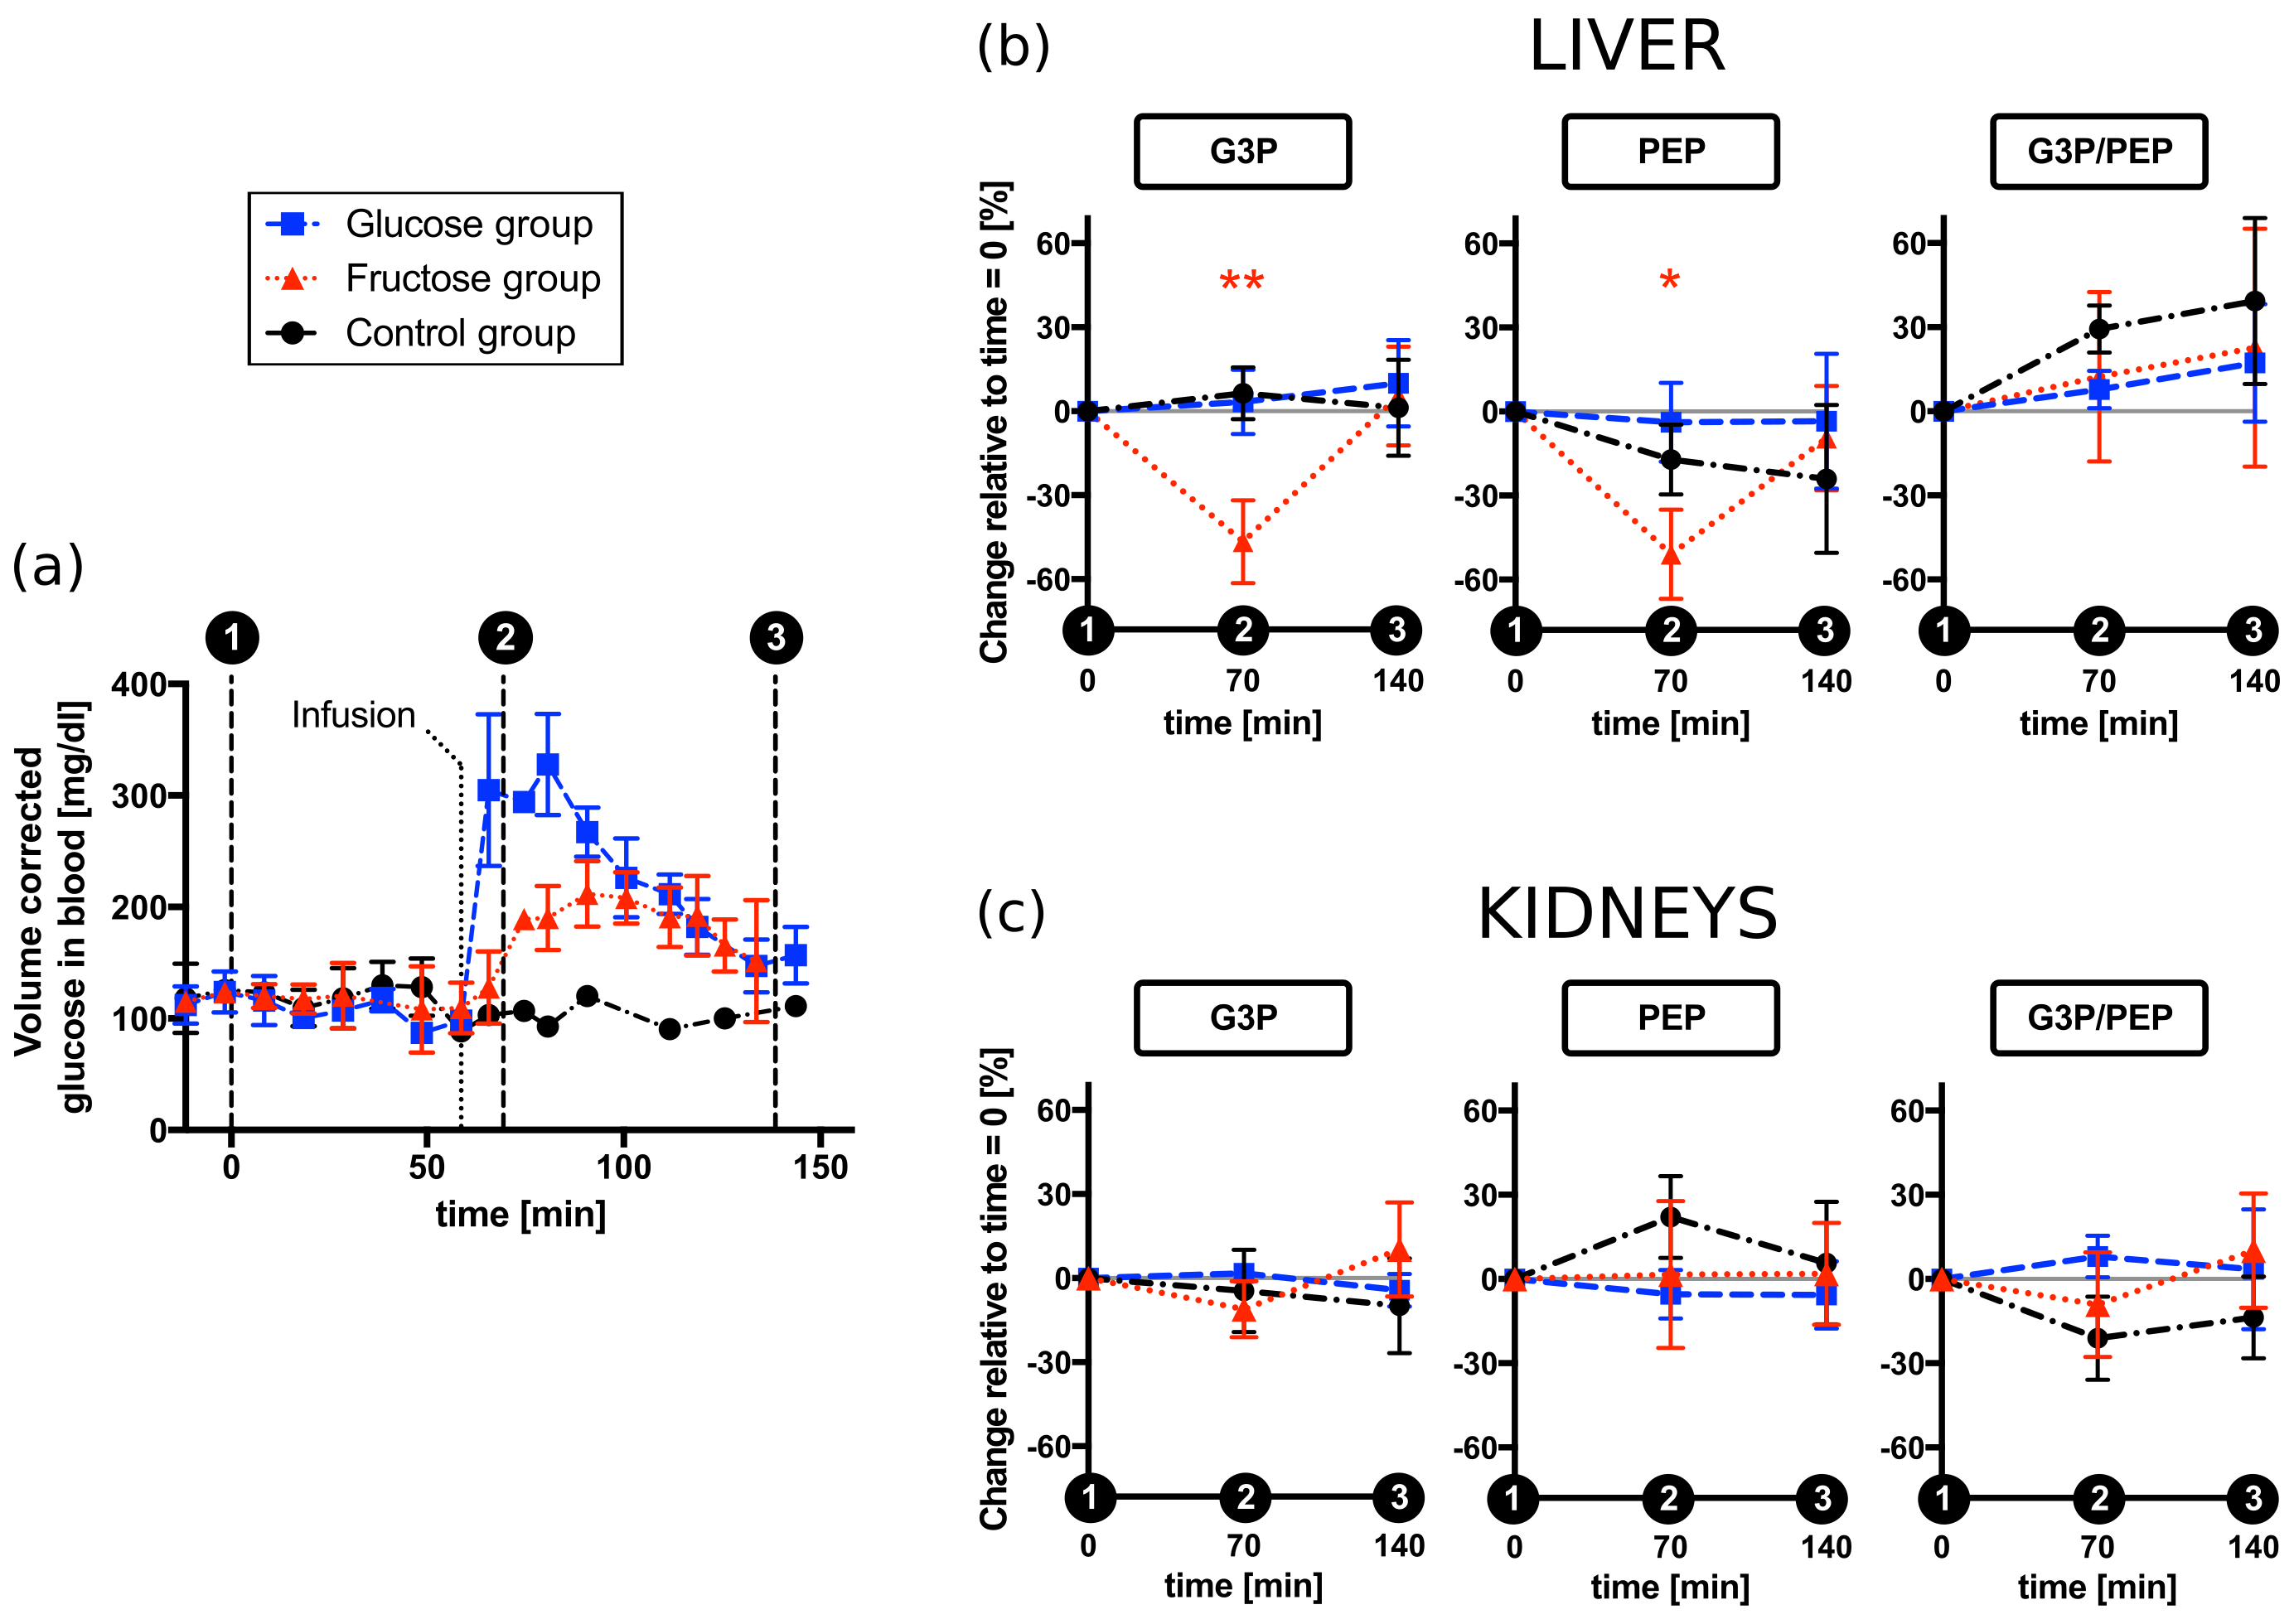
Metabolism was probed with hyperpolarized [2-13C]DHAc in thirteen 24h-fasted Sprague Dawley rats at three time points: 0, 70 and 140 minutes. At 60 minutes, rats were injected intravenously with fructose (n=5) or glucose (n=4) at 0.8 g/kg to initiate acute response. Controls (n=4) did not receive a carbohydrate challenge. 13C-MR spectra were acquired on a clinical MRI system equipped with 50 mT/m, 200 mT/m/ms gradients and a broadband RF amplifier using a specialized RF excitation pulse designed for independent flip angle control over five spectral-spatial excitation bands corrected for chemical shift misregistration effect. Technical details of this RF pulse have been reported previously1. Two adjacent axial slabs of 1 cm thickness centered on the liver and kidneys, respectively, were excited in a dynamic, alternating manner. The first spectrum was acquired 15 seconds after the beginning of the DHAc injection. There was a temporal delay of 1.5 s between the liver and kidney acquisitions. Additional acquisition parameters included: TR for dynamic acquisition = 3 s; receiver bandwidth = 10 kHz; number of points = 2048; flip angle = 0.3º at the DHAc resonance (213 ppm), 26º at the PEP resonance (151 ppm), 2.3º at the DHAc hydrate resonance (96 ppm), 20º at an additional resonance at 88 ppm, and 20º at the G3P resonance (73 ppm). 1H images were acquired for anatomic reference using a 3D balanced steady-state free precession (bSSFP) sequence (0.6 mm isotropic resolution, TE = 2.2 ms, TR = 5.3 ms). 13C RF power and center frequency calibration were performed using a 1 ml vial filled with 6.0 M 13C urea placed on the rat abdomen in the coil. Statistical significance of the results was determined by calculating a two-way, repeated-measurement ANOVA with Tukey’s multiple comparison test in Prism 7 (GraphPad Inc., La Jolla, CA). Performing one ANOVA test for each metabolite and organ, the test accounted for the three groups and the repeated, matched measurements. An adjusted P-value < 0.0167 (Bonferroni correction for three ANOVA tests) was considered significant.Results and Discussion
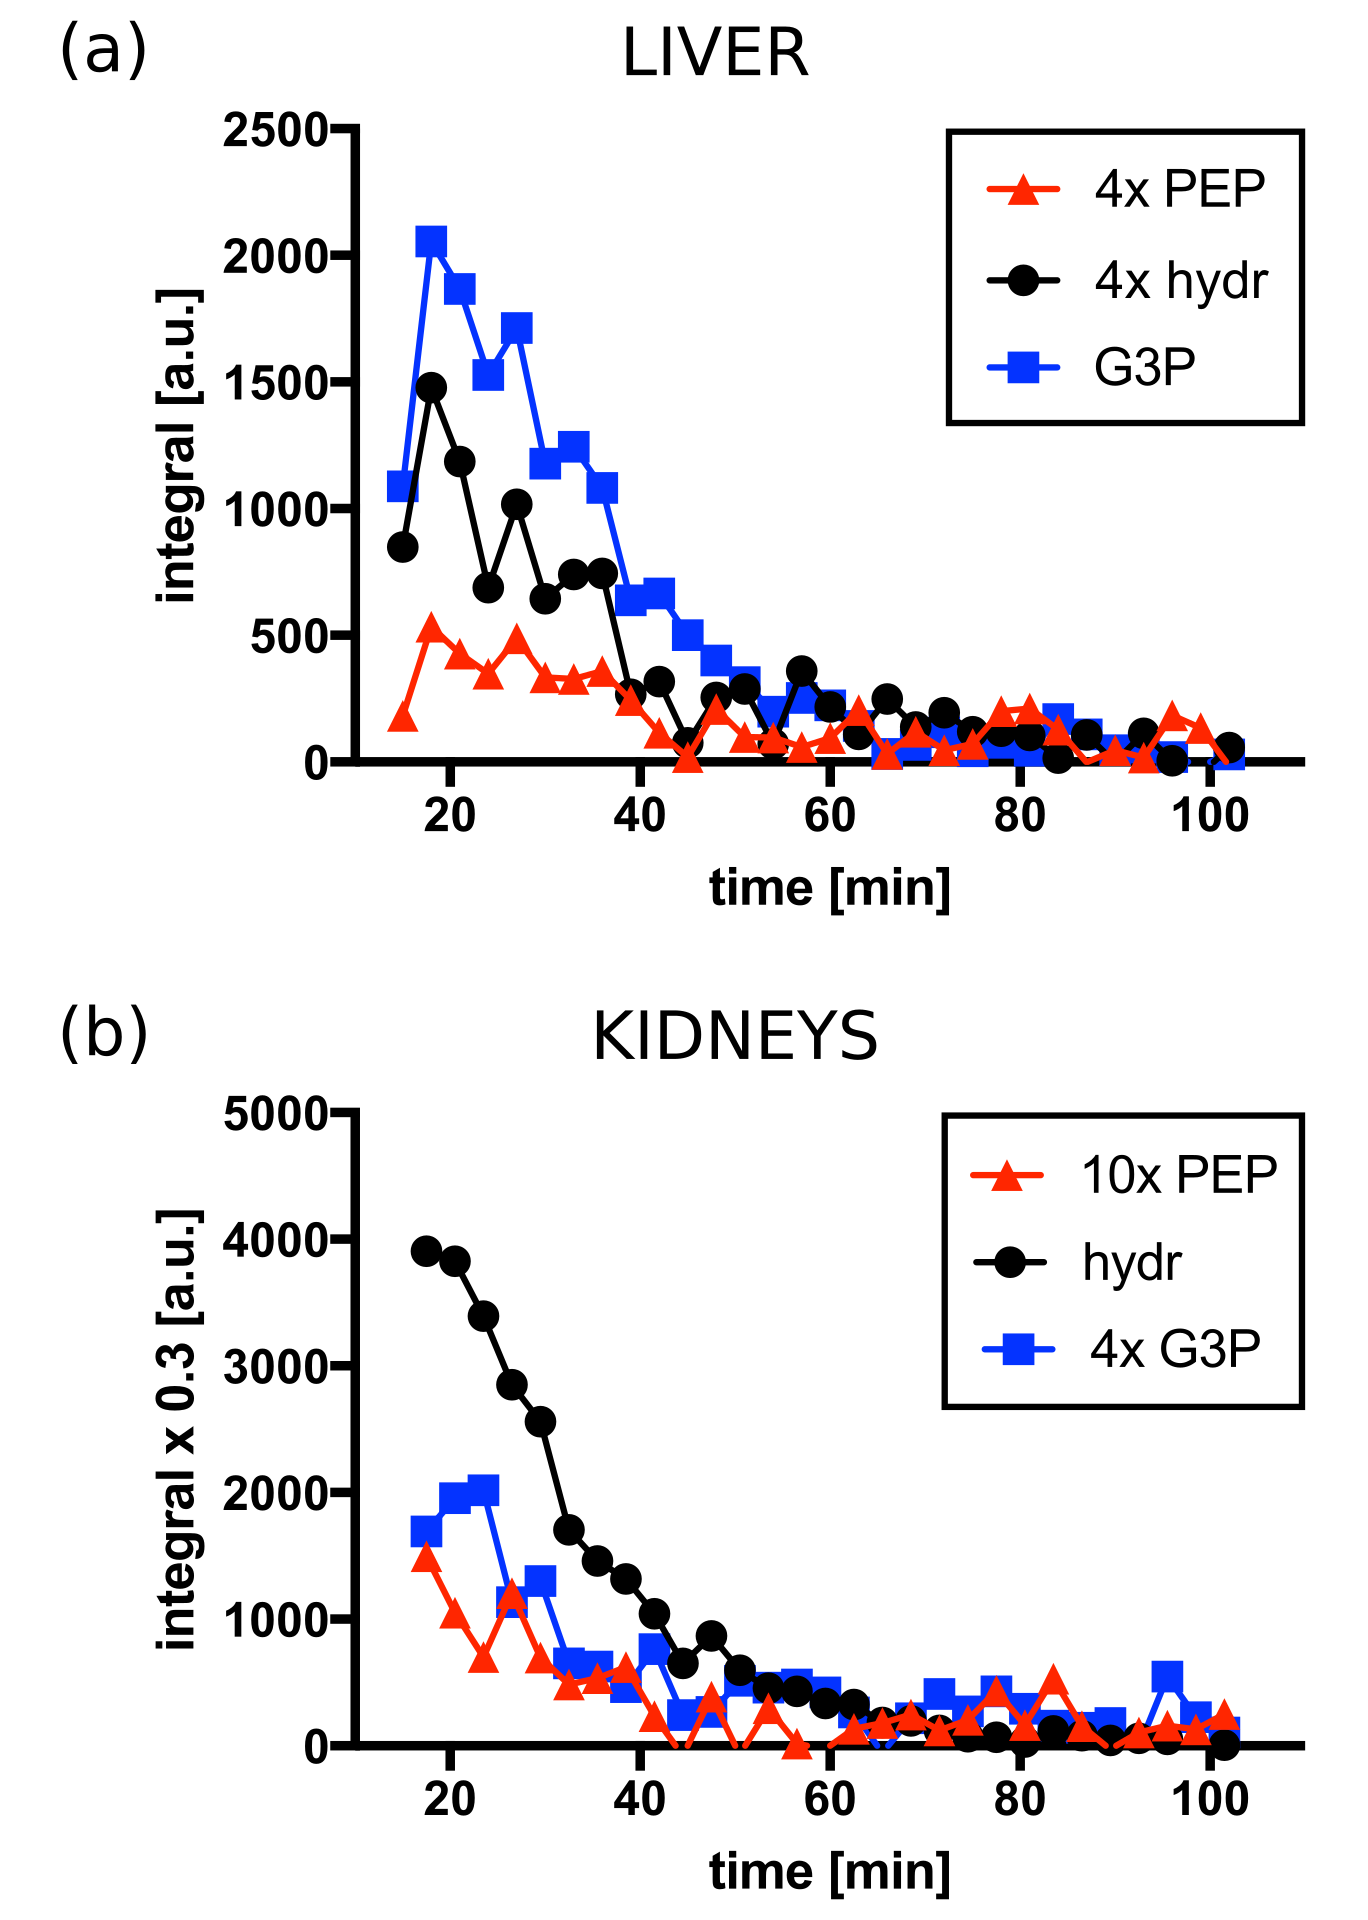
Figures 2 and 3 display the spectra and integral values, respectively, at the three sampling time points for both liver and kidneys. An example of the time-course of the integrals is shown in figure 4. Ten minutes after fructose infusion, blood glucose levels had not departed from baseline (Fig. 3a). However, levels of [2-13C]PEP and [2-13C]G3P halved in liver: 51% (P=0.0010) and 47% (P=0.0001) of baseline, respectively. In the kidneys, the slight decrease of the G3P integral measured was not significant (11%, P=0.0731). Seventy minutes later, levels of both PEP and G3P returned to baseline. Conversely, while the glucose challenge produced an immediate increase of the glucose concentration in blood, it did not alter the MRS signals significantly. The control group demonstrated that repeated administration of the DHAc imaging bolus did not perturb the circulating blood glucose (Fig. 4a) nor the MRS signals acquired at the three time points. Observed effects after a fructose challenge possibly include ATP depletion and changes in the unlabeled pool sizes of the glycolytic intermediates.Conclusion
Hyperpolarized [2-13C]DHAc detects a real-time, transient metabolic response of the liver to an acute fructose challenge. Because DHAc enters the glucose metabolism at the intermediate triose phosphate level, in the vicinity of fructose, it is ideally suited for assessing changes in aberrant glucose or glycerol metabolism. DHAc may probe alterations in hepatic energy homeostasis or key enzyme activities (such as G3P dehydrogenase) occurring in diabetes2, obesity3 or cirrhosis4, in a non-invasive manner.Acknowledgements
We thank Dr. I. E. Allen from the Epidemiology and Biostatistics Department (UCSF) for advice on the statistical analysis. This work was supported by an intramural UCSF radiology department seed grant, and NIH grants P41EB013598, P41EB015908, R21EB016197, and R37HL34557. CVM was supported by NIH K01DK099451.References
1. Marco-Rius I, et al. Multiband spectral-spatial RF excitation for hyperpolarized [2-13C]dihydroxyacetone 13C-MR metabolism studies. Magn Reson Med. 2016 (epub ahead of print).
2. Szendroedi J, et al. Abnormal hepatic energy homeostasis in type 2 diabetes. Hepatology. 2009; 50(4):1079–1086
3. Swierczynski J, et al. Enhanced glycerol 3-phosphate dehydrogenase activity in adipose tissue of obese humans. Mol Cell Biochem. 2003;254:55–59.
4. Changani KK, et al. Evidence for altered hepatic gluconeogenesis in patients with cirrhosis using in vivo 31-phosphorus magnetic resonance spectroscopy. Gut. 2001;49(4):557–64.
Figures