0165
Metabolic imaging of neuroinflammation in the cuprizone mouse model for Multiple Sclerosis using hyperpolarized [1-13C] pyruvate1Department of Physical Therapy and Rehabilitation Science, University of California San Francisco, San Francisco, CA, United States, 2Surbeck Laboratory of Advanced Imaging, Department of Radiology and Biomedical Imaging, University of California San Francisco, San Francisco, CA, United States, 3Bio-Imaging Lab, Department Pharmaceutical, Veterinary and Biomedical Sciences, University of Antwerp, Antwerp, Belgium, 4Surbeck Laboratory of Advanced Imaging, Department of Radiology and Biomedical Imaging, San Francisco, CA, United States
Synopsis
Our study demonstrates that metabolic imaging of hyperpolarized [1-13C] pyruvate can detect increased hyperpolarized lactate production in vivo in highly inflammatory white matter lesions in a preclinical model of Multiple Sclerosis. Increased lactate production was associated with the presence of pro-inflammatory macrophages upregulating pyruvate dehydrogenase kinase 1, as well as regional inhibition of pyruvate dehydrogenase, providing a likely mechanism for a decrease subsequent flux of pyruvate towards the Krebs cycle. Our study demonstrates that metabolic imaging of hyperpolarized [1-13C] pyruvate has high potential for in-vivo detection and monitoring of neuroinflammation levels during demyelination and remyelination.
INTRODUCTION
Activated mononuclear phagocytes (MPs, macrophages/microglia) are key players in the progression of multiple sclerosis (MS). Upon activation, MPs undergo metabolic reprogramming, and have been shown to increase their lactate production1,2 through inhibitory phosphorylation of the pyruvate dehydrogenase (PDH) complex by the pyruvate dehydrogenase kinase 1 (PDK1) enzyme3,4. We thus questioned if hyperpolarized 13C Magnetic Resonance Spectroscopic Imaging (HP 13C MRSI) of pyruvate5 could be used to assess increased pyruvate to lactate conversion linked to MPs activation in MS. To do so, we longitudinally studied the toxin-induced cuprizone (CPZ) mouse model, a well established MS model6 using metabolic imaging and biochemical correlates. We demonstrated that HP 13C MRSI of pyruvate could detect MPs activation non-invasively during disease progression, thus providing a new tool for detection of neuroinflammation in vivo.METHODS
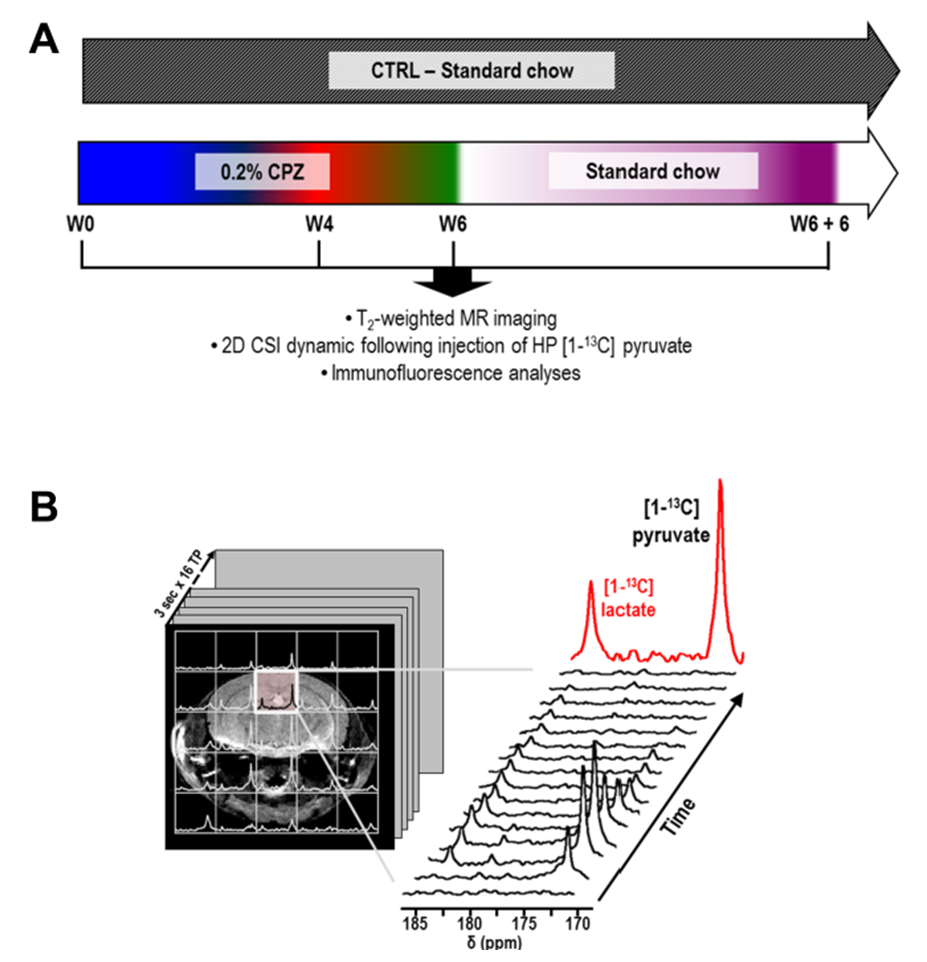
Animals: C57BL/6J mice (n=7) received a 0.2% CPZ diet for 6 weeks and were returned to standard chow for an additional 6 weeks. Aged-matched control (CTRL) received a standard rodent chow (n=7)6. All mice were imaged prior (W0) and after 4 and 6 weeks of CPZ (W4 CPZ, W6 CPZ) and after recovery (W6+W6 recovery) (Fig.1A).
MR acquisitions: T2-weighted images were acquired for assessement of the corpus callosum (CC) location, region of maximum inflammation in the CPZ model (TE/TR=20/1200ms, thickness=0.5mm, NA=2, matrix=256x256, FOV=30x30mm²). For HP 13C MRS, 24μL of [1-13C] pyruvate preparation was hyperpolarized using a Hypersense DNP polarizer (Oxford Instruments) for one hour5. After dissolution, HP pyruvate was rapidly dissolved in isotonic buffer (pH~7) and injected intravenously (iv) over 12sec. From the beginning of iv injection, 2D dynamic CSI 13C data were acquired on a 14.1T MR system using: TE/TR=1.2/60ms; SW 2500Hz; 128points; 4sec resolution; FA=10deg; FOV=24x24 mm²; 5mm thickness.
Immunofluorescence (IF): IF analyses were performed for myelin (MBP), MPs (Iba-1), astrocytes (GFAP) and PDK1 (n=3 mice per group). PDH activity in the CC was assessed using a PDH activity assay kit (Abcam) (n=4 mice per group).
Data analysis: HP lactate and HP pyruvate levels were calculated as the sum of integrals over time (Fig.1B). For both MR and IF data, CPZ and CTRL groups were compared using one-way anova and longitudinal analyses of HP 13C MRSI using repeated measures (*p<0.05, **p<0.01, ***p<0.001).
RESULTS
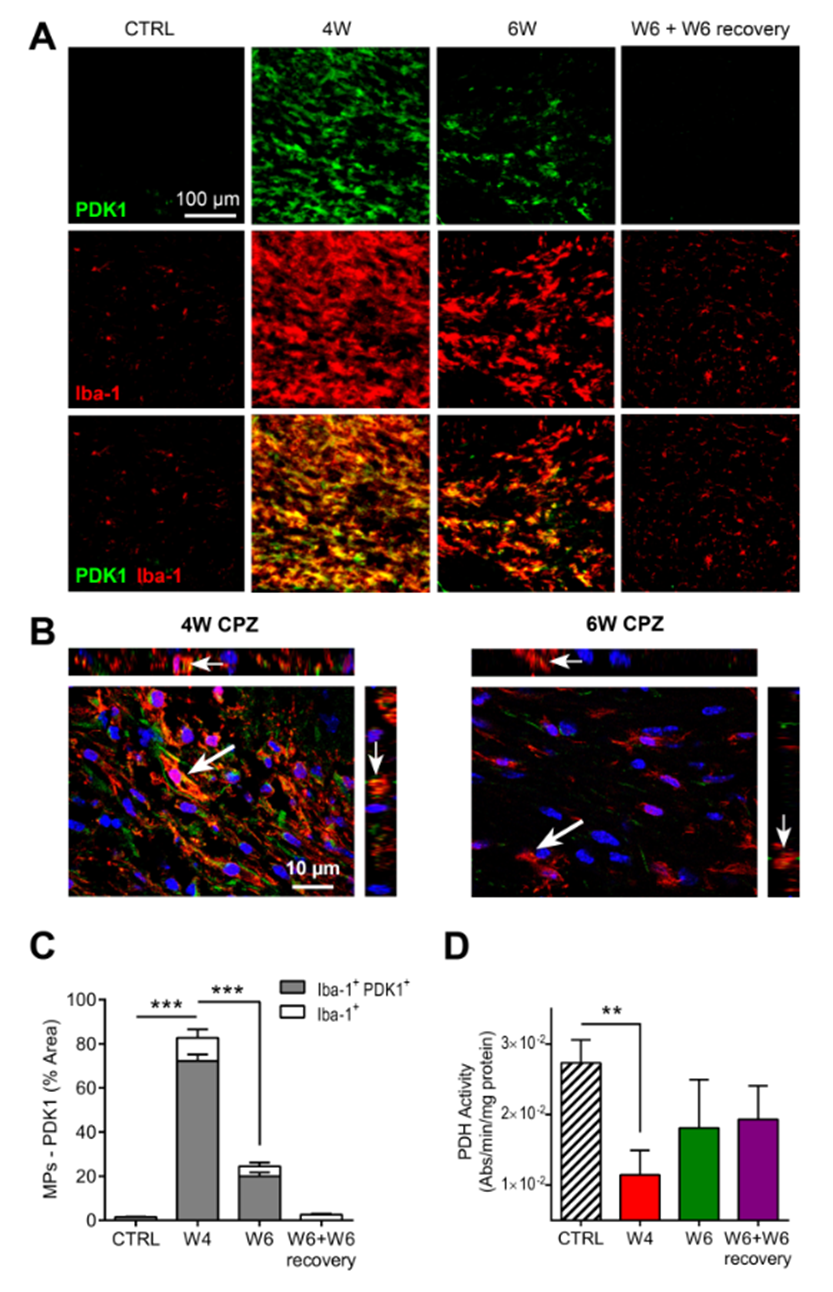
IF analysis indicated demyelination (MBP) and highest MPs (Iba-1) at W4 CPZ, confirming the effect of the CPZ diet. Upon CPZ removal, remyelination and decreased MPs was observed. In contrast, astrogliosis (GFAP) reached its maximum at W6 CPZ (Fig.2A).
T2-weighted images showed hyperintensity in the CC at W4 and W6 CPZ (arrows) as compared to W0. Importantly, T2 hyperintensity was not significantly different between W4 and W6 CPZ, even though these two time points are linked to different underlying cellular events, (W4: high demyelination/high inflammation; W6: partial remyelination/low inflammation) (Fig.2B).
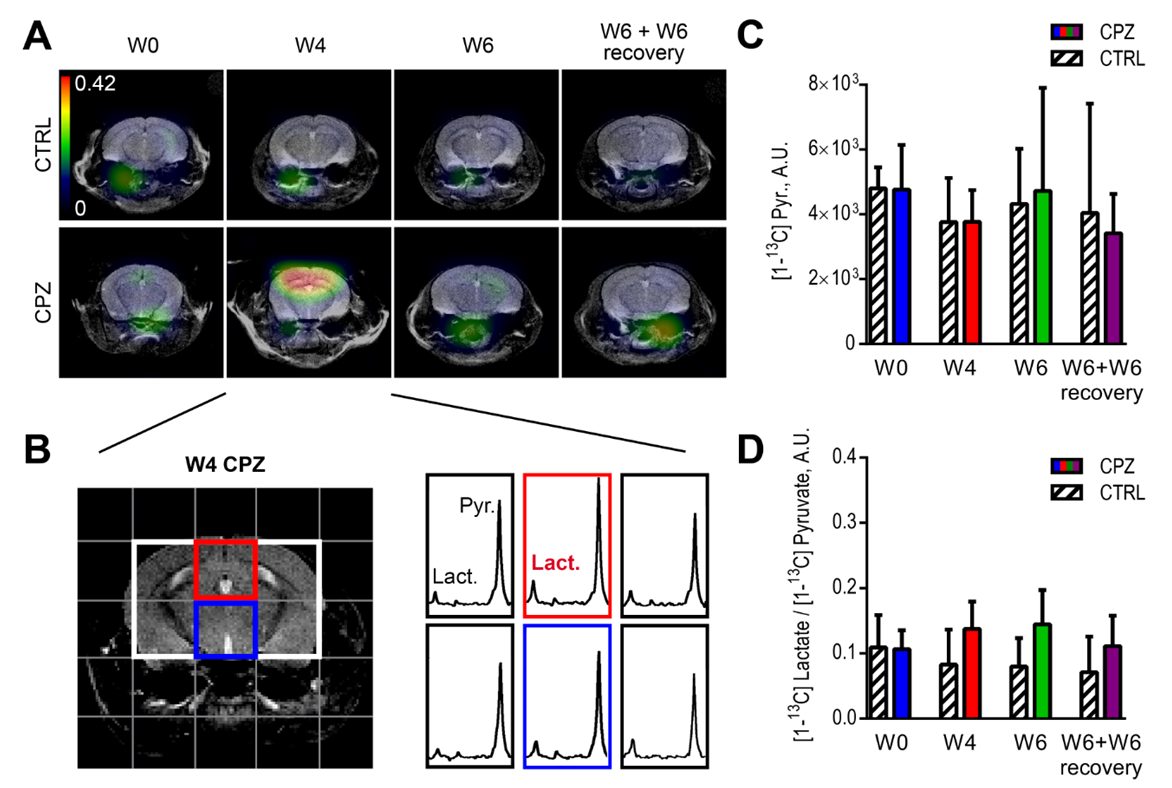
In contrast, HP 13C MRS of pyruvate could detect neuroinflammatory events. While the pyruvate delivery remained stable over time in all experimental groups (Fig.3A,B), HP [1-13C] lactate/pyruvate ratios were significantly increased at W4 in the CC of CPZ animals as compared to CTRL (315±338%, p=0.0006) (Fig.3C). Longitudinal analyses of the HP [1-13C] lactate-to-pyruvate ratios show a significant increase at W4 (96±74% of W0, p=0.0002) followed by a decrease at W6 and W6+W6 recovery (Fig.3D).
The increase of HP lactate production at W4 CPZ was restricted to the CC as shown on the HP lactate-to-pyruvate ratio heatmaps and corresponding spectra (red voxel) (Fig.4A,B). In contrast, pyruvate delivery and HP lactate-to-pyruvate ratios were not significantly different between CTRL and CPZ groups in the thalamic region (blue voxel) (Fig.4B-D).
IF analyses confirmed that increased HP lactate-to-pyruvate ratio was associated with a strong upregulation of PDK1 in activated MPs at W4 CPZ (p<0.0001), as illustrated on the merged image (Fig.5A-C). Furthermore, significant inhibition of PDH activity was measured in the CC at W4 CPZ (p=0.0026) (Fig.5D).
CONCLUSIONS
All together, our results demonstrate that 13C
MRSI of HP [1-13C] pyruvate can detect increased lactate production in vivo in a preclinical MS model, and
that this increase is associated at the cellular level with the presence of
activated MPs that upregulate PDK1 as well as the enzymatic level with an inhibition
of PDH activity that likely contributes to pushing the flux of pyruvate towards
lactate production. Importantly, this report is the first to demonstrate the
use of a metabolic imaging method to monitor neuroinflammation. Because HP 13C
MRSI is clinically translatable and expanding rapidly, this study is of high
significance for future clinical trials not only on MS, but also all
neurological diseases presenting an inflammatory component.Acknowledgements
IWT-Vlaanderen PhD grant; NMSS_PP3395; Cal-BRAIN349087; UCSF_RAP7500634; UCSF Department of Radiology seed grants #14-04 & #14-05; NIH-funded Hyperpolarized MRI Technology Resource Center #P41EB013598.References
[1] Galvan-Pena S & O'Neill LA (2014) Metabolic reprograming in macrophage polarization. Front Immunol 5:420.
[2] Tannahill GM, Iraci N, Gaude E, Frezza C, & Pluchino S (2015) Metabolic reprograming of mononuclear phagocytes in progressive multiple sclerosis. Frontiers in immunology 6:106.
[3] Tan Z, et al. (2015) Pyruvate dehydrogenase kinase 1 participates in macrophage polarization via regulating glucose metabolism. J Immunol 194(12):6082-6089.
[4] Meiser J, et al. (2016) Pro-inflammatory Macrophages Sustain Pyruvate Oxidation through Pyruvate Dehydrogenase for the Synthesis of Itaconate and to Enable Cytokine Expression. The Journal of biological chemistry 291(8):3932-3946.
[5] Kurhanewicz J, et al. (2011) Analysis of cancer metabolism by imaging hyperpolarized nuclei: prospects for translation to clinical research. Neoplasia 13(2):81-97.
[6] Praet J, Guglielmetti C, Berneman Z, Van der Linden A, & Ponsaerts P (2014) Cellular and molecular neuropathology of the cuprizone mouse model: clinical relevance for multiple sclerosis. Neuroscience and biobehavioral reviews 47:485-505.
Figures