0162
Chemical Shift Imaging of pH with Hyperpolarized [2-13C,D10] Diethylmalonic Acid1Radiology and Biomedical Imaging, University of California, San Francisco, San Francisco, CA, United States, 2Bioengineering, University of California, Berkeley, Berkeley, CA, United States
Synopsis
Imaging tumoral pH may aid in characterizing aggressiveness, metastasis, and therapeutic response. The study of hyperpolarized (HP) 13C chemical shift-based probes addresses some of the limitations of previously reported ratiometric methods, including HP 13C bicarbonate. We report the development of HP [2-13C,D10] diethylmalonic acid as a pH imaging agent, which exhibits a significant 13C chemical shift difference over the physiologic pH range. We demonstrate that this compound can be copolarized with tert-butanol to accurately measure pH in phantom studies. Furthermore, this HP compound showed high in vivo SNR in a murine model of prostate cancer.
Purpose
To characterize and develop a dicarboxylic acid as a high-resolution HP 13C magnetic resonance spectroscopic (MRS) imaging agent for pH.Methods
All spectroscopic studies were performed at 11.7T and 37°C. All imaging was performed on a 3T clinical MRI scanner. Spectral pH values were compared with standard pH electrode measurements. 2D chemical shift imaging (2D CSI) had a 25kHz spectral bandwidth and 2048 spectral points. Imaging data were processed using SIVIC software1.
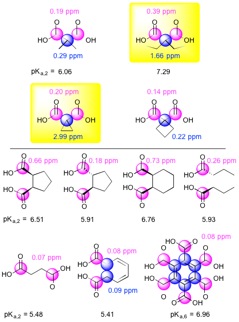
Dicarboxylate screening: 250mM solutions of ten different compounds were prepared with urea (chemical shift standard) at pH 6.5 and 7.4., and 13C MRS chemical shifts (Δppm) for each solution were measured.
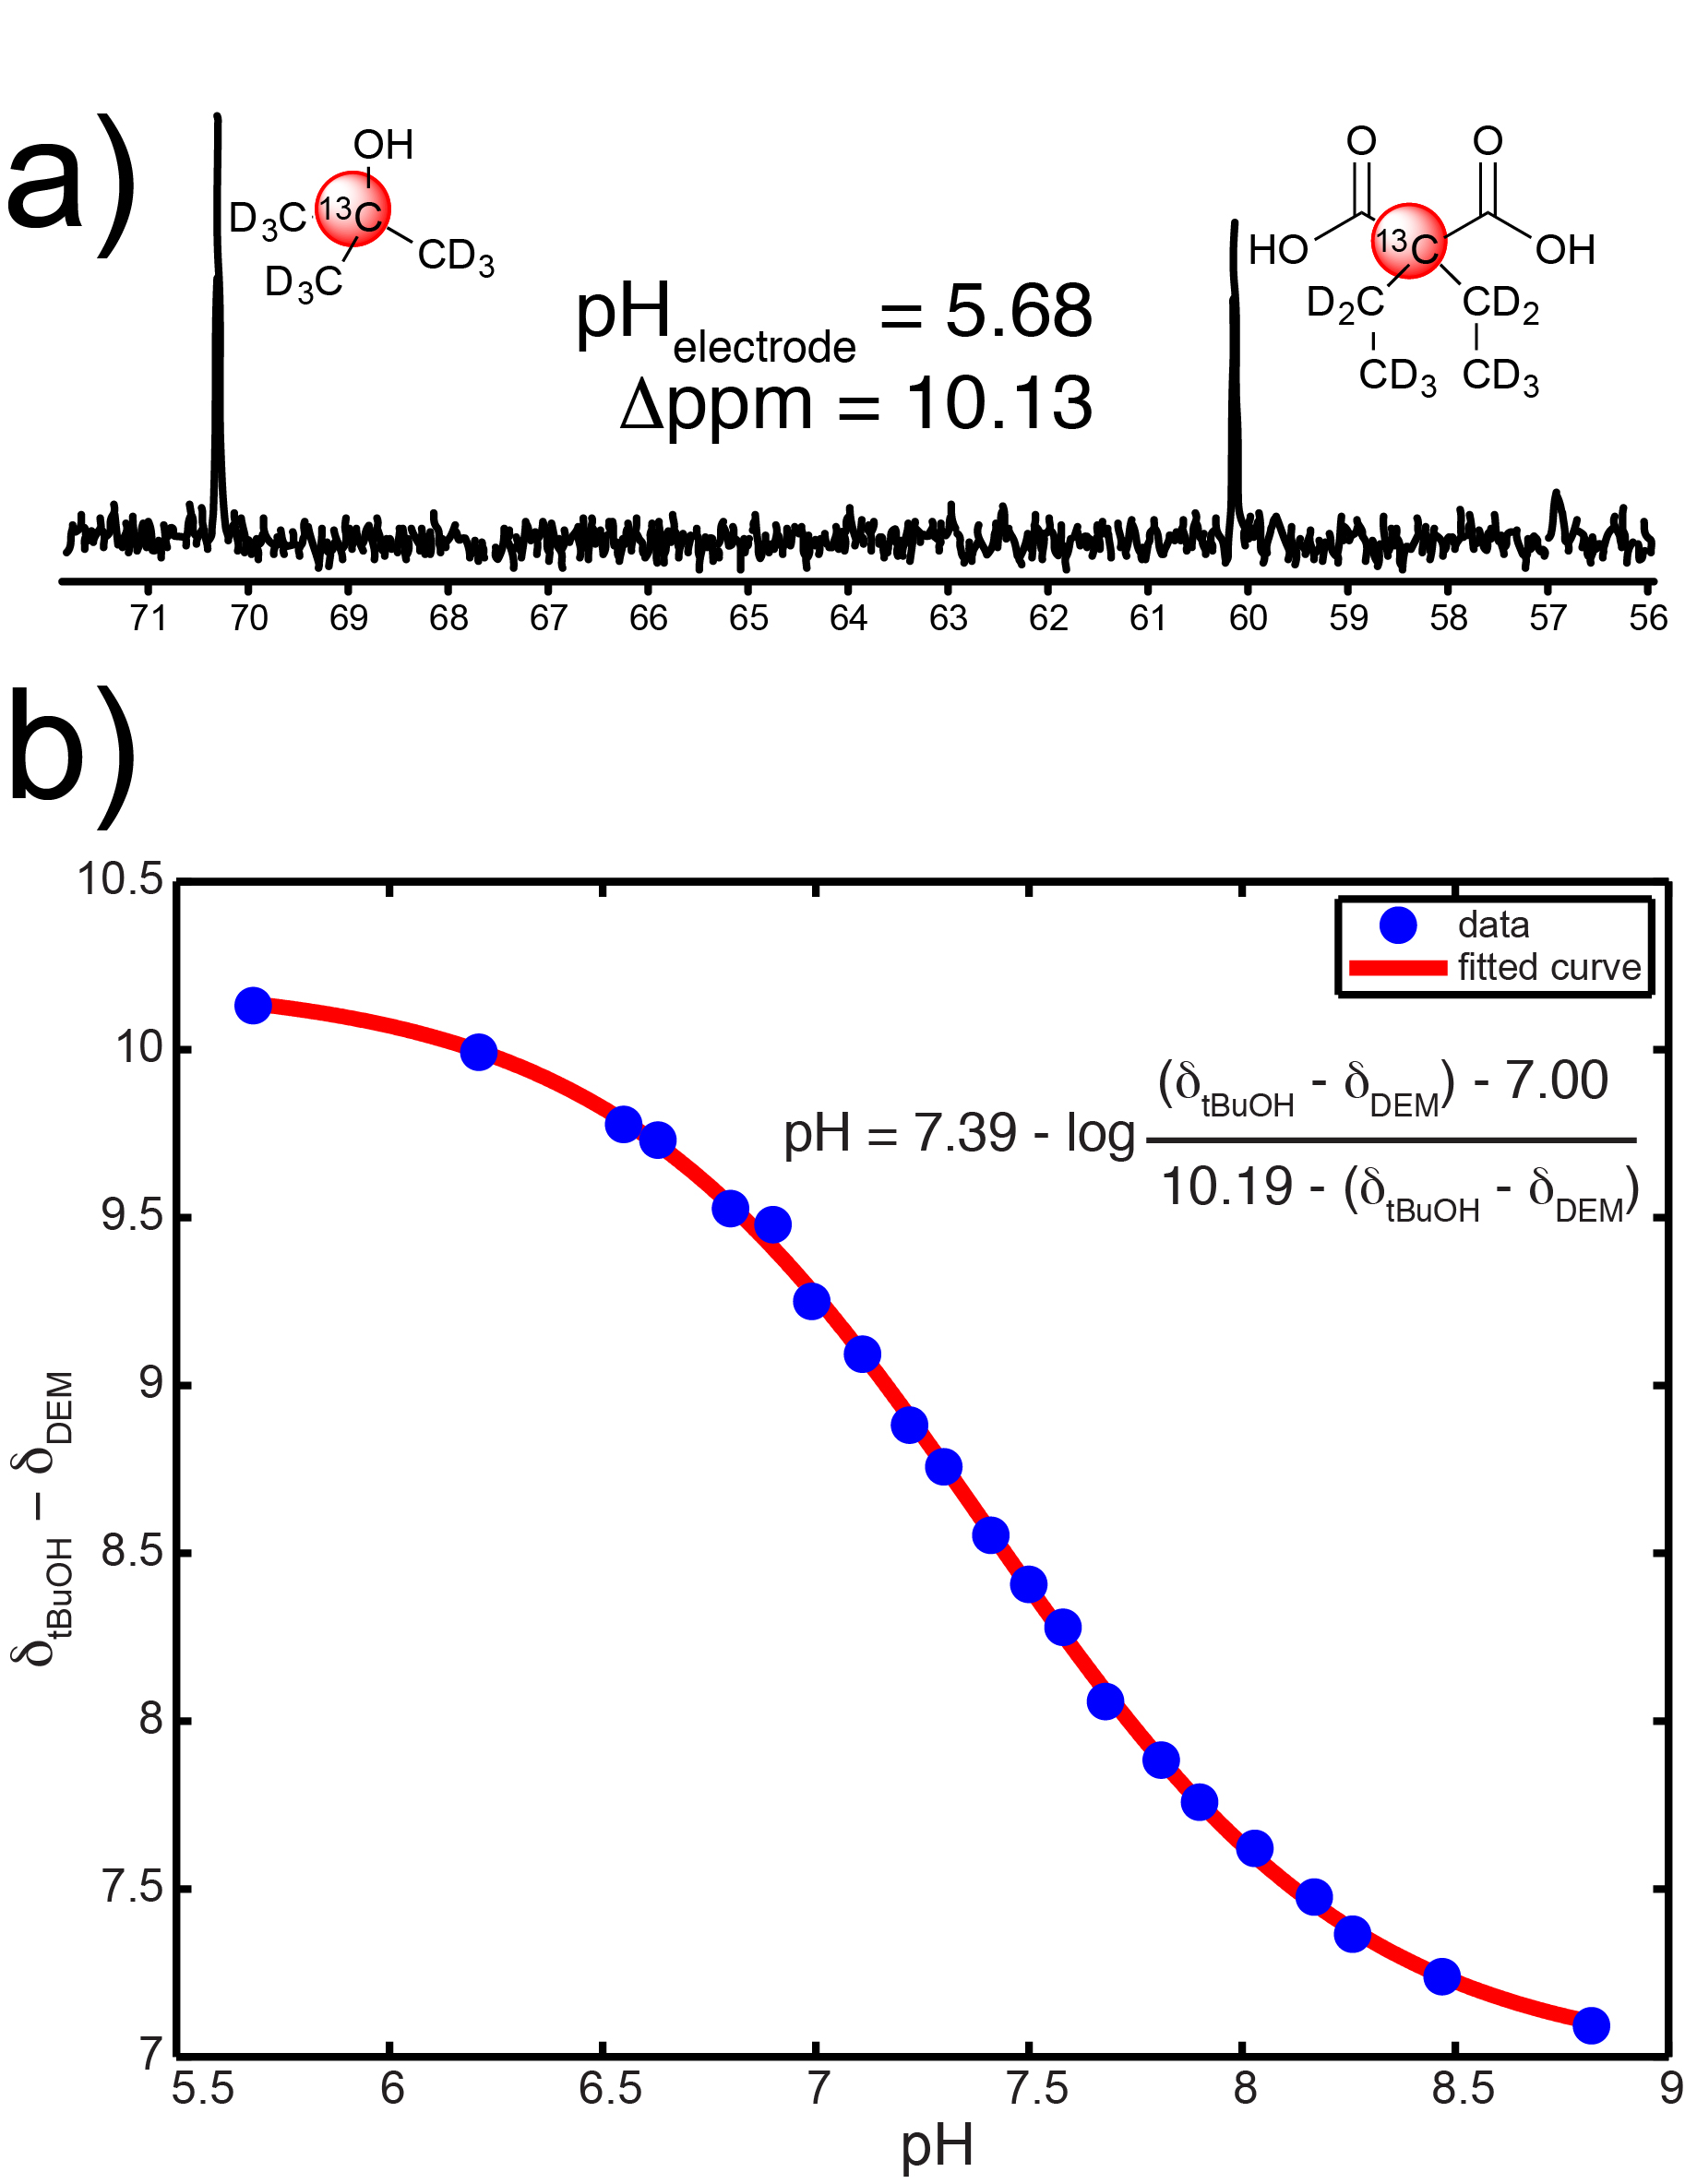
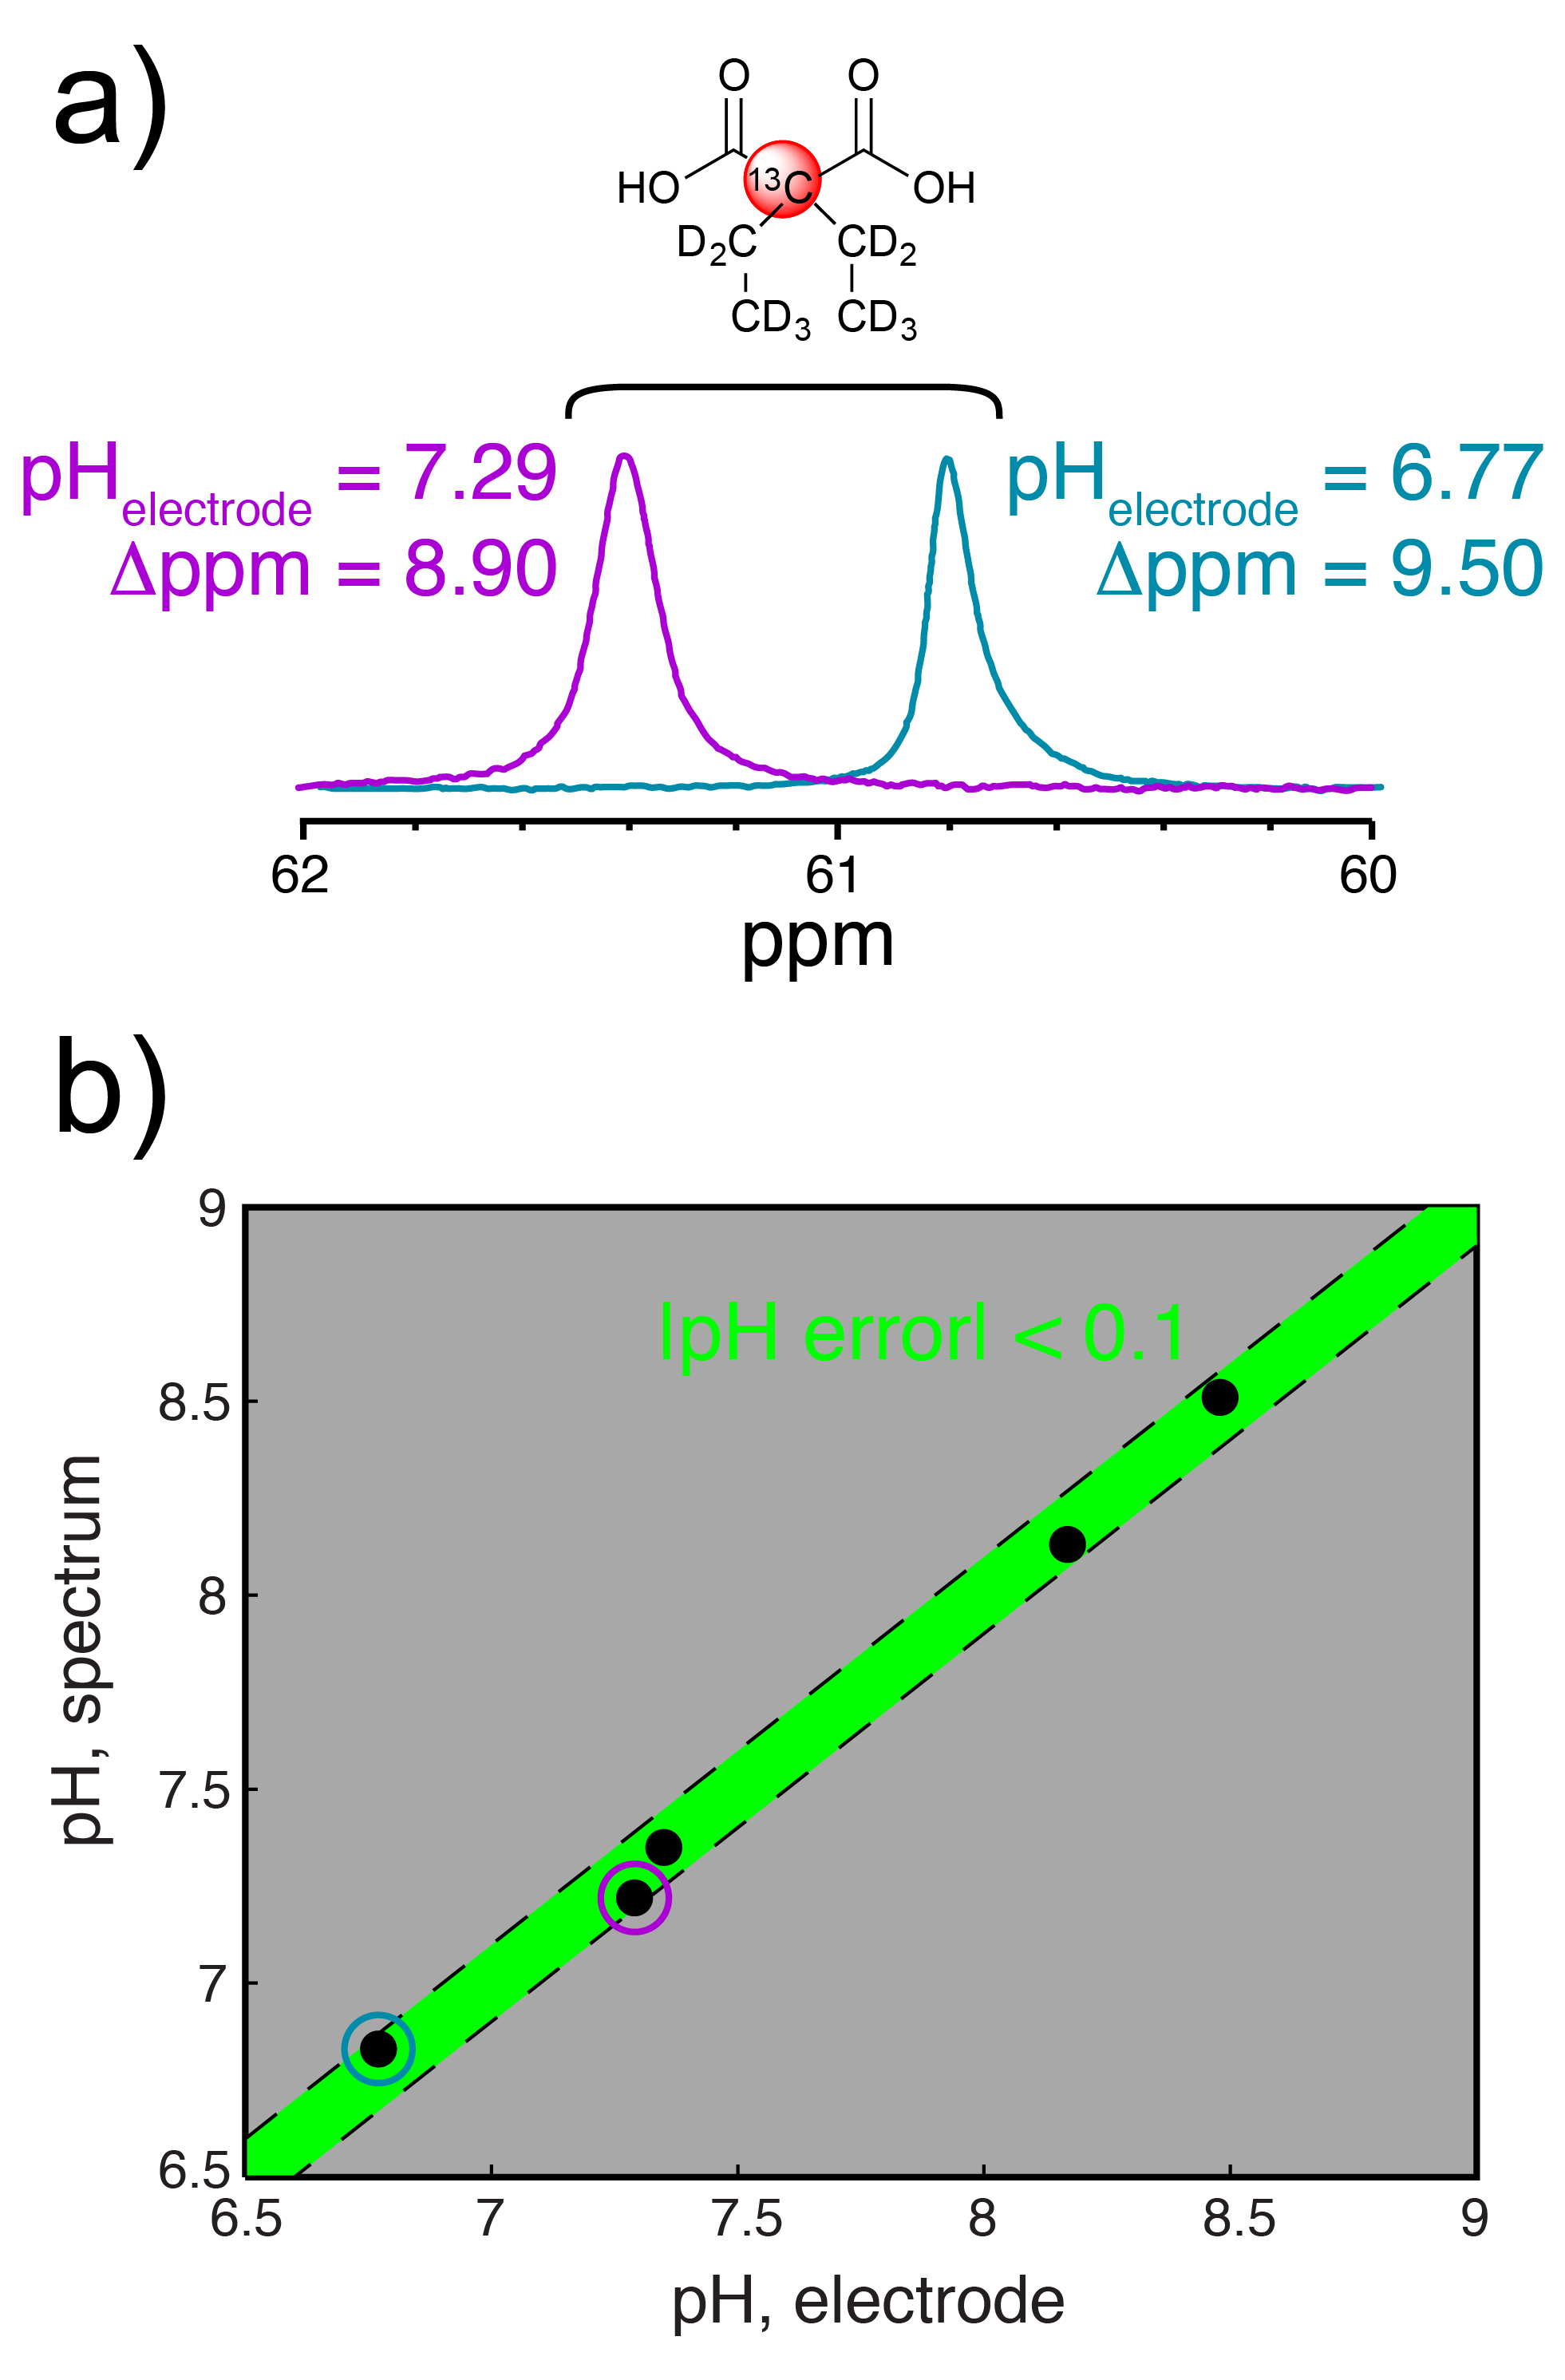
Diethylmalonic acid characterization: 5mM solutions of [2-13C,D10] diethylmalonic acid (DEMA) and [1-13C,D9] tert-butanol (tBuOH, chemical shift standard) were prepared from pH 5.6-8.8. The Δppm between the labeled carbons was measured, plotted versus pH, and fitted to a sigmoidal curve2 to obtain an MR titration curve. 13C spectra of 5mM DEMA and tBuOH were also acquired in fetal bovine serum at pH 6.6 and 7.4.
DEMA hyperpolarization: ~3.8M DEMA in N,N-dimethylacetamide was prepared with 15mM OX063 trityl radical and 2mM Gd-DOTA and copolarized with tBuOH and OX063 in glycerol. After dissolution and NaOH titration, the HP solution-state T1 and polarization were determined via dynamic 13C MRS (5° hard pulses, flip angle correction, TR = 3s, n = 3). The pH was calculated at ~170s post-dissolution using the 13C Δppm and MR titration curve.
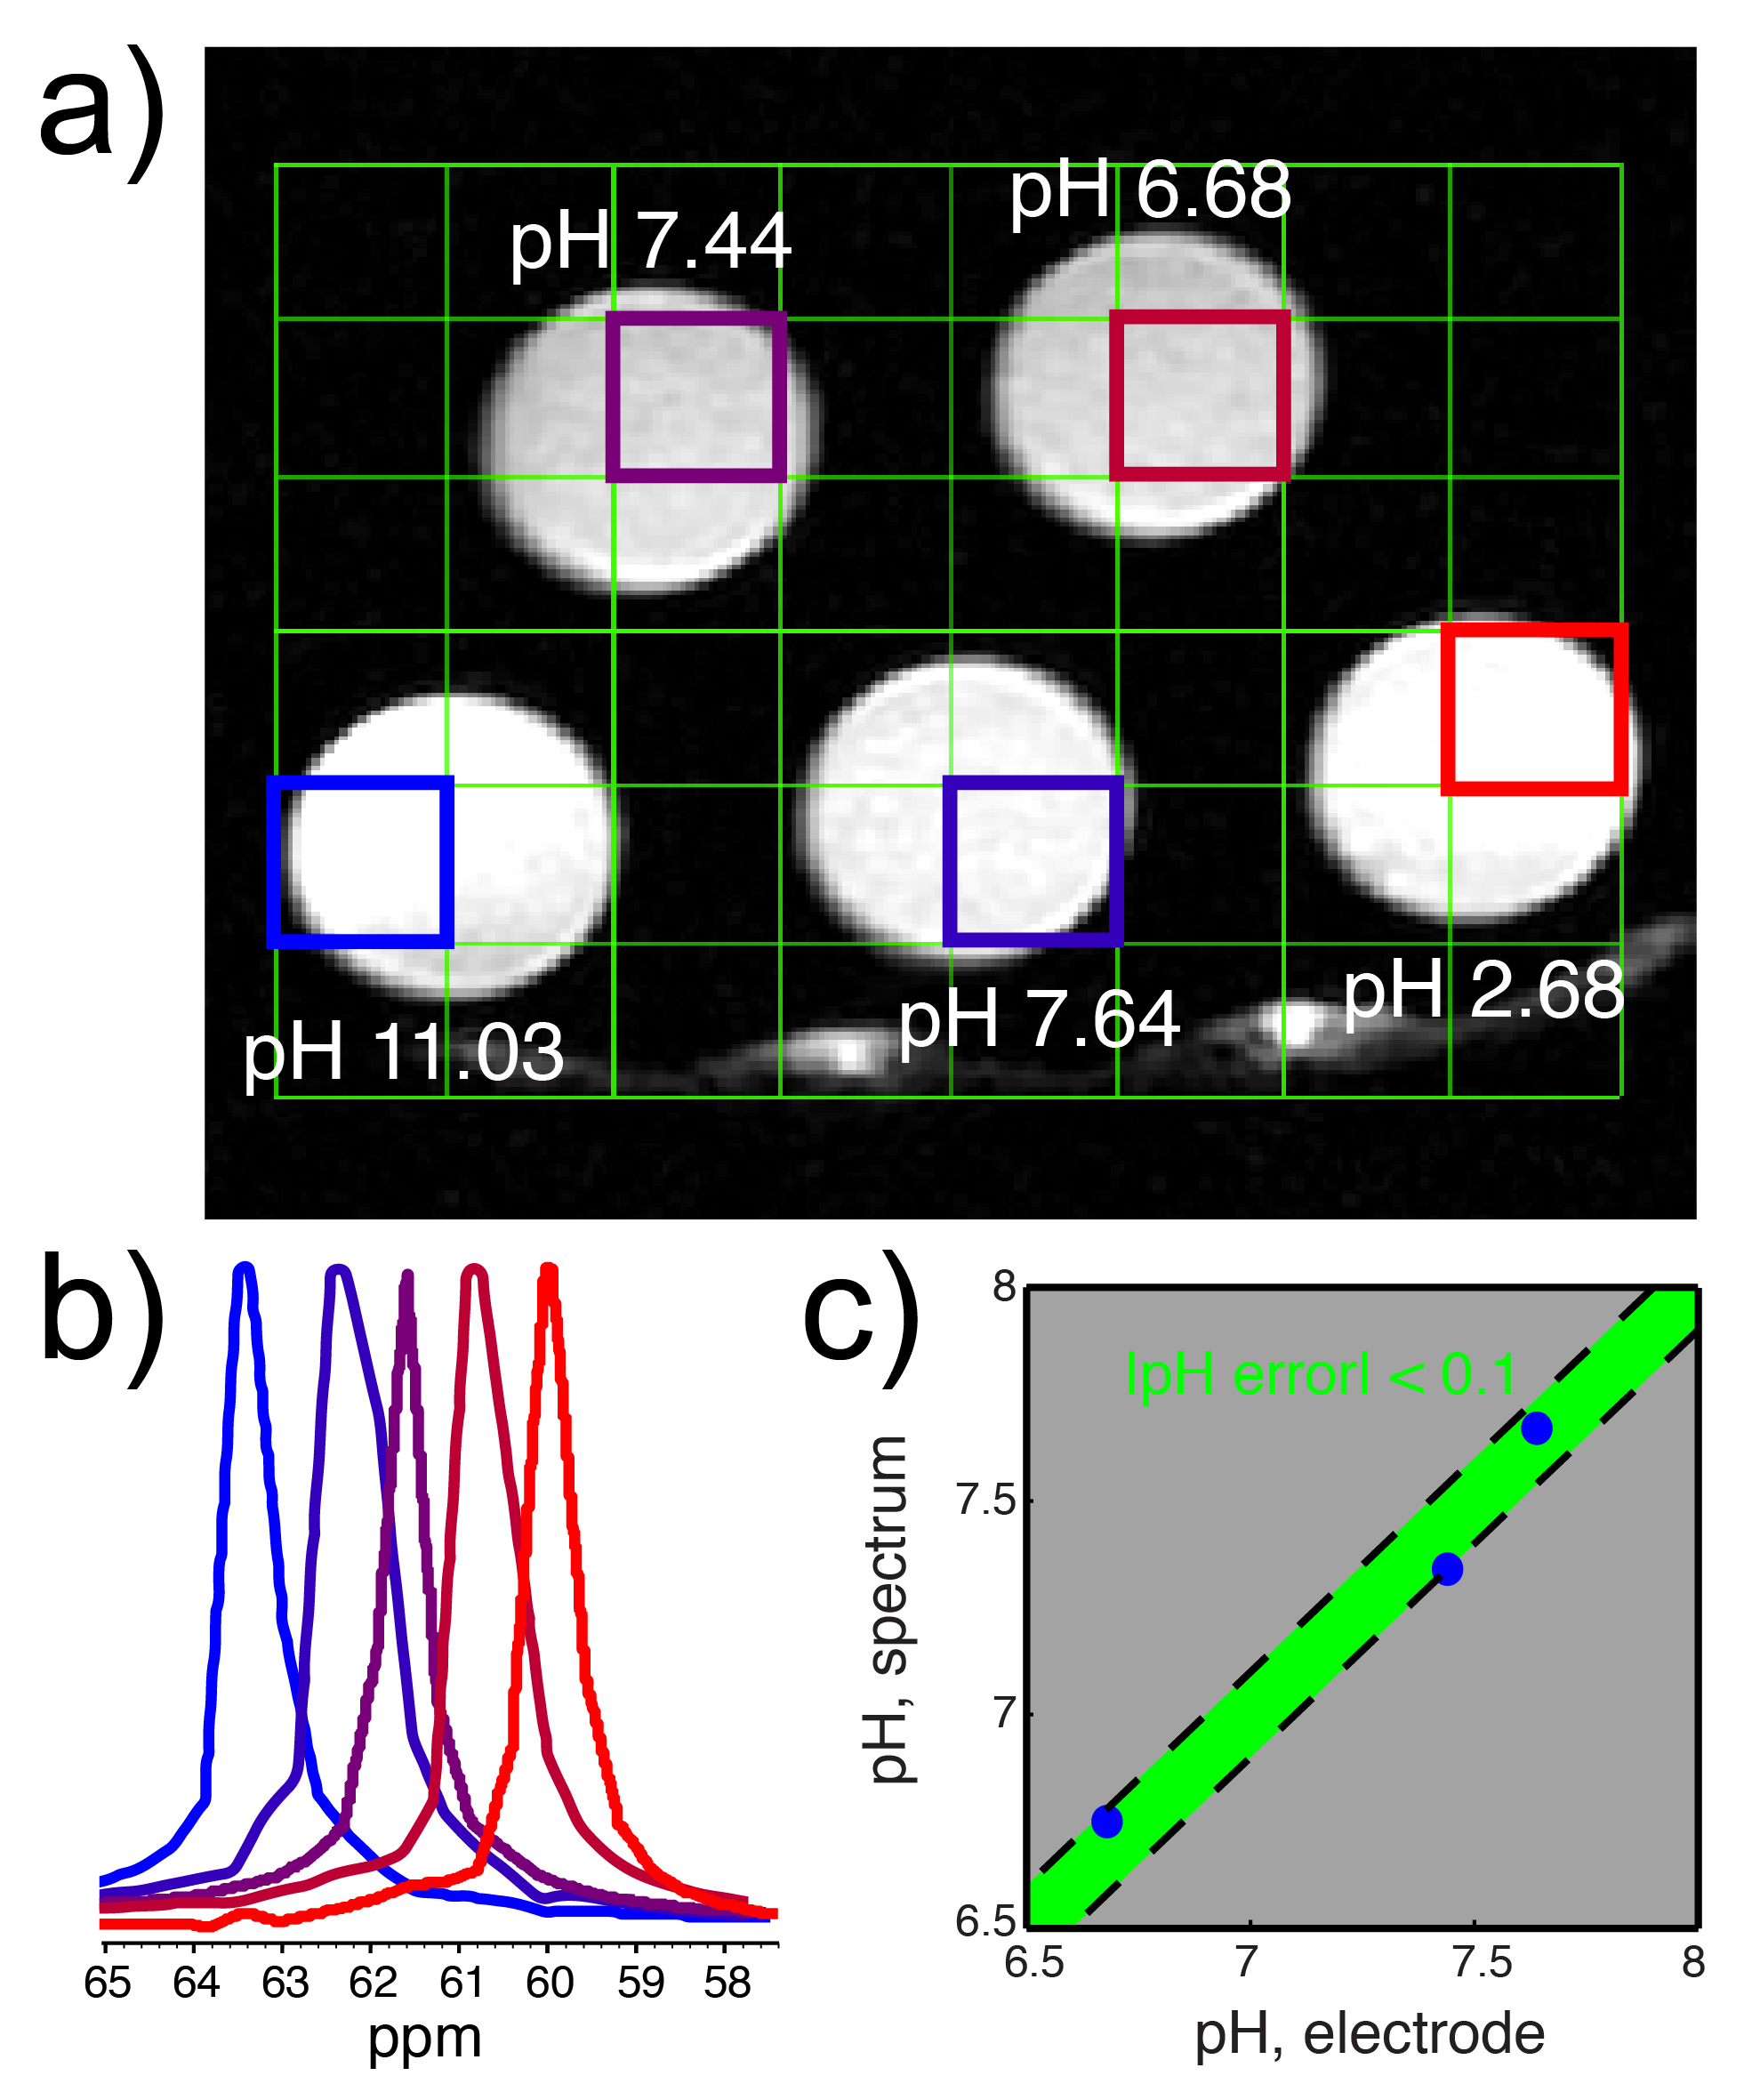
pH imaging phantom: HP DEMA and tBuOH were diluted to ~5mM each and titrated in five separate tubes to various pH values. The phantom was imaged with a 13C 2D CSI sequence (10x10 matrix, 10° hard pulses, 7.5mm isotropic in-plane resolution). After imaging, dynamic 13C MRS was performed for 3T T1 measurement (10° hard pulses, TR = 3s, n = 2).
Mouse tumor pH imaging: A transgenic adenocarcinoma of the mouse prostate (TRAMP) mouse was injected with 350μL of ~50mM DEMA and tBuOH. A 2D CSI sequence was performed 45s after injection start (6x8 matrix, 3cm axial slab excitation, variable flip angle scheme, centric phase encoding in axial and lateral directions, 5mm isotropic in-plane resolution). Spectra were 4x zero-filled and 10Hz apodized.
Results
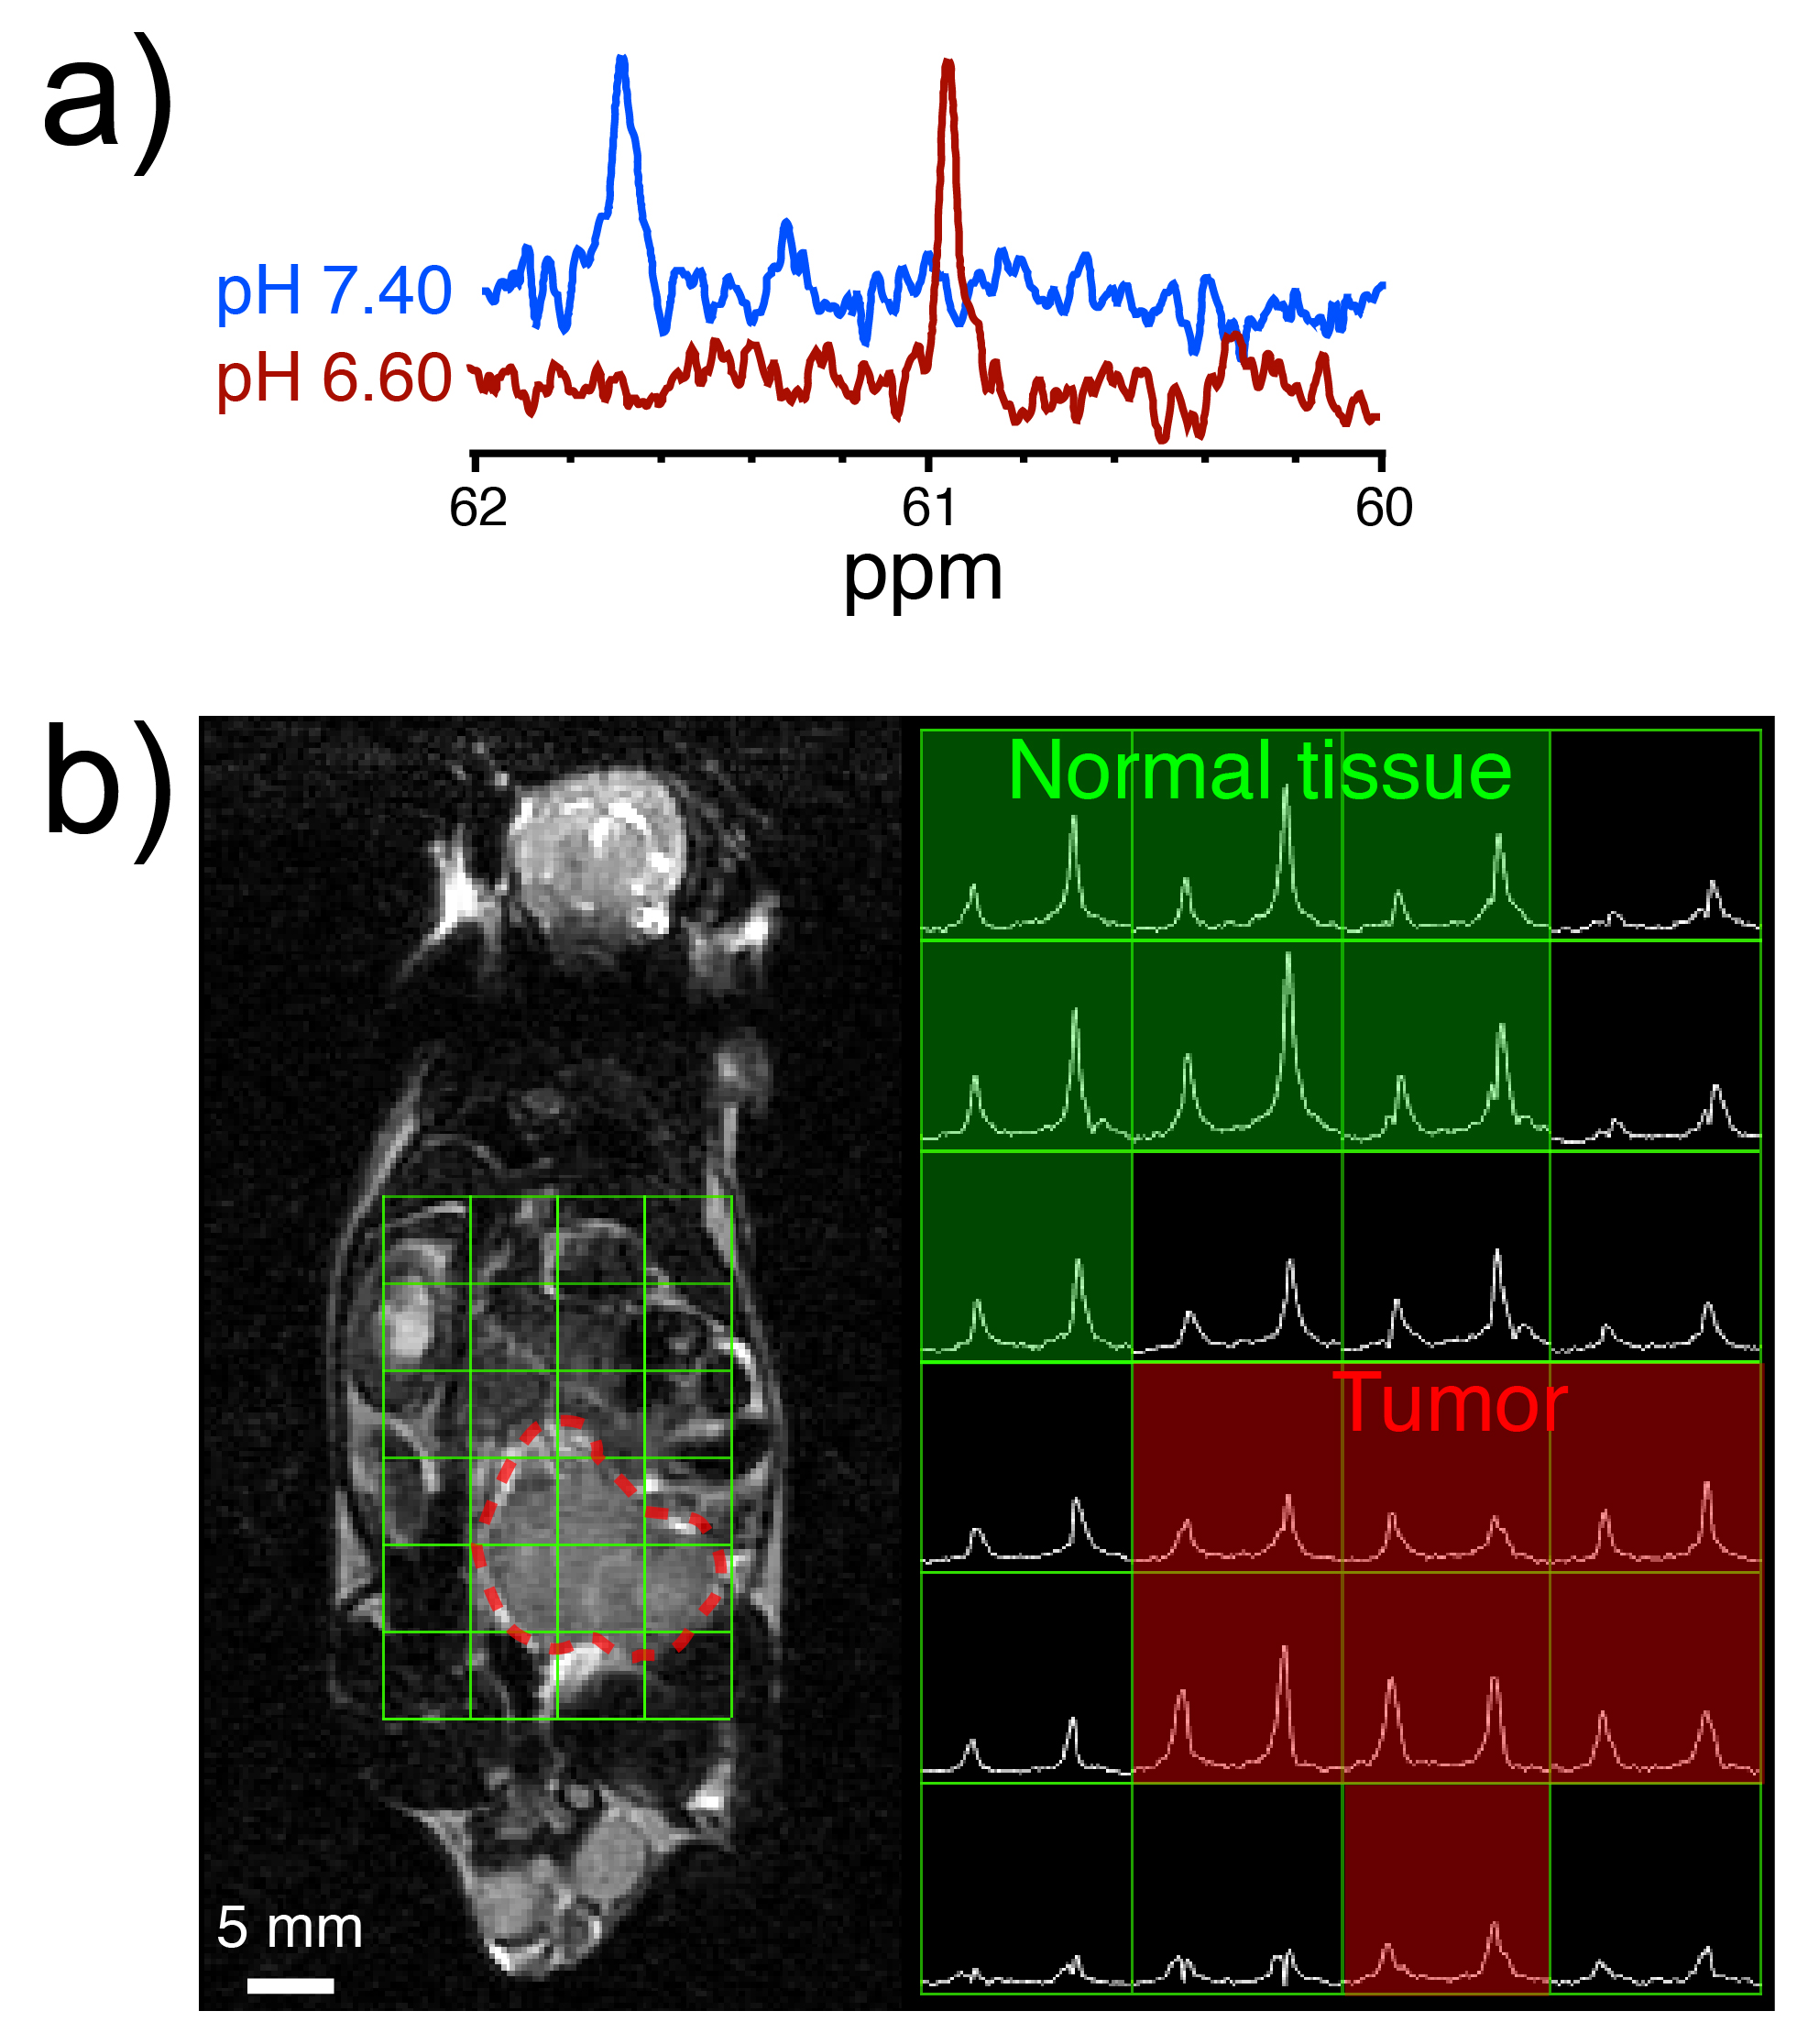
Two of ten compounds demonstrated a significant 13C Δppm over the physiologic pH range (Figure 1). Of these two, DEMA was chosen for further development based upon preliminary T1 relaxation measurements (87s versus 38.2s). DEMA had a pKa near physiologic pH (pKa,2 = 7.39, 37°C) and a pH-sensitive 13C nucleus that shifted 1.66ppm downfield from pH 6.5 to 7.4 (Figure 2). The measured pKa matched closely with the commonly reported value of 7.203. The solution-state T1 and back-calculated polarization measured at 11.7T were 105.6 ± 5.2s and 13.7 ± 0.6%, respectively. At 3T, the measured T1 value for DEMA was 84.3 ± 1.4s. HP spectral and electrode pH measurements agreed within 0.1 pH unit, both in 11.7T spectroscopy (Figure 3) and 3T phantom imaging (Figure 4). Changes in chemical shift were maintained over the physiologic range in serum (Figure 5a). Imaging in a TRAMP mouse demonstrated excellent signal to noise ratio (Figure 5b). No toxic effects were observed.Discussion
Unlike 13C-bicarbonate, which represents the mainstay of in vivo HP interstitial pH imaging4-7 and calculates the pH from intensities of two separate resonances, DEMA exhibits a single resonance with a pH-dependent chemical shift. We have recently reported a similar 13C approach for measuring pH via chemical shift8. Such compounds may circumvent low SNR concerns regarding peak intensity quantification, particularly at pH values far from the pKa. The pH-sensitive 13C nucleus of DEMA is a quaternary carbon, and it exhibits a long T1 and upfield chemical shift relative to the pH-insensitive 13C nucleus of tBuOH9. By copolarizing these two compounds, we demonstrated accurate pH measurement in vitro. We obtained high SNR imaging data in a preliminary TRAMP mouse experiment, with some heterogeneity in the Δppm observed between the two HP resonances. While a small shift towards acidic pH was observed in the TRAMP tumor, the acidic shift was not as large as expected based on prior studies5,6, and ongoing studies are investigating the rationale for this finding and how to correct it.Conclusion
We report a novel compound for pH measurement via 13C MRS, [2-13C,D10] diethylmalonic acid (DEMA). The pH is measured via changes in MR chemical shift, potentially circumventing SNR limitations found with HP bicarbonate. The HP imaging pH accuracy, long T1 values, and absence of observable toxicity make DEMA an excellent candidate for high spatial resolution in vivo pH mapping.Acknowledgements
The authors wish to thank Dr. Robert Bok and Zihan Zhu for their help with animal handling and injection.
Grants: R01-CA166766; SNMMI-ERF Mitzi and William Blahd, MD, Pilot Grant; RSNA Research Fellow Grant
References
1. Crane, J. C., Olson, M. P. & Nelson, S. J. SIVIC: Open-Source, Standards-Based Software for DICOM MR Spectroscopy Workflows. International Journal of Biomedical Imaging 2013, 1–12 (2013).
2. Gillies, R. J., Liu, Z. & Bhujwalla, Z. 31P-MRS measurements of extracellular pH of tumors using 3-aminopropylphosphonate. American Journal of Physiology-Cell Physiology 267, C195–C203 (1994).
3. Nachod, F. C. Determination of organic structures by physical methods. (Academic Press, 1955).
4. Gallagher, F. A. et al. Magnetic resonance imaging of pH in vivo using hyperpolarized 13C-labelled bicarbonate. Nature 453, 940–943 (2008).
5. Wilson, D. M. et al. Multi-compound polarization by DNP allows simultaneous assessment of multiple enzymatic activities in vivo. Journal of Magnetic Resonance 205, 141–147 (2010).
6. Korenchan, D. E. et al. Dynamic nuclear polarization of biocompatible 13C-enriched carbonates for in vivo pH imaging. Chemical Communications 52, 3030–3033 (2016).
7. Drachman, N. et al. In vivo pH mapping of injured lungs using hyperpolarized [1- 13C]pyruvate. Magnetic Resonance in Medicine (2016). doi:10.1002/mrm.26473
8. Flavell, R. R. et al. Application of Good's buffers to pH imaging using hyperpolarized 13C MRI. Chemical Communications 51, 14119–14122 (2015).
9. Grant, A. K., Vinogradov, E., Wang, X., Lenkinski, R. E. & Alsop, D. C. Perfusion imaging with a freely diffusible hyperpolarized contrast agent. Magnetic Resonance in Medicine 66, 746–755 (2011).
Figures